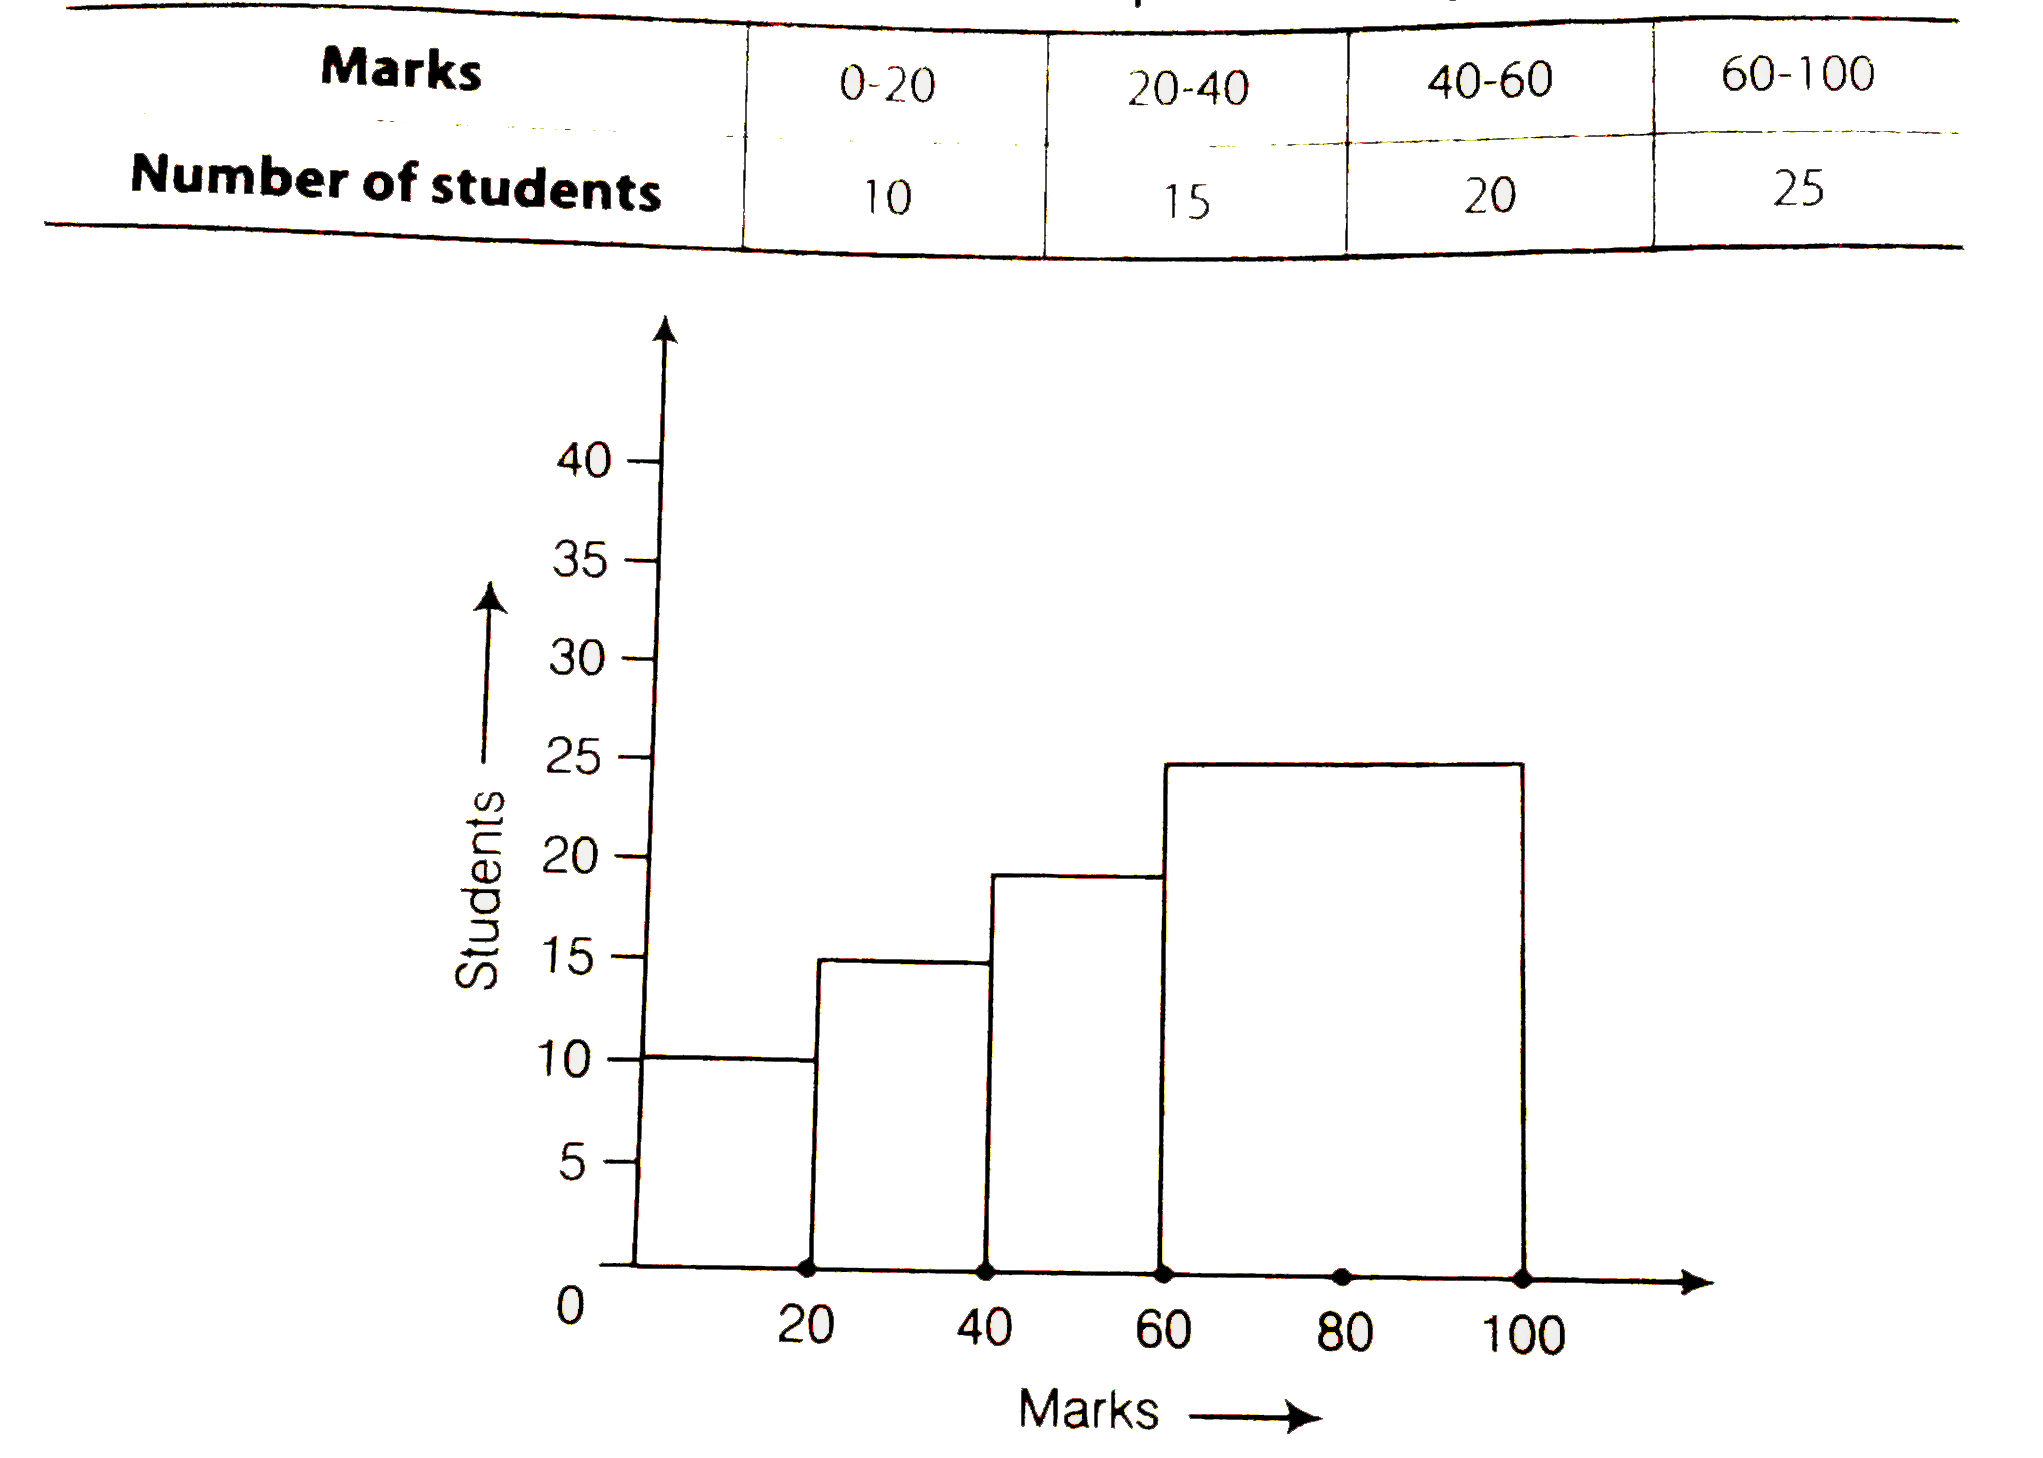
The frequency distributions been represented graphically as follows.

Is this representation correct?
A
Yes
B
No
C
cannot say
D
None
Video Solution
Text Solution
The correct Answer is:B
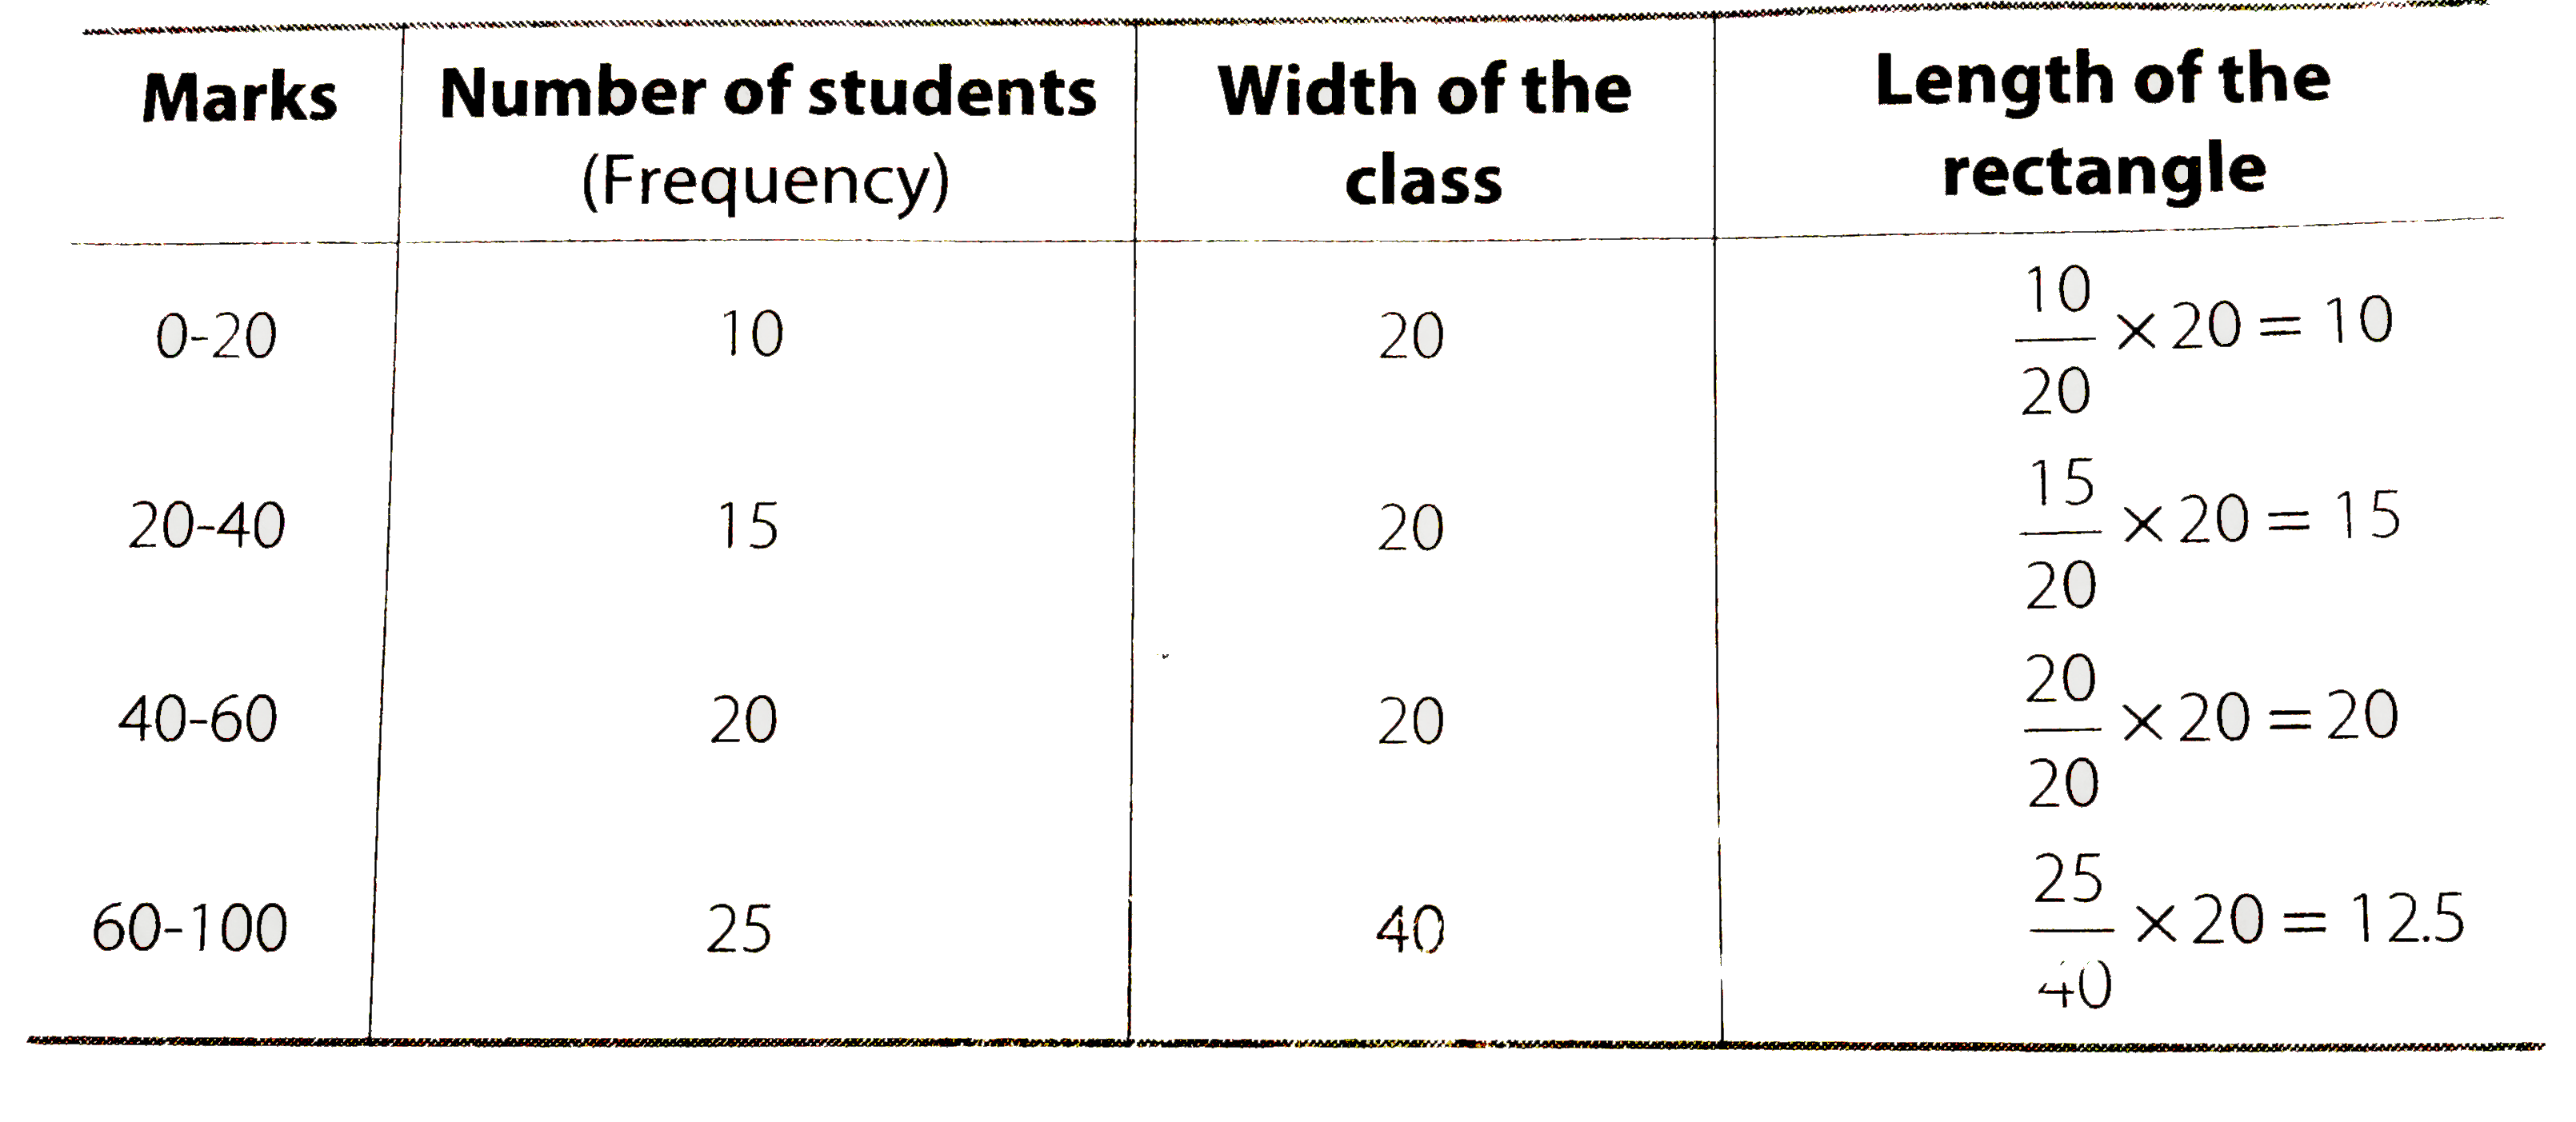
No, here the widths of the rectangles are varying, so we need to make certain modifications in the length of the reactanlges so that the areas are proportional to the frequencies. We proceed as follows
1. Select a class interval with the minimum class size, here the minimum class is 20.
2. The length of the reactangles are then modified to be proportionate to the class size 20.
Now, we get the following modified table.

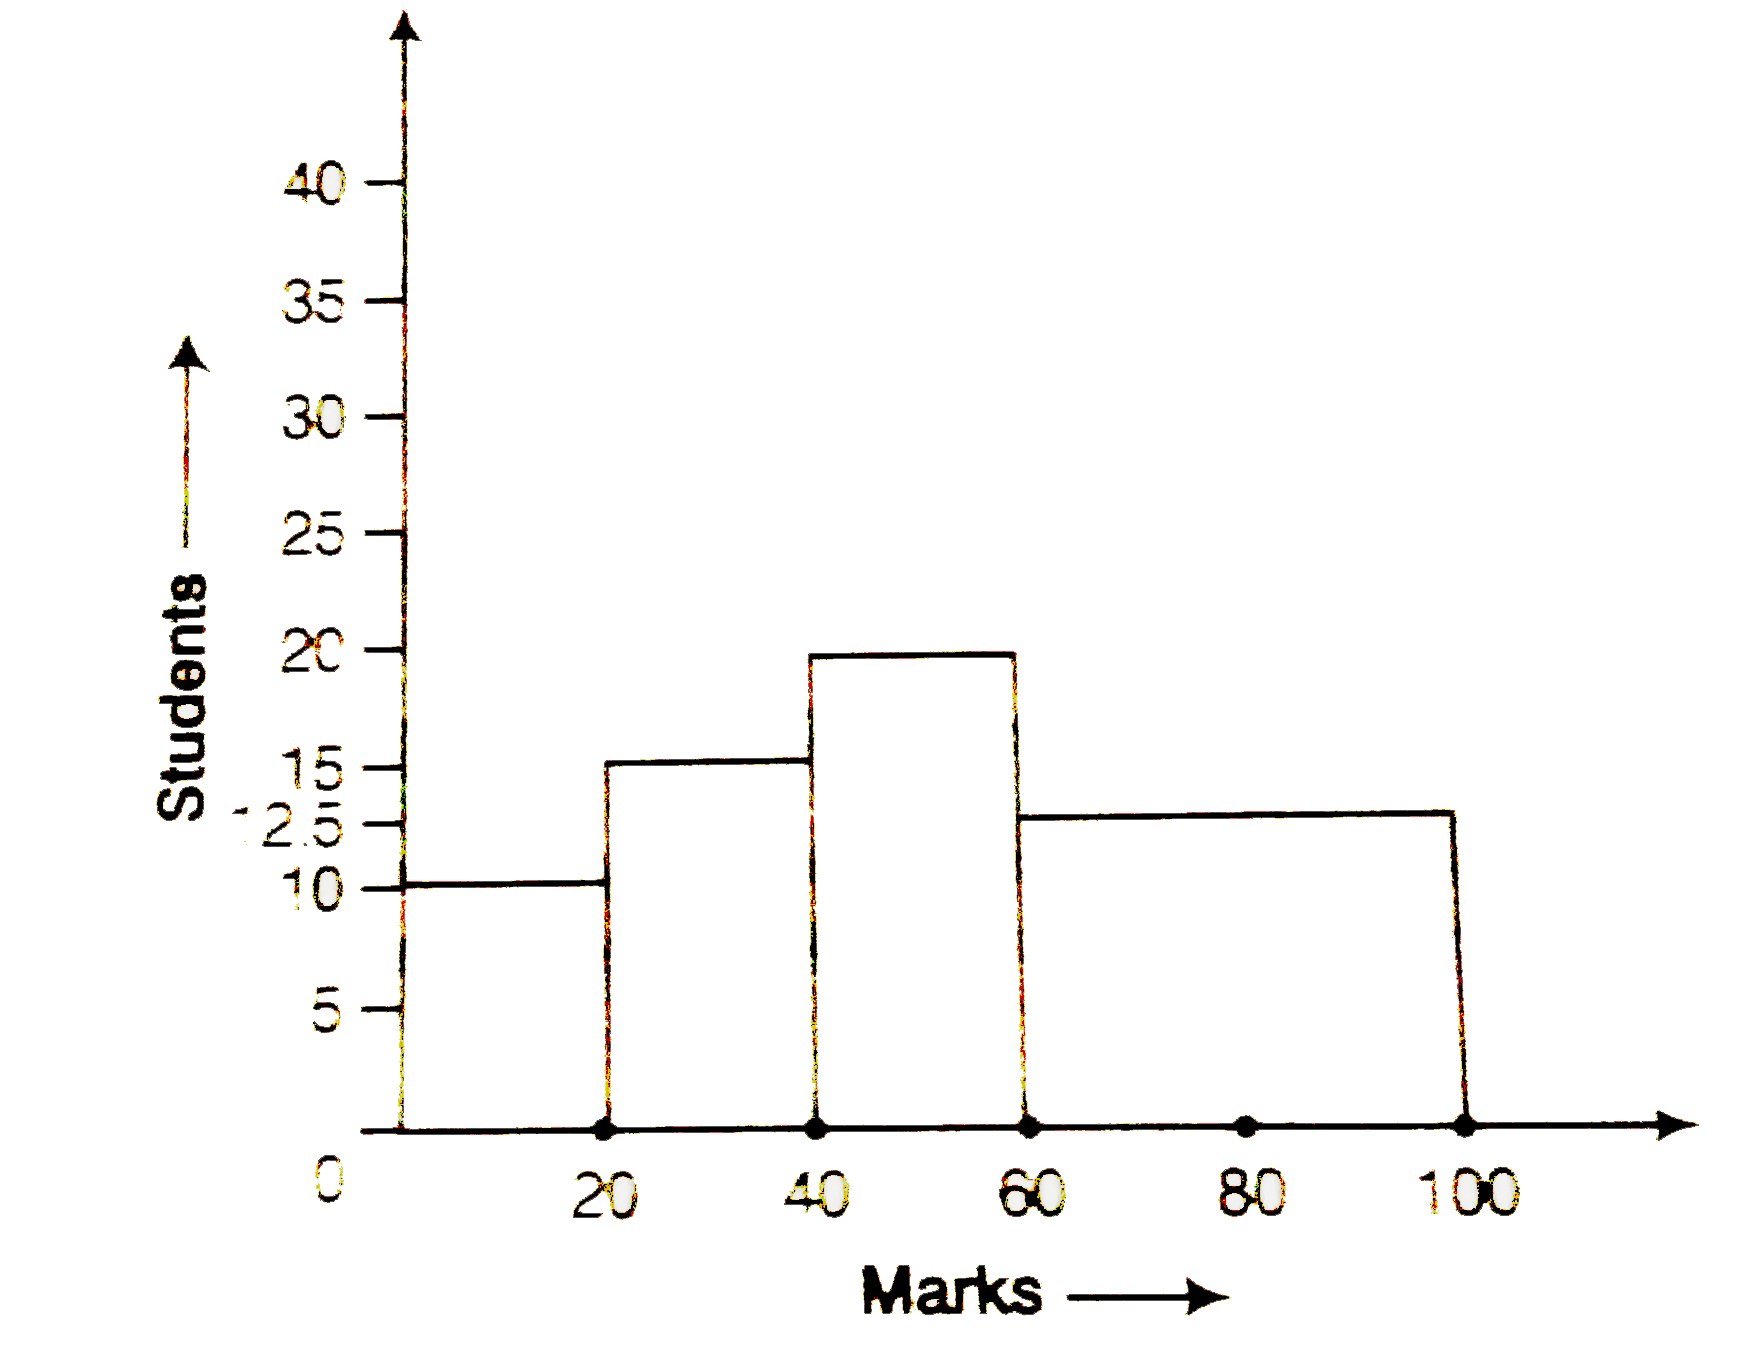
So, the correct histogram with varying width is given below.

|
Topper's Solved these Questions
- STATISTICS AND PROBABILITYBOOK - NCERT EXEMPLARCHAPTER - STATISTICS AND PROBABILITYEXERCISE - LONG ANSWER TYPE QUESTIONS
5 Videos
- QUADRILATERALS BOOK - NCERT EXEMPLARCHAPTER - QUADRILATERALS EXERCISE - Quadrilaterals
56 Videos
- TRIANGLESBOOK - NCERT EXEMPLARCHAPTER - TRIANGLESEXERCISE - Triangles
55 Videos
Similar Questions
Knowledge Check
The frequency distributions been represented graphically as follows.

Is this representation correct?AYesBNoCcannot sayDNoneThe mode of a frequency distribution is obtained graphically from
Aa frequency curveBa frequency polygonCa histogramDan ogive
Graphical Representation
View SolutionGraphical Representation
View SolutionThe median of a frequency distribution is found graphically with the help of
View SolutionGraphical representation of raoults law
View SolutionGraphical Representation Of Work
View SolutionThe mode of a frequency distribution can be determined graphically from (a) Histogram (b) Frequency polygon (c) Ogive (d) Frequency curve
View Solution
