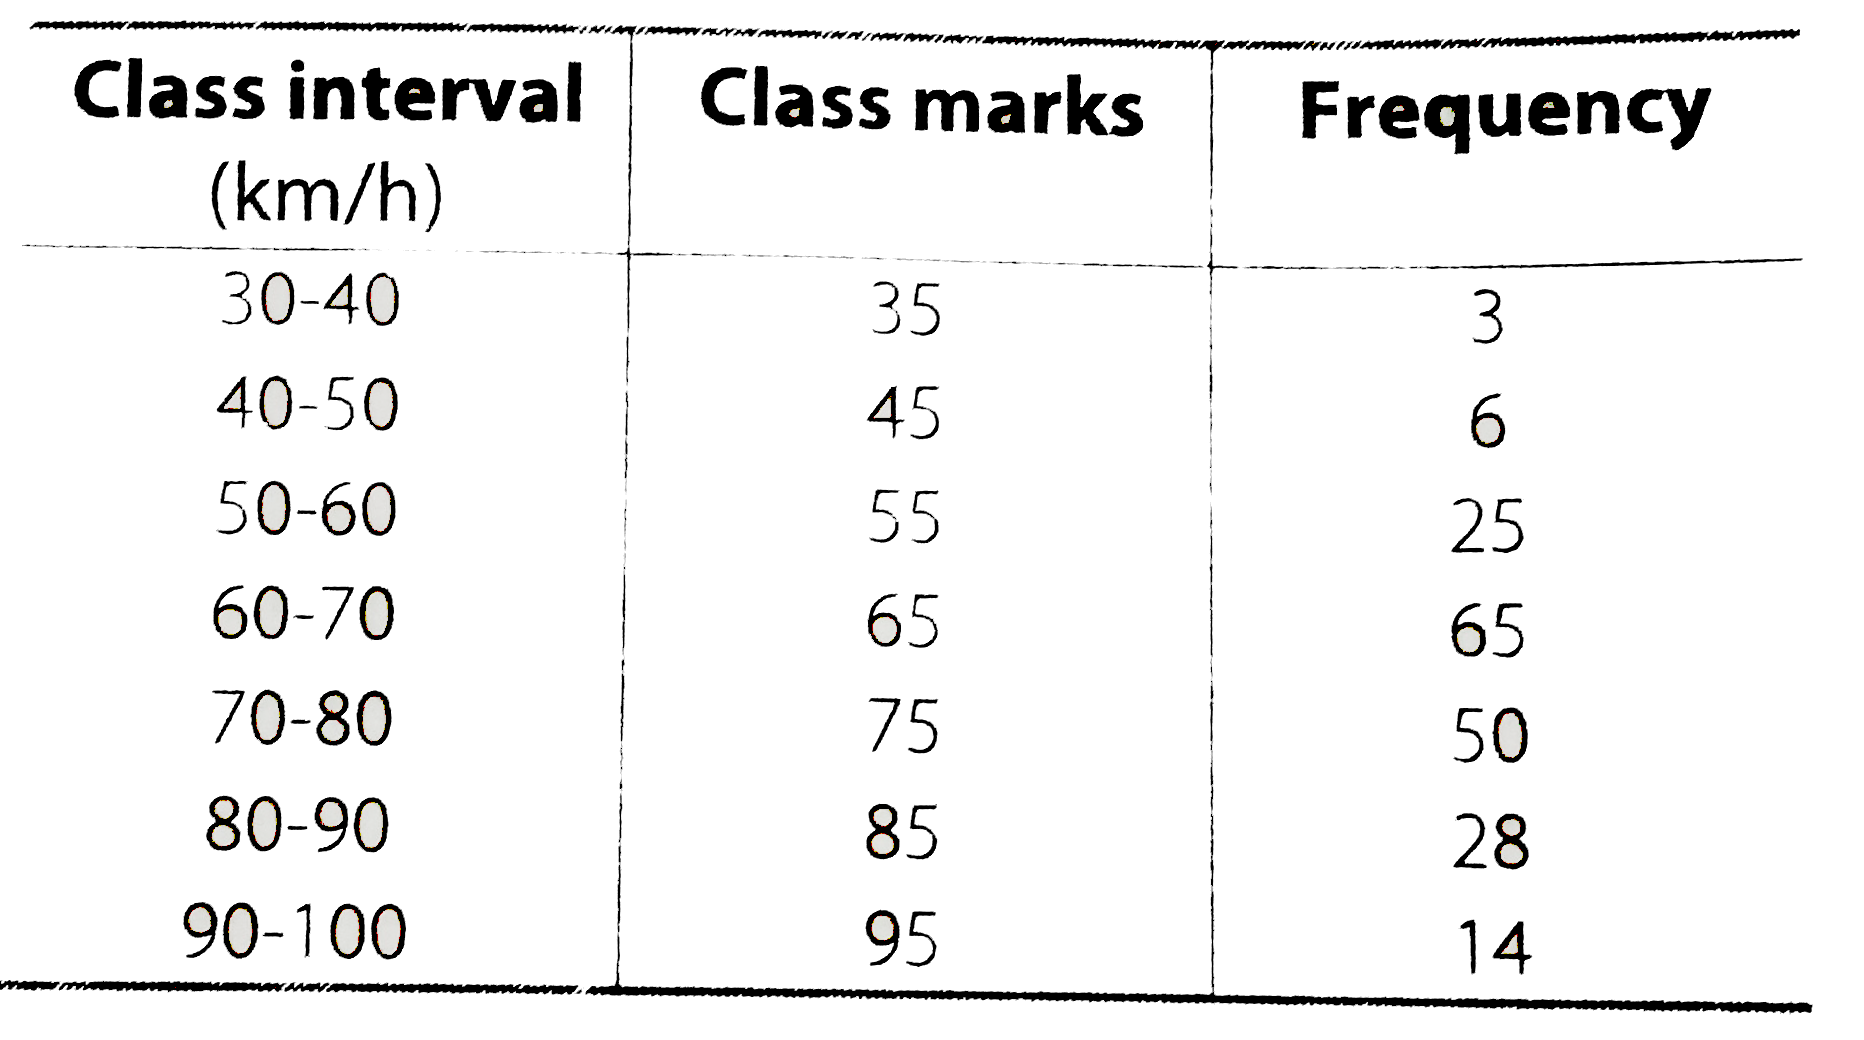
Refer to Q. 7. Draw the frequency polygon representing the above data without drawing the histogram.
Text Solution
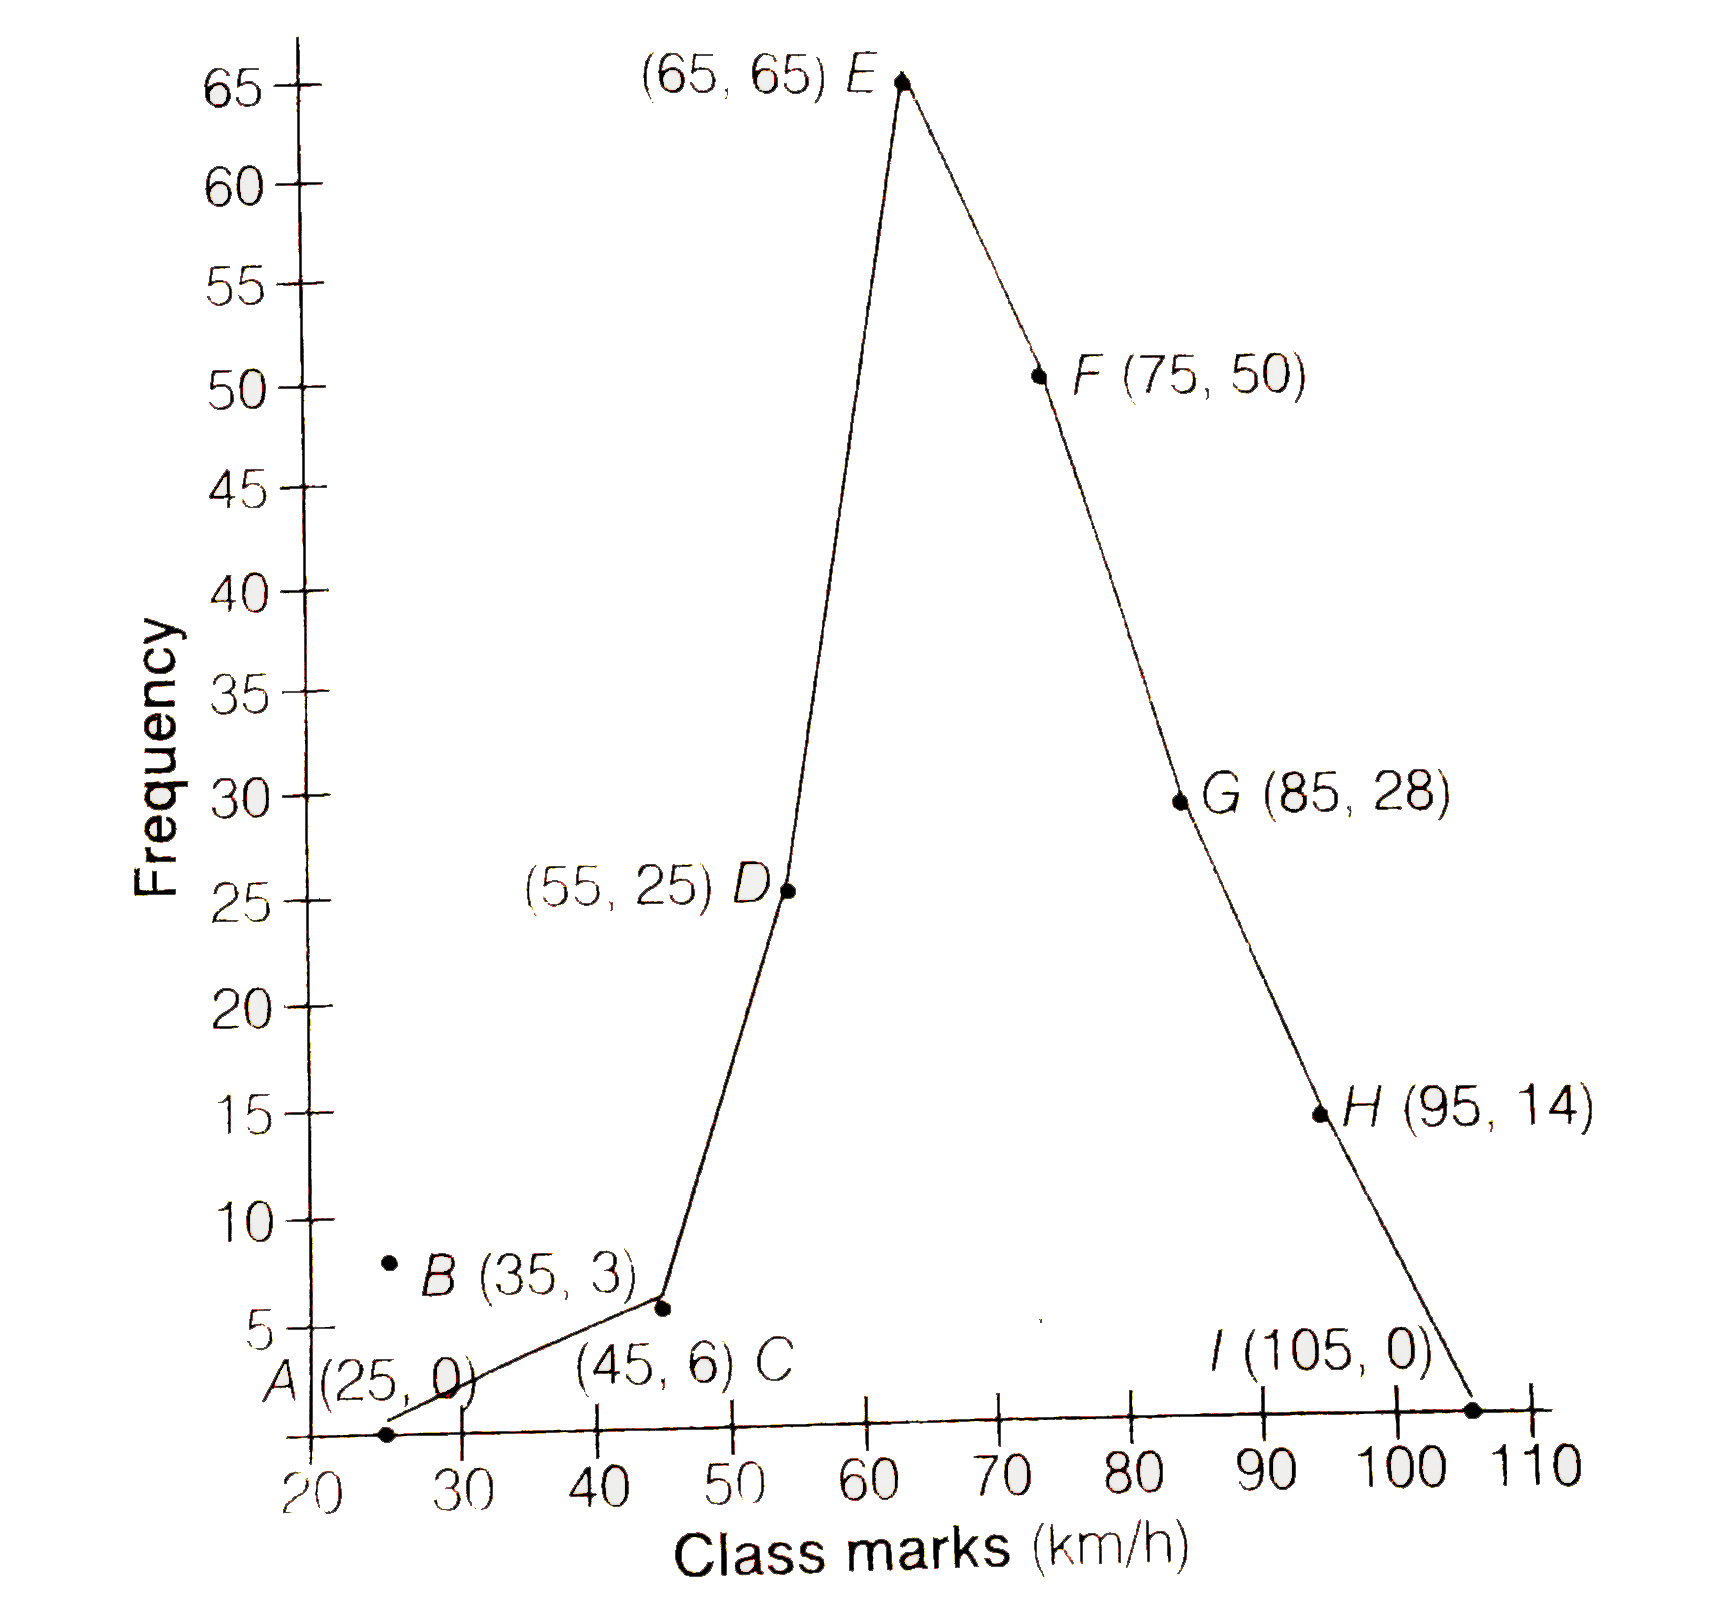
We have to draw a frequency polygon without a histogram.
Firstly, we find the class marks of the classes given that is 30-40, 40-50, 50-60, 60-70……..
∴ The class mark =30+402
=702=35
Similarly, we can determine the class marks of other classes.
So, table for class marks is shown below.

We can draw a frequency polygon by plotting the class marks along the horizontal axis and the frequency along the vertical axis. Now, plotting all the points B (35,3), C(45,6), D(55,25), E(65,65), F(75,50), G(85,28), H(95,14), also plot the point corresponding to the considering classes 20-30 and 100-110 each with frequency 0. Join all these point line segments.

|
Topper's Solved these Questions
- STATISTICS AND PROBABILITYBOOK - NCERT EXEMPLARCHAPTER - STATISTICS AND PROBABILITYEXERCISE - LONG ANSWER TYPE QUESTIONS
5 Videos
- QUADRILATERALS BOOK - NCERT EXEMPLARCHAPTER - QUADRILATERALS EXERCISE - Quadrilaterals
56 Videos
- TRIANGLESBOOK - NCERT EXEMPLARCHAPTER - TRIANGLESEXERCISE - Triangles
55 Videos
Similar Questions
Draw the frequency polygon to represent the following data.

View SolutionDraw a frequency polygon to represent the following data.

View SolutionDraw the frequency polygon representing the following frequency distribution

View SolutionDraw the frequency polygon for the following distribution :

View SolutionDraw a frequency polygon from the following data:

View SolutionDraw frequency polygons for each of the following :
Without using histogram.

View SolutionMake a frequency polygon and histogram using the given data :

View SolutionDraw frequency polygons for each of the following frequency distributions :
without using histogram.

View SolutionDraw a histogram and frequency polygon from the following data:

View SolutionDraw the histogram to represent the following data.

View Solution
