The given pie chart shows the percentage of students enrolled for the courses A, B, C, D and E in a university and the table shows the percentage of students that passed, out of the enrolled students.
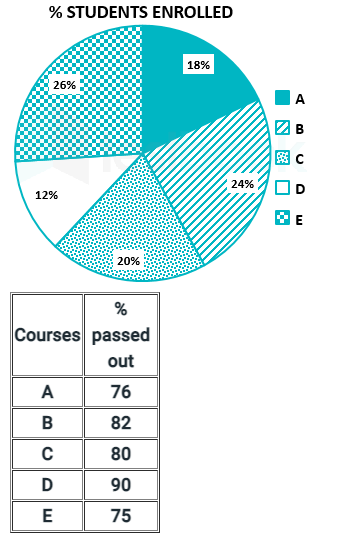
If the total number of students is 60000, then the total number of students who did not pass in the courses A, C is:
7852
8254
7682
4992
The correct Answer is:D
Step by step video & image solution for The given pie chart shows the percentage of students enrolled for the courses A, B, C, D and E in a university and the table shows the percentage of students that passed, out of the enrolled students. If the total number of students is 60000, then the total number of students who did not pass in the courses A, C is: by Maths experts to help you in doubts & scoring excellent marks in Class 14 exams.
Updated on:21/07/2023Similar Questions
The given pie chart shows the percentage of students enrolled for the courses A, B, C, D and E in a university and the table shows the percentage of students that passed, out of the enrolled students.
दिया गया पाई चार्ट एक विश्वविद्यालय में पाठ्यक्रम A, B, C, D और E के लिए नामांकित छात्रों के प्रतिशत को दर्शाता है और तालिका उन छात्रों का प्रतिशत दिखाती है, जो नामांकित छात्रों में से उत्तीर्ण हुए हैं।
 If the total number of students is 60000, then the total number of students who did not pass in the
courses A, C is:
यदि छात्रों की कुल संख्या 60000 है, तो कुल छात्रों की संख्या, जो पाठ्यक्रम A, C में उत्तीर्ण नहीं हुए हैं:
View SolutionThe pie chart given below shows the number of students in 6 different sections. The total number of students is 1800.
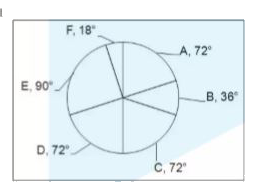
What is the total number of students in section E, C and F?
View Solution
Knowledge Check
The given pie chart shows the percentage of students enerolled into the colleges A,B,C,D,E and F in a city , and the table shows the ratio of boys to girls in the college .
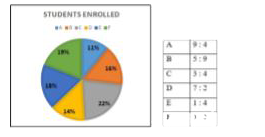
Based on this information , if the total number of students is 9800, then the number of girls in the college B is :A504B560C280D1008the pie chart given below shows the distribution of students who like the given 5 sports. . The total number of students is 960.
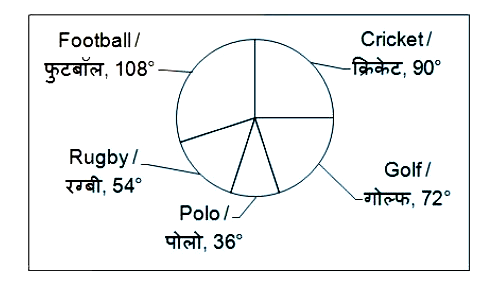
What is the average number of students who like Golf and Cricket?A240B432C192D216The given pie-chart represents the percentage of students enrolled in five different sports. The total number of students is 2800.
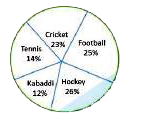
What is the average number of student enrolled in Hockey and Tennis together ?A560B580C540D460
100 students appeared in annual exami-nation. 60 students passed. The ratio of the number of students who failed to the total number of students is
View SolutionThe given pie-chart represtns the percentage of students enrolled in five different sports. The total number of students is 2800.

What is the average number of students enrolled in Hockey and Tennis together?
View SolutionThe pie chart given below shows the number of students in 5 sections .The number of students is 7200.
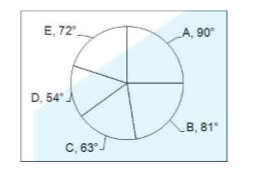
What is the total number of students in section E and section B?
View SolutionThe pie-chart given below shows the number of students who like the five beverages Pepsi, Coke, Fanta, Frooti and Dew. The total number of students is 540.
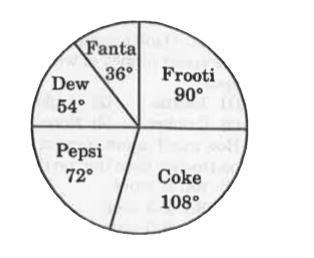
What is the total number of students who like Frooti and Pepsi?
View SolutionThe pie chart given below shows the distribution of students who like the given 5 sports. The total number of students is 960.
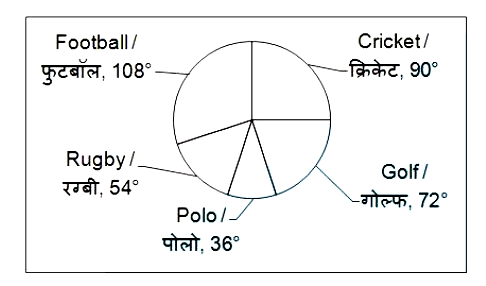
What is the difference between the number of students who like Cricket and those who like Golf?
View Solution
