The given pie chart shows the percentage of students enrolled for the courses A, B, C, D and E in a university and the table shows the percentage of students that passed, out of the enrolled students.
दिया गया पाई चार्ट एक विश्वविद्यालय में पाठ्यक्रम A, B, C, D और E के लिए नामांकित छात्रों के प्रतिशत को दर्शाता है और तालिका उन छात्रों का प्रतिशत दिखाती है, जो नामांकित छात्रों में से उत्तीर्ण हुए हैं।

 If the total number of students is 60000, then the total number of students who did not pass in the
courses A, C is:
यदि छात्रों की कुल संख्या 60000 है, तो कुल छात्रों की संख्या, जो पाठ्यक्रम A, C में उत्तीर्ण नहीं हुए हैं:
7852
4992
8254
7628
Step by step video & image solution for The given pie chart shows the percentage of students enrolled for the courses A, B, C, D and E in a university and the table shows the percentage of students that passed, out of the enrolled students. दिया गया पाई चार्ट एक विश्वविद्यालय में पाठ्यक्रम A, B, C, D और E के लिए नामांकित छात्रों के प्रतिशत को दर्शाता है और तालिका उन छात्रों का प्रतिशत दिखाती है, जो नामांकित छात्रों में से उत्तीर्ण हुए हैं। If the total number of students is 60000, then the total number of students who did not pass in the courses A, C is: यदि छात्रों की कुल संख्या 60000 है, तो कुल छात्रों की संख्या, जो पाठ्यक्रम A, C में उत्तीर्ण नहीं हुए हैं: by Maths experts to help you in doubts & scoring excellent marks in Class 14 exams.
Updated on:21/07/2023Topper's Solved these Questions
Similar Questions
The graphs of the equations 3x+y-5=0 and 2x-y-5=0 intersect at the point P(α,β). What is the value of (3α+β) ?
समीकरण 3x+y-5=0 तथा 2x-y-5=0 के आरेख एक बिंदु P(α,β) पर एक-दूसरे को काटते है (3α+β) का मान क्या है ?
View SolutionAfter giving two successive discounts, each of x%, on the marked price of an article, total discount is Rs. 259.20. If the marked price of the article is Rs. 720, then the value of x is :
View SolutionStudy the pie-chart and answer the questions: Break up (degree wise) of students in terms of specialization in different areas(A, B, C, D & E) in an MBA program. The number of students specialising in E is what percent more than that of students specialising in C? पाई-चार्ट का अध्ययन करें और प्रश्नों के उत्तर दें: एमबीए प्रोग्राम में विभिन्न क्षेत्रों (ए, बी, सी, डी एंड ई) में विशेषज्ञता के मामले में छात्रों का ब्रेक अप (डिग्री वार)। E में विशेषज्ञता प्राप्त छात्रों की संख्या C में विशेषज्ञता वाले छात्रों से कितने प्रतिशत अधिक है?
View SolutionThe following table shows the number of students of 7 college participating in extra curricular activities: निम्न सारणी उन कॉलेजों के छात्रों की संख्या दर्शाती है, जो पाठ्येत्तर क्रियाकलापों में भाग लेते हैं। Read the table and answer the following question. तालिका पढ़ें और निम्नलिखित प्रश्नों के उत्तर दें। Percentage of the number of students in activity II to that of IV is क्रियाकलाप II में छात्रों की संख्या का क्रियाकलाप IV में छात्रों की संख्या के साथ प्रतिशत है-
View SolutionThis table shows the number of students studying in various streams in different colleges. निम्नलिखित तालिका पांच कॉलेजों के तीन विषयों में पढ़ने वाले छात्रों की संख्या दर्शाती है | The number of students in the science stream of college C is approximately what percentage of students studying in that college? कॉलेज C में विज्ञान विषय में छात्रों की संख्या उस कॉलेज में पढ़ने वाले छात्रों की संख्या का लगभग कितना प्रतिशत है ?
View SolutionThe following table shows the percentage distribution of students in various disciplines from five different colleges. निम्नलेखित तालिका पांच अलग-अलग कॉलेजों के विभिन्न विषयों में छात्रों का प्रतिशत वितरण दर्शाती है | If the data of the total students’ college wise, is represented by a pie-chart, what is the central angle of the sector representing college E (to nearest whole number)? यदि कॉलेज वार कुल छात्रों के आंकड़ों को एक पाई-चार्ट में प्रस्तुत किया जाए, तो कॉलेज E को दर्शन वाले खंड का केंद्रीय कोण क्या होगा ? ( निकटतम पूर्ण संख्या में )
View SolutionThe given Bar Graph presents the number of students enrolled for a vocational course in institutes A and B during a period of five years. दिया गया दंड आरेख A और B संस्थानों में पांच वर्षों की अवधि के दौरान व्यावसायिक पाठ्यक्रमों नामांकन लेने वाले छात्रों की संख्या को दर्शाता है | The total number of students enrolled in A during 2014, 2016 and 2018 is what percentage (correct to one decimal place) of the total number of students enrolled in B during the five years? 2014, 2016 और 2018 में A में नामांकन लेने वाले छात्रों की कुल संख्या इन पांच वर्षों के दौरान B में नामांकन लेने वाले छात्रों की कुल संख्या का कितना प्रतिशत ( एक दशमलव स्थान तक सही ) है ?
View SolutionIn the given bar graph, the percentage decrease in the number of students in Institute A in 2016 is what percent of students in 2015. इस दंड आरेख में संस्थान A में 2016 में छात्रों की संख्या में प्रतिशत कमी 2015 के छात्रों की संख्या का क्या प्रतिशत है ?
View SolutionThe given pie-chart, shows the percentage distribution of the expenditure incurred in publishing a book. Study the pie-chart and the answer the question based on it. / दिया गया पाई चार्ट किसी पुस्तक के प्रकाशन में हुए व्ययों के प्रतिशत वितरण को दर्शाता है | इस पाई चार्ट का अध्ययन करें तथा इस पर आधारित प्रश्न का उत्तर दें | In the given pie-chart, by what percentage the Royalty on the book is less than the Printing cost? / दिए गए पाई चार्ट के अनुसार, इस पुस्तक पर रॉयल्टी प्रकाशन की लागत से कितना प्रतिशत कम है ?
View SolutionThe given pie-chart favourite sport of students of a school. दिया गया पाई चार्ट एक विद्यालय के छात्रों के पसंदीदा खेल को दर्शाता है | In the given pie-chart, if there were 1280 students in all, how many liked football? इस पाई चार्ट के अनुसार, यदि कुल मिलाकर 1280 छात्र हैं, तो फुटबॉल कितने छात्रों को पसंद है ?
View SolutionThe given pie-chart favourite sport of students of a school. दिया गया पाई चार्ट एक विद्यालय के छात्रों के पसंदीदा खेल को दर्शाता है | In the given pie-chart, what is the difference in percentage between liking for football and basketball? इस पाई चार्ट के अनुसार, फुटबॉल तथा बास्केटबॉल पसंद करने के प्रतिशत में क्या अंतर है ?
View SolutionThe following table shows the number of students enrolled in different faculties in a college.
निम्नलिखित तालिका एक कॉलेज में अलग-अलग विषयों में नामांकित छात्रों की संख्या को दर्शाती है | The percentage of students studying in faculties other than Science is:
विज्ञान के अतिरिक्त अन्य विषयों की पढ़ाई करने वाले छात्रों का प्रतिशत है
View SolutionIn a particular year, the number of students enrolled in different streams in a college is as follows:
एक विशेष वर्ष में, किसी कॉलेज के विभिन्न विषयों में नामांकित छात्रों की संख्या इस प्रकार है : The percentage of girl students is:
छात्राओं का प्रतिशत है :
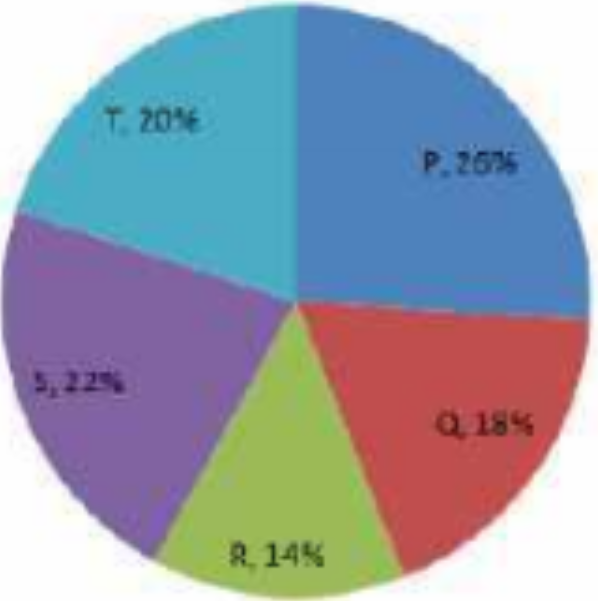
View SolutionThe following pie chart shows the percentage-wise distribution of the number of students in five different schools P, Q, R, S and T. The total number of students in all five schools together is 8400.
निम्नलिखित पाई चार्ट पांच अलग-अलग स्कूलों P, Q, R, S और T में छात्रों की संख्या के प्रतिशत को दर्शाता है। सभी पाँच स्कूलों में कुल छात्रों की संख्या 8400 है Find the average number of students in schools R and S together.
स्कूलों R और S में एक साथ छात्रों की औसत संख्या ज्ञात कीजिए।
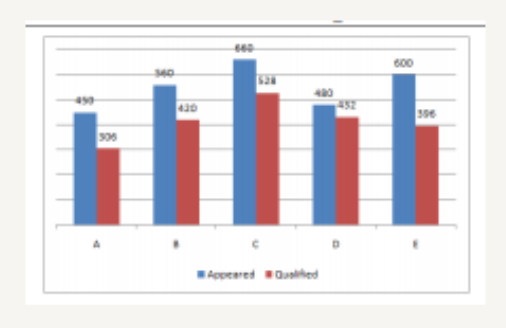
View SolutionThe following graph shows the data of the number of candidates that appeared and qualified for a competitive exam from the colleges A, B, C, D, E.
निम्नलिखित आरेख उन उम्मीदवारों की संख्या को दिखाता है जो कॉलेजों A, B, C, D, E से प्रतियोगी परीक्षा के लिए उपस्थित हुए और सफल हुए| Based on the information, the difference between the percentage of students that qualified, from
the colleges B and D is:
जानकारी के आधार पर, कॉलेजों B और D से सफल हुए छात्रों के प्रतिशत के बीच का अंतर है:
View Solution
