The given table shows the temperature of a place for 6 consecutive hours.

Calculate the difference between the highest and the lowest temperature of the place over the 6-hour period.
15∘C
28∘C
12∘C
20∘C
The correct Answer is:B
Step by step video, text & image solution for The given table shows the temperature of a place for 6 consecutive hours. Calculate the difference between the highest and the lowest temperature of the place over the 6-hour period. by Maths experts to help you in doubts & scoring excellent marks in Class 6 exams.
Topper's Solved these Questions
- BOOK - SCIENCE OLYMPIAD FOUNDATION CHAPTER - IMO QUESTION PAPER 2019-20 SET B EXERCISE - EVERYDAY MATHEMATICS10videos
IMO QUESTION PAPER 2019-20 SET B
- BOOK - SCIENCE OLYMPIAD FOUNDATION CHAPTER - IMO QUESTION PAPER 2019-20 SET B EXERCISE - ACHIEVERS SECTION5videos
IMO QUESTION PAPER 2019-20 SET B
- BOOK - SCIENCE OLYMPIAD FOUNDATION CHAPTER - IMO QUESTION PAPER 2019-20 SET AEXERCISE - LOGICAL REASONING1videos
IMO QUESTION PAPER 2019-20 SET A
- BOOK - SCIENCE OLYMPIAD FOUNDATION CHAPTER - IMO QUESTION PAPER 2020EXERCISE - Achievers section (HOTS)5videos
IMO QUESTION PAPER 2020
Similar Questions
The average of five consecutive odd number is 61. Then the difference between the highest and lowest numbers is
View SolutionFollowing number line shows the temperature in degree celsius 90∘C right ) at different places on a particular day. (a) Observe this number line and write the temperature of the places marked on it. (b) What is the temperature difference between the hottest and the coldest places among the above? (c) What is the temperature difference between Lahulspiti and Srinagar? (d) Can we say temperature of Srinagar and Shimla taken together is less than the temperature at Shimla? Is it also less than the temperature at Srinagar ?
View Solution
Knowledge Check
- Question 1 - Select One
The average of five consecutive odd numbers is 61. What is the difference between the highest and lowest numbers ?
A4B6C9D8 - Question 2 - Select One
Question Stimulus
The difference between the highest and lowest values in a given data is called itsADataBRangeCFrequencyDArray - Question 3 - Select One
The difference between the place value of 6 and the face value of 4 in 56431 is:
A999B5600C5996D2
The temperature at most of the places on the Earth varies between
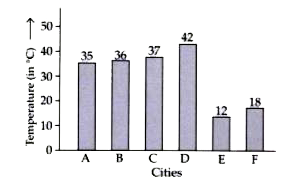
View SolutionThe bar graph shows the temperatures in 6 cities.

The difference between the maximum and the minimum temperature is ______ .View SolutionThe number line shows the temperature of places in India on a particular day (in °C).

What is the temperature difference between Sikkim and Kashmir?View SolutionThe number line shows the temperature of places in India on a particular day (in °C).

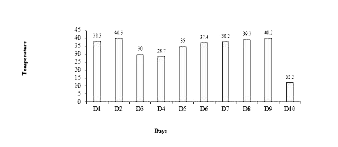
Find the sum of the temperatures of the coldest and hottest places.View SolutionThe Bar graph below presents the maximum temperature (in ∘C) of a city for 10 different days spread over serveral months.

What is the difference (in degree Celsius) between the highest and the lowest recorded maximum temperature from the data given for the days ?View Solution

