The total number of students who applied for government jobs in the five years in a state are given below.

Using the symbol to represent 500 students, answer the following questions.
(i) How many symbols are needed to represent the number of students who applied in 2014 ?
(ii) How many less symbols are needed to represent the number of students who applied in 2017 than those in 2015?
iii124
iii58
iii84
iii126
The correct Answer is:A
(i) No. of students applied in 2014 = 6000
∴ No. of symbols need to represent the students who applied in 2014 = 6000 = 500 = 12
(ii) No. of symbols needed to represent students who applied in 2017 = 5500 - 500 = 11
No. of symbols needed to represent students who applied in 2015 = 7500 - 500 = 15
∴15–11=4less symbols are needed to represent the number of students applied in 2017 than those in 2015.
Topper's Solved these Questions
- BOOK - SCIENCE OLYMPIAD FOUNDATION CHAPTER - IMO QUESTION PAPER 2019-20 SET B EXERCISE - EVERYDAY MATHEMATICS10videos
IMO QUESTION PAPER 2019-20 SET B
- BOOK - SCIENCE OLYMPIAD FOUNDATION CHAPTER - IMO QUESTION PAPER 2019-20 SET AEXERCISE - LOGICAL REASONING1videos
IMO QUESTION PAPER 2019-20 SET A
- BOOK - SCIENCE OLYMPIAD FOUNDATION CHAPTER - IMO QUESTION PAPER 2020EXERCISE - Achievers section (HOTS)5videos
IMO QUESTION PAPER 2020
Similar Questions
The total number of students who applied for scholarship in the last five years is given below :

Using the symbol to represent 500 students, answer the following questions.
(i) How many symbols are needed to represent the number of students in 2010 ?
(ii) How many more symbols are needed to represent the number of students in 2012 than in 2009 ?View SolutionA large number of students ...... applied for the Job.
(has/have)View Solution
Knowledge Check
- Question 1 - Select One
The line graph shows the number of students who passed with distinction in the given years from a certain university. Study the diagram and answer the following questions.
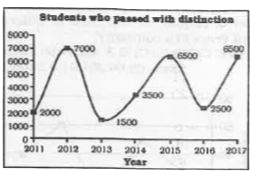
What was the difference between the number of students who passed with distinction between the years 2017 and 2014?A6000B5000C4000D3000 - Question 2 - Select One
The pie chart given below shorts the distribution of students who like the given 5 sports. The total number of students is 960.
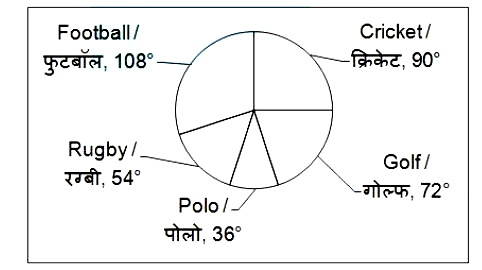
The number of students who like Golf is how much percent more than the number of students who like Rugby?A25B50C33.33D66.66
Total number of students of a school in different years is shown in the following table: Year, No. of Students 1996 1998 2000 2002 2004, 400 550 450 600 650 Represent the above data by a pictograph. Prepare a pictograph of students using one symbol an icon of a student to represent 100 students and answer the following questions: How many symbols represent total number of students in the year 2002? How many symbols represent total number of students in the year 1998? Prepare another pictograph of students using any other symbol each representing 50 students. Which pictograph do you find more informative?
View SolutionThe line graph shows the number of students of a certain university who passed in the given year in their final exams. Study the diagram and answer the following questions.
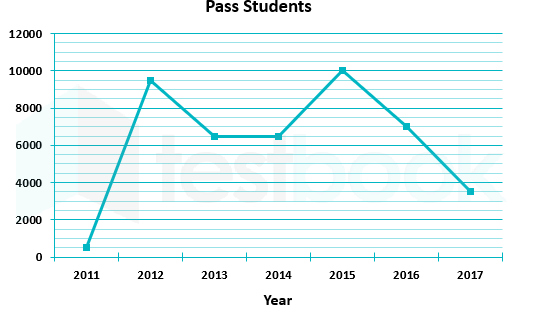
What was the difference in the number of students who passed between the years 2013 and 2016?View SolutionIf
 = 15 students, then
  represents how many students ?View Solution
The diagram represents the number of students studying different subjects. What is the number of students who study History and Biology?
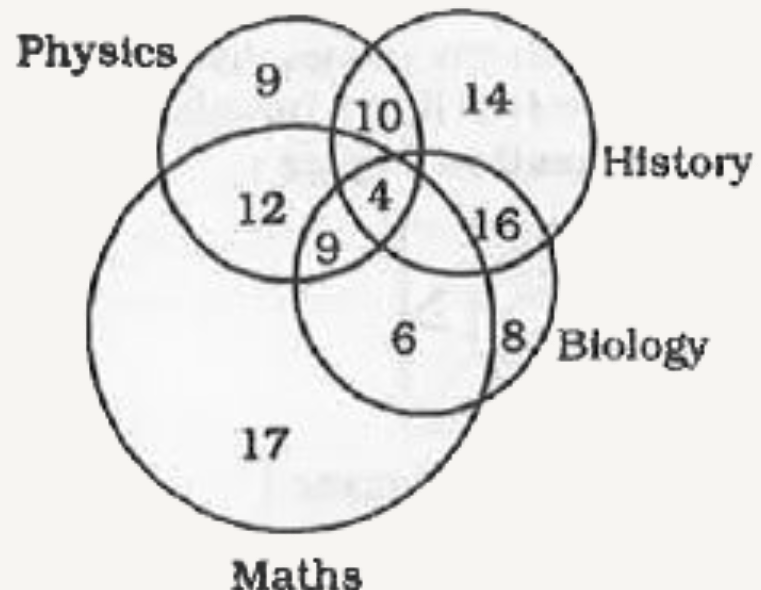 View Solution
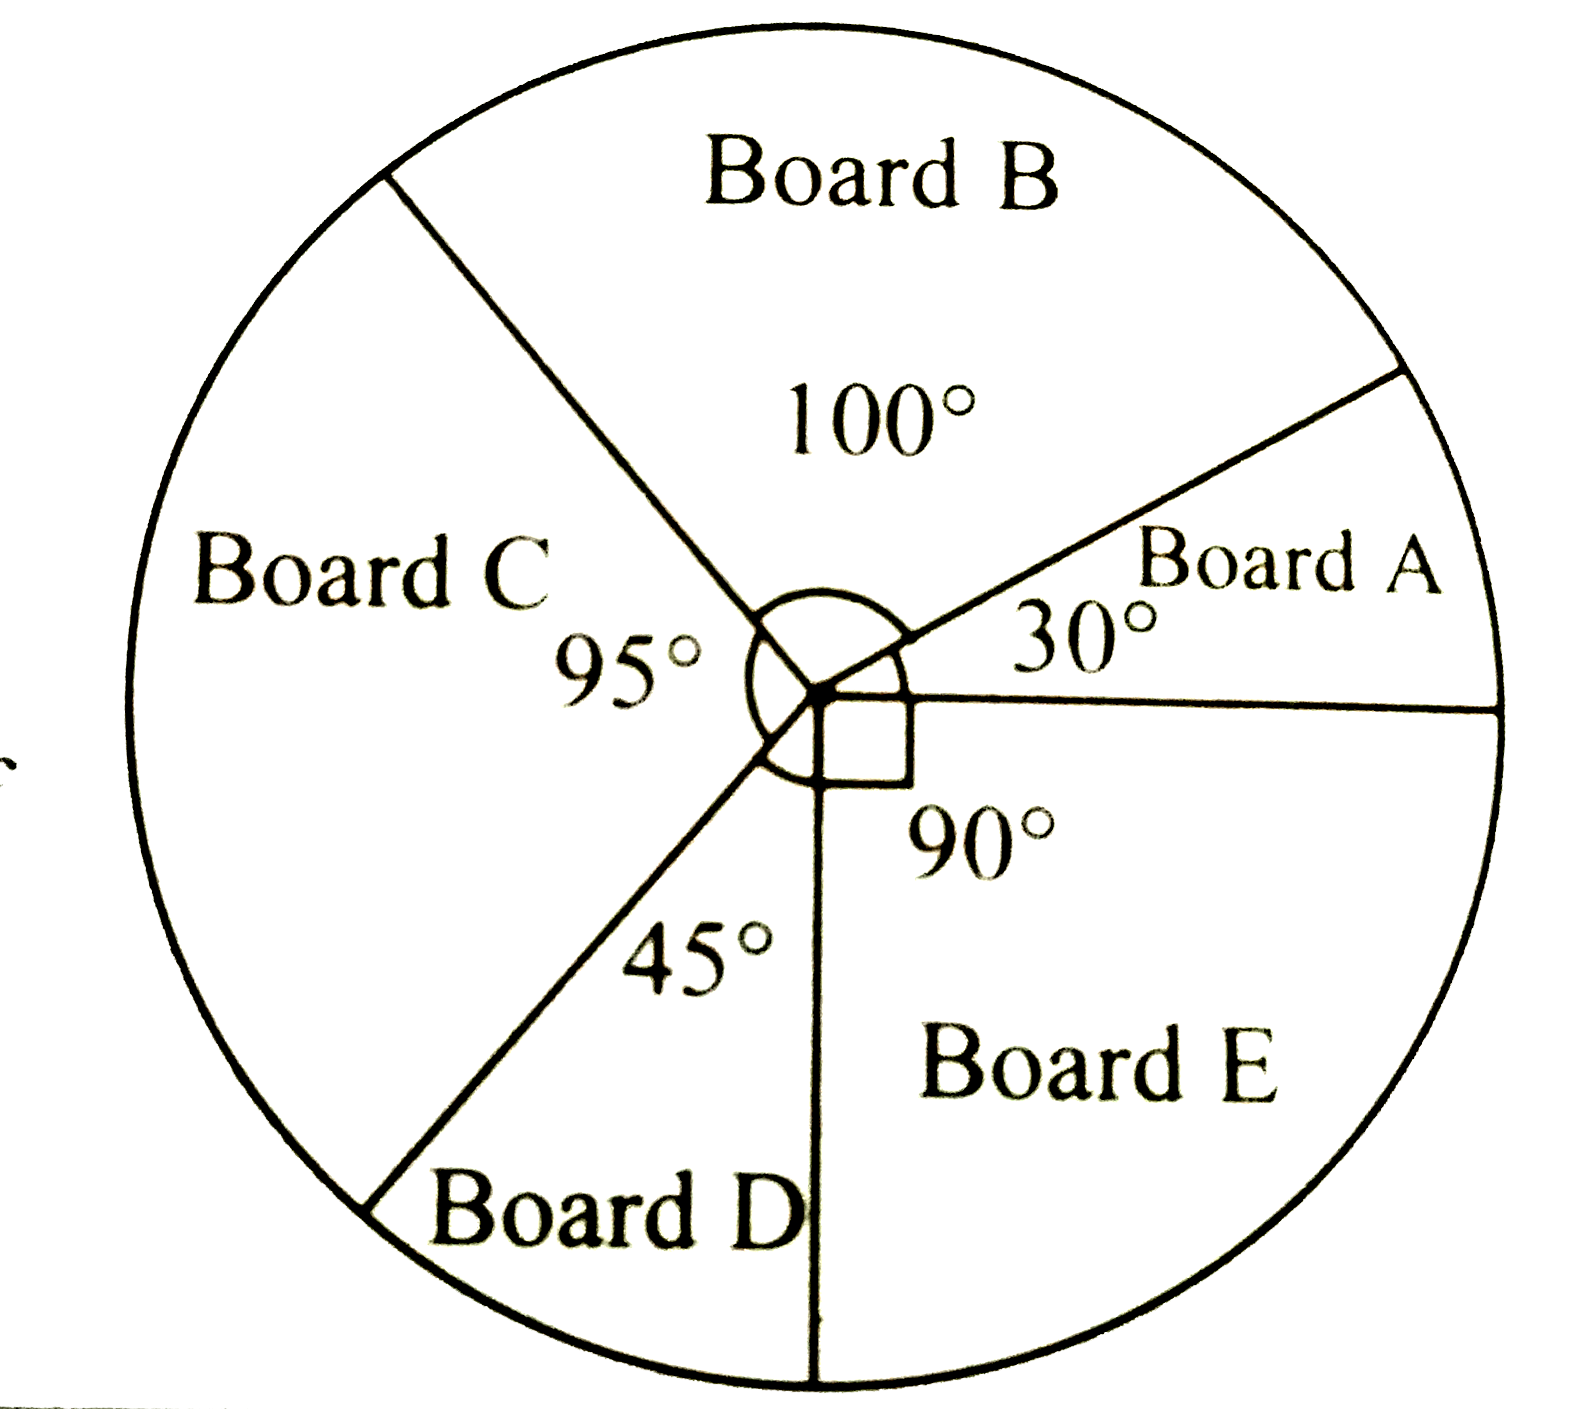
The adjoining pie-diagram shows the S.S.C result of 5 boards. Study the diagram and answer the following questions :
i. How many students have passed in board A if total number of students appeared was 540000?
ii. How many students have passed in board E if the total number of students appeared was 100000 ?
 View Solution
The given bar graph represents the number of students who appeared in the board examination in session 2017-18 and 2018-19. Study the graph and answer the question that follows.
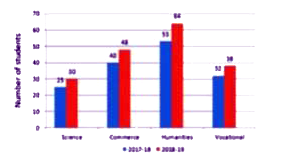
What percentage is the total number of students who appeared in 2017-18 is less than the total number of students who appeared in 2018-19?View Solution

