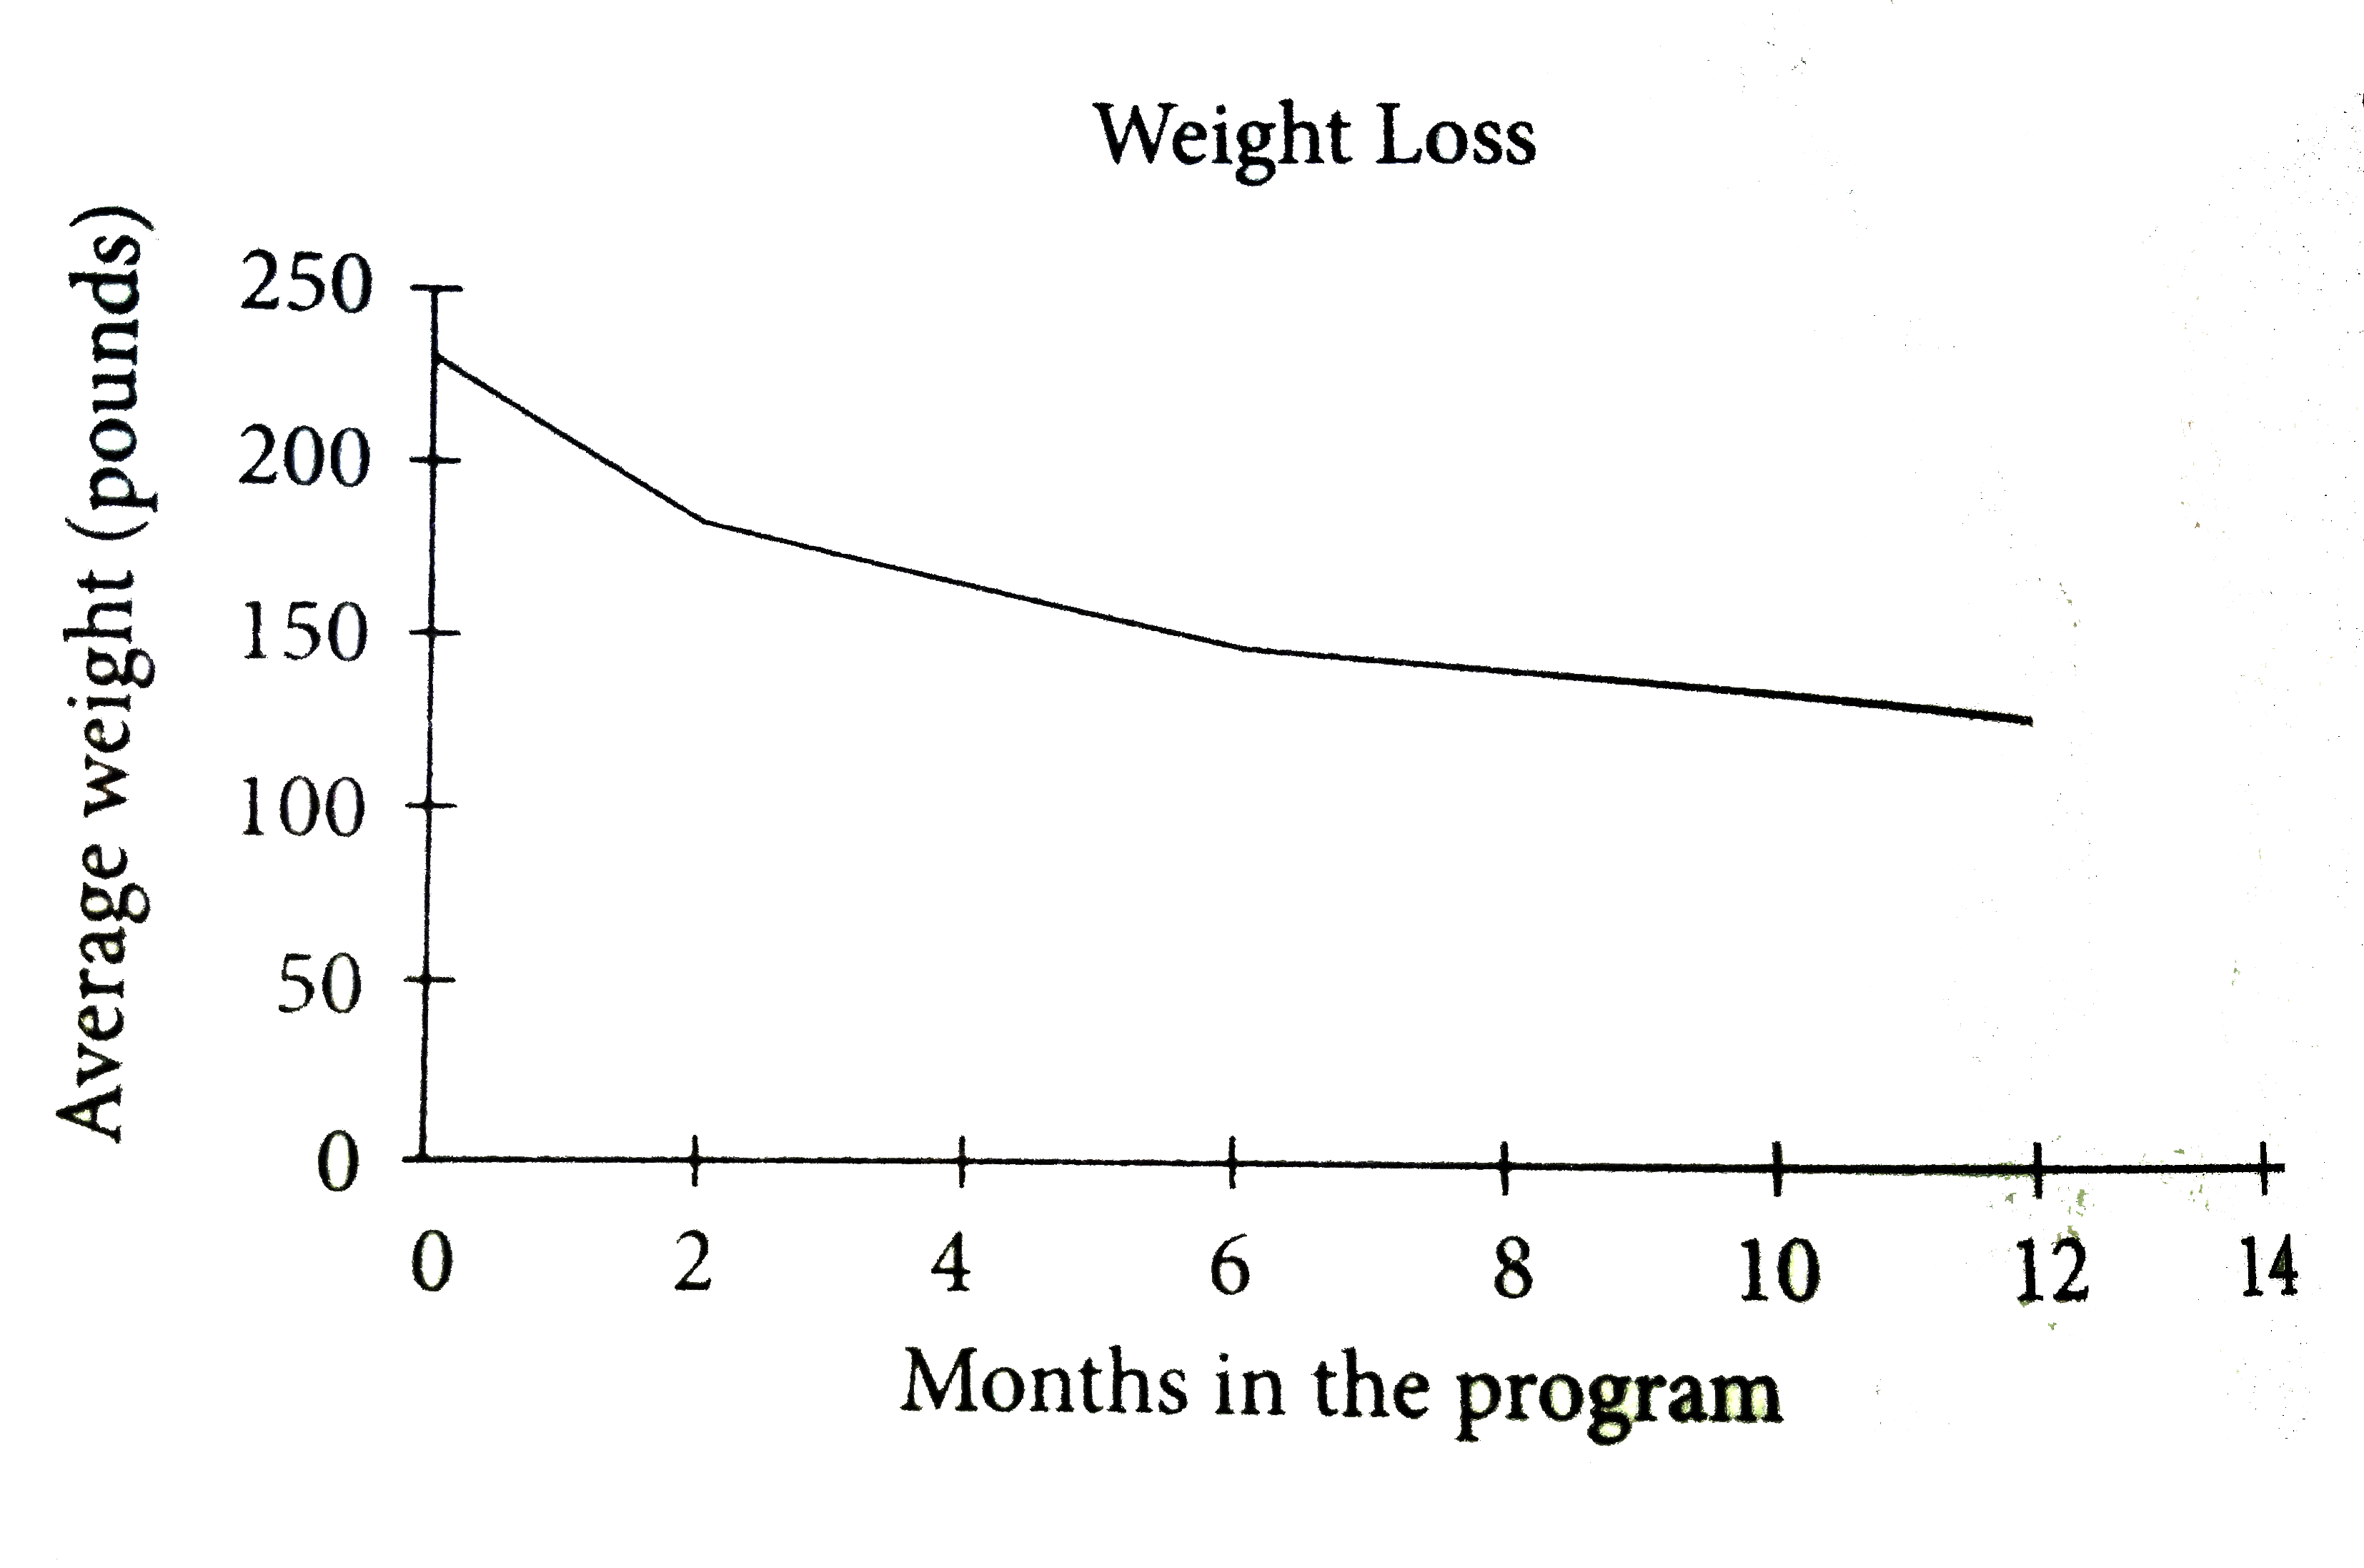
The graph above shows the average weight for the members of a weight loss program,for each month a member is in the program. According to the information in the graph, which of the following must be true?
The average weight loss per month is the same regardless of the number of months a member is in the program.
The average weight loss per month for members who are in the program more than 150 months is less than that for members who are in the program less than 150 months.
The average weight loss per month for members who are in the program more than 6 months is less than that for members who are In the program less than 6 months.
The average weight loss per month for members who are in the program more than 6 months is greater than that for members who are in the program less than 6 months.
The correct Answer is:C
Topper's Solved these Questions
Similar Questions
IF the function g is defined by g(x)=3x+5, what is the value of g(-5)?
View SolutionA certain homeowner uses a gas edger to clean up his lawn every time he mows. If the edger uses 160 milliliters of fuel each time, what is the maximum number of times the homeowner can edge his lawn with 8 litres of fuel?( 1 liter = 1,000 milliliters)
View SolutionThe population ,P, of town Y since 1995 can be estimated by the equation P=1.0635x+3,250, where x is the number of years since 1995 and 0≤x≤20. In the context of this equation, what does the number 1.0635 most likely represent?
View SolutionCalculate the cost of living index for the year 2006 taking 1990 as the base year from the following information using weighted average method.
ltimg src="https://d10lpgp6xz60nq.cloudfront.net/physics_images/PS_MATH_IX_C18_S01_005_Q01.png" width="80%"gt
View SolutionHow many lines of symmetry does the above figure have ?
View SolutionWhich of the following are correct chain isomers of butane ? (i)
View SolutionDetermine the point of symmetry of a regular hexagon.
View SolutionDtermine the images of the following figure about the given line :
View SolutionMatch the following Column A to Column B

View SolutionMatch the following Column A to Column B

View SolutionMatch the following Column A to Column B

View SolutionThe inequation represented by the graph given below is :
View SolutionThe inequation that best describes the graph given below is _________
View SolutionThe inequation that best describes the following graph is _________
View SolutionWhich inequations represent the shaded region in the given figure
View Solution
