The graph of a function is shown in the following figure.
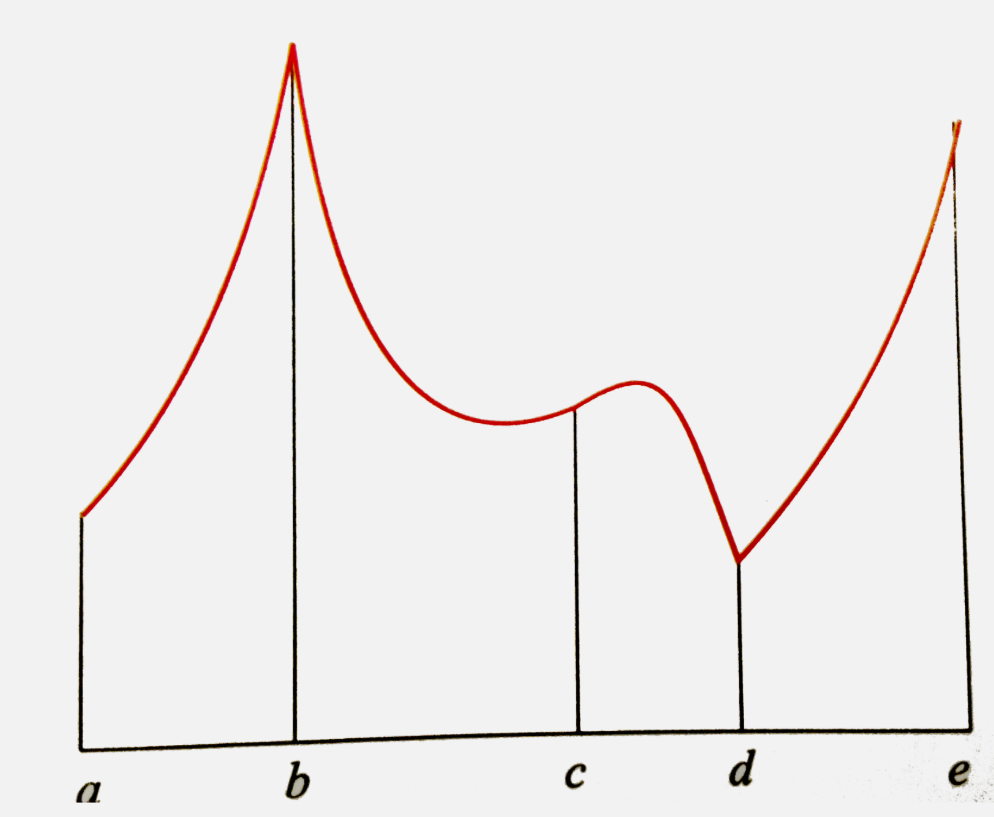
Determine the intervals on which the function is concave up and the intervals on which it is concave down. Find the x - coordinates of any inflection points.Solution in Bengali
The graph is concave up on a<x<b,b<x<candd<x<e. The graph is concave down on c<x<d.
Note that concavity is a property of a graph on an open interval, so the endpoints are not included.
There are inflection points at x = c and x = d.
Topper's Solved these Questions
- GETTING STARTED WITH GRAPHSBOOK - CENGAGE PUBLICATIONCHAPTER - GETTING STARTED WITH GRAPHSEXERCISE - ILLUSTRATION 1.20
1 Videos
- GETTING STARTED WITH GRAPHSBOOK - CENGAGE PUBLICATIONCHAPTER - GETTING STARTED WITH GRAPHSEXERCISE - ILLUSTRATION 1.21
1 Videos
- GETTING STARTED WITH GRAPHSBOOK - CENGAGE PUBLICATIONCHAPTER - GETTING STARTED WITH GRAPHSEXERCISE - ILLUSTRATION 1.18
1 Videos
- FUNCTIONSBOOK - CENGAGE PUBLICATIONCHAPTER - FUNCTIONSEXERCISE - Comprehension Type
7 Videos
- GRAPH OF INVERSE TRIGONOMETRIC FUNCTIONSBOOK - CENGAGE PUBLICATIONCHAPTER - GRAPH OF INVERSE TRIGONOMETRIC FUNCTIONSEXERCISE - Exercises
18 Videos
Similar Questions
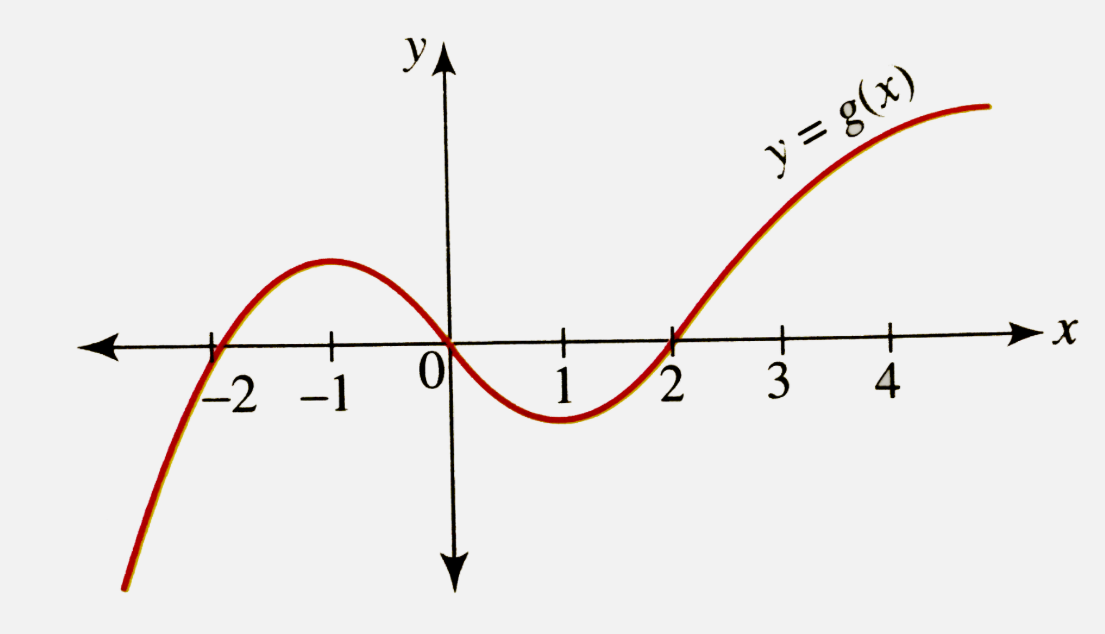
For the function g whose graph is given. Arrange the following numbers in increasing order and explain your reasoning.
g(0),g'(−2),g'(0),g'(2),g'(4)
View SolutionThe diagram shows the graph of the derivative of a function f(x) for 0≤x≤4 with f(0) = 0. Which of the following could be correct statements for y = f(x)?
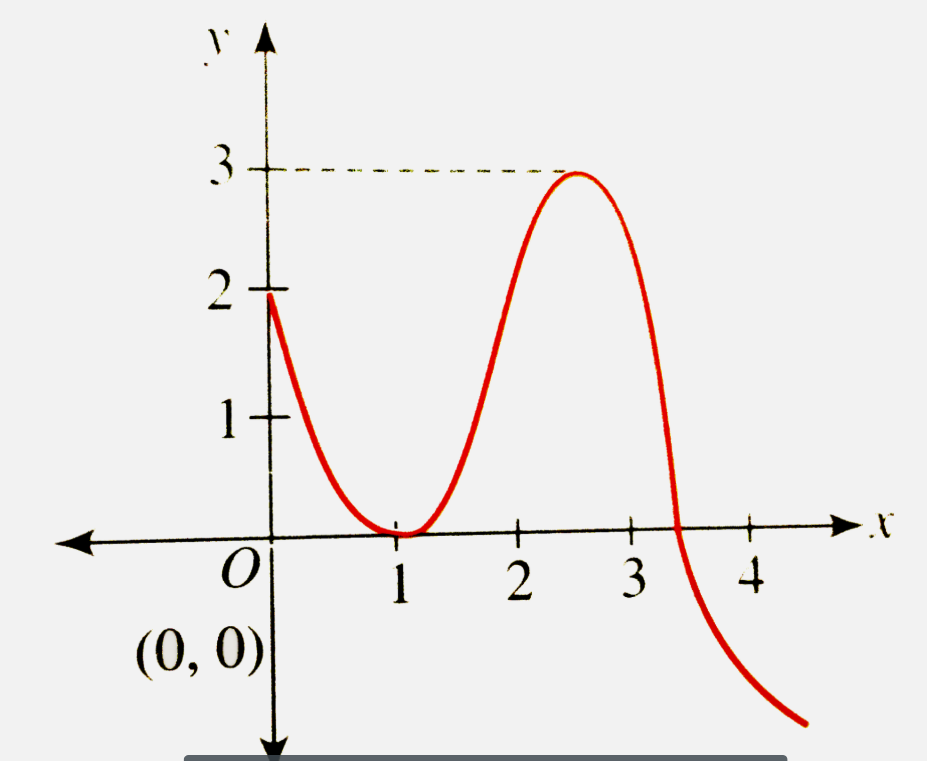
(a) Tangent line to y = f(x) at x = 0 makes an angle of sec−1√5 with the x - axis.
(b) f is increasing in (0, 3).
(c) x = 1 is both an inflection point and the point of local extremum.
(d) Number of critical point on y = f(x) is two.
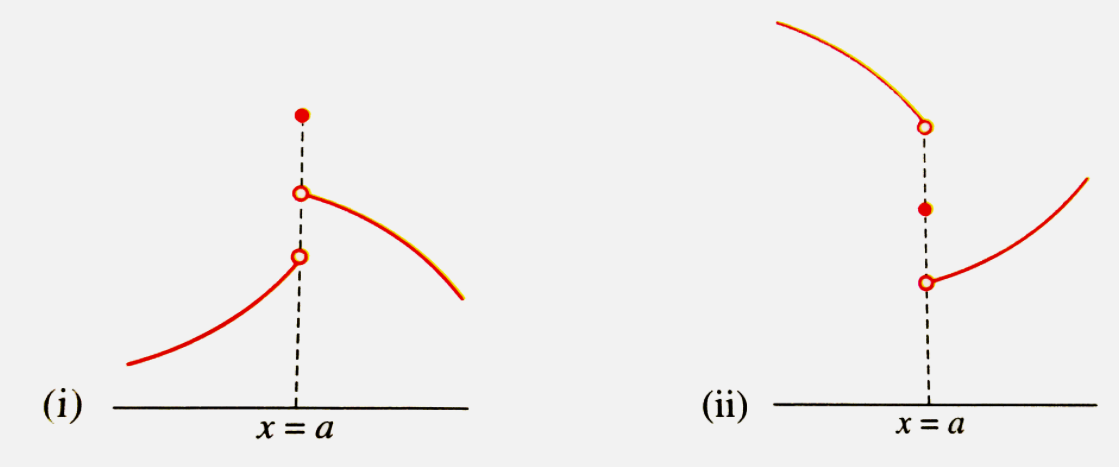
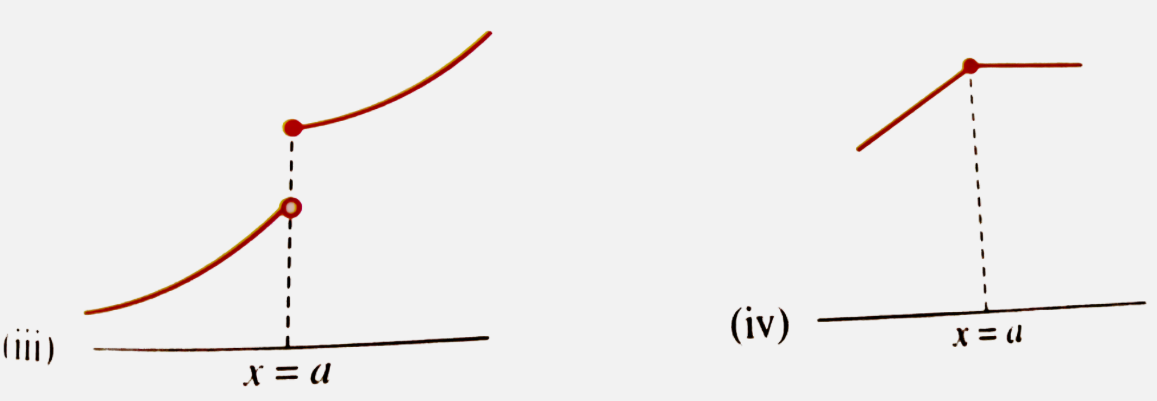
View SolutionFor each of the following graphs, comment whether f(x) is increasing or decreasing or neither increasing nor decreasing at x = a.
View SolutionLet f(x)=x2−2x−1∀x∈R.Letf:(−∞,a]→[b,∞), where a is the largest real number for which f(x) is bijective.
If f:R→R, then range of values of k for which equation f(|x|)=k has 4 distinct real roots is
View SolutionDraw the graph of y=tan−1x−cot−1x.
View SolutionThe graph of a function is shown in the following figure.

Determine the intervals on which the function is concave up and the intervals on which it is concave down. Find the x - coordinates of any inflection points.
View SolutionWhich of the following are correct chain isomers of butane ? (i)
View SolutionDetermine the point of symmetry of a regular hexagon.
View SolutionDtermine the images of the following figure about the given line :
View SolutionMatch the following Column A to Column B

View SolutionMatch the following Column A to Column B

View SolutionMatch the following Column A to Column B

View SolutionThe inequation represented by the graph given below is :
View SolutionThe inequation that best describes the graph given below is _________
View SolutionThe inequation that best describes the following graph is _________
View SolutionWhich inequations represent the shaded region in the given figure
View Solution
