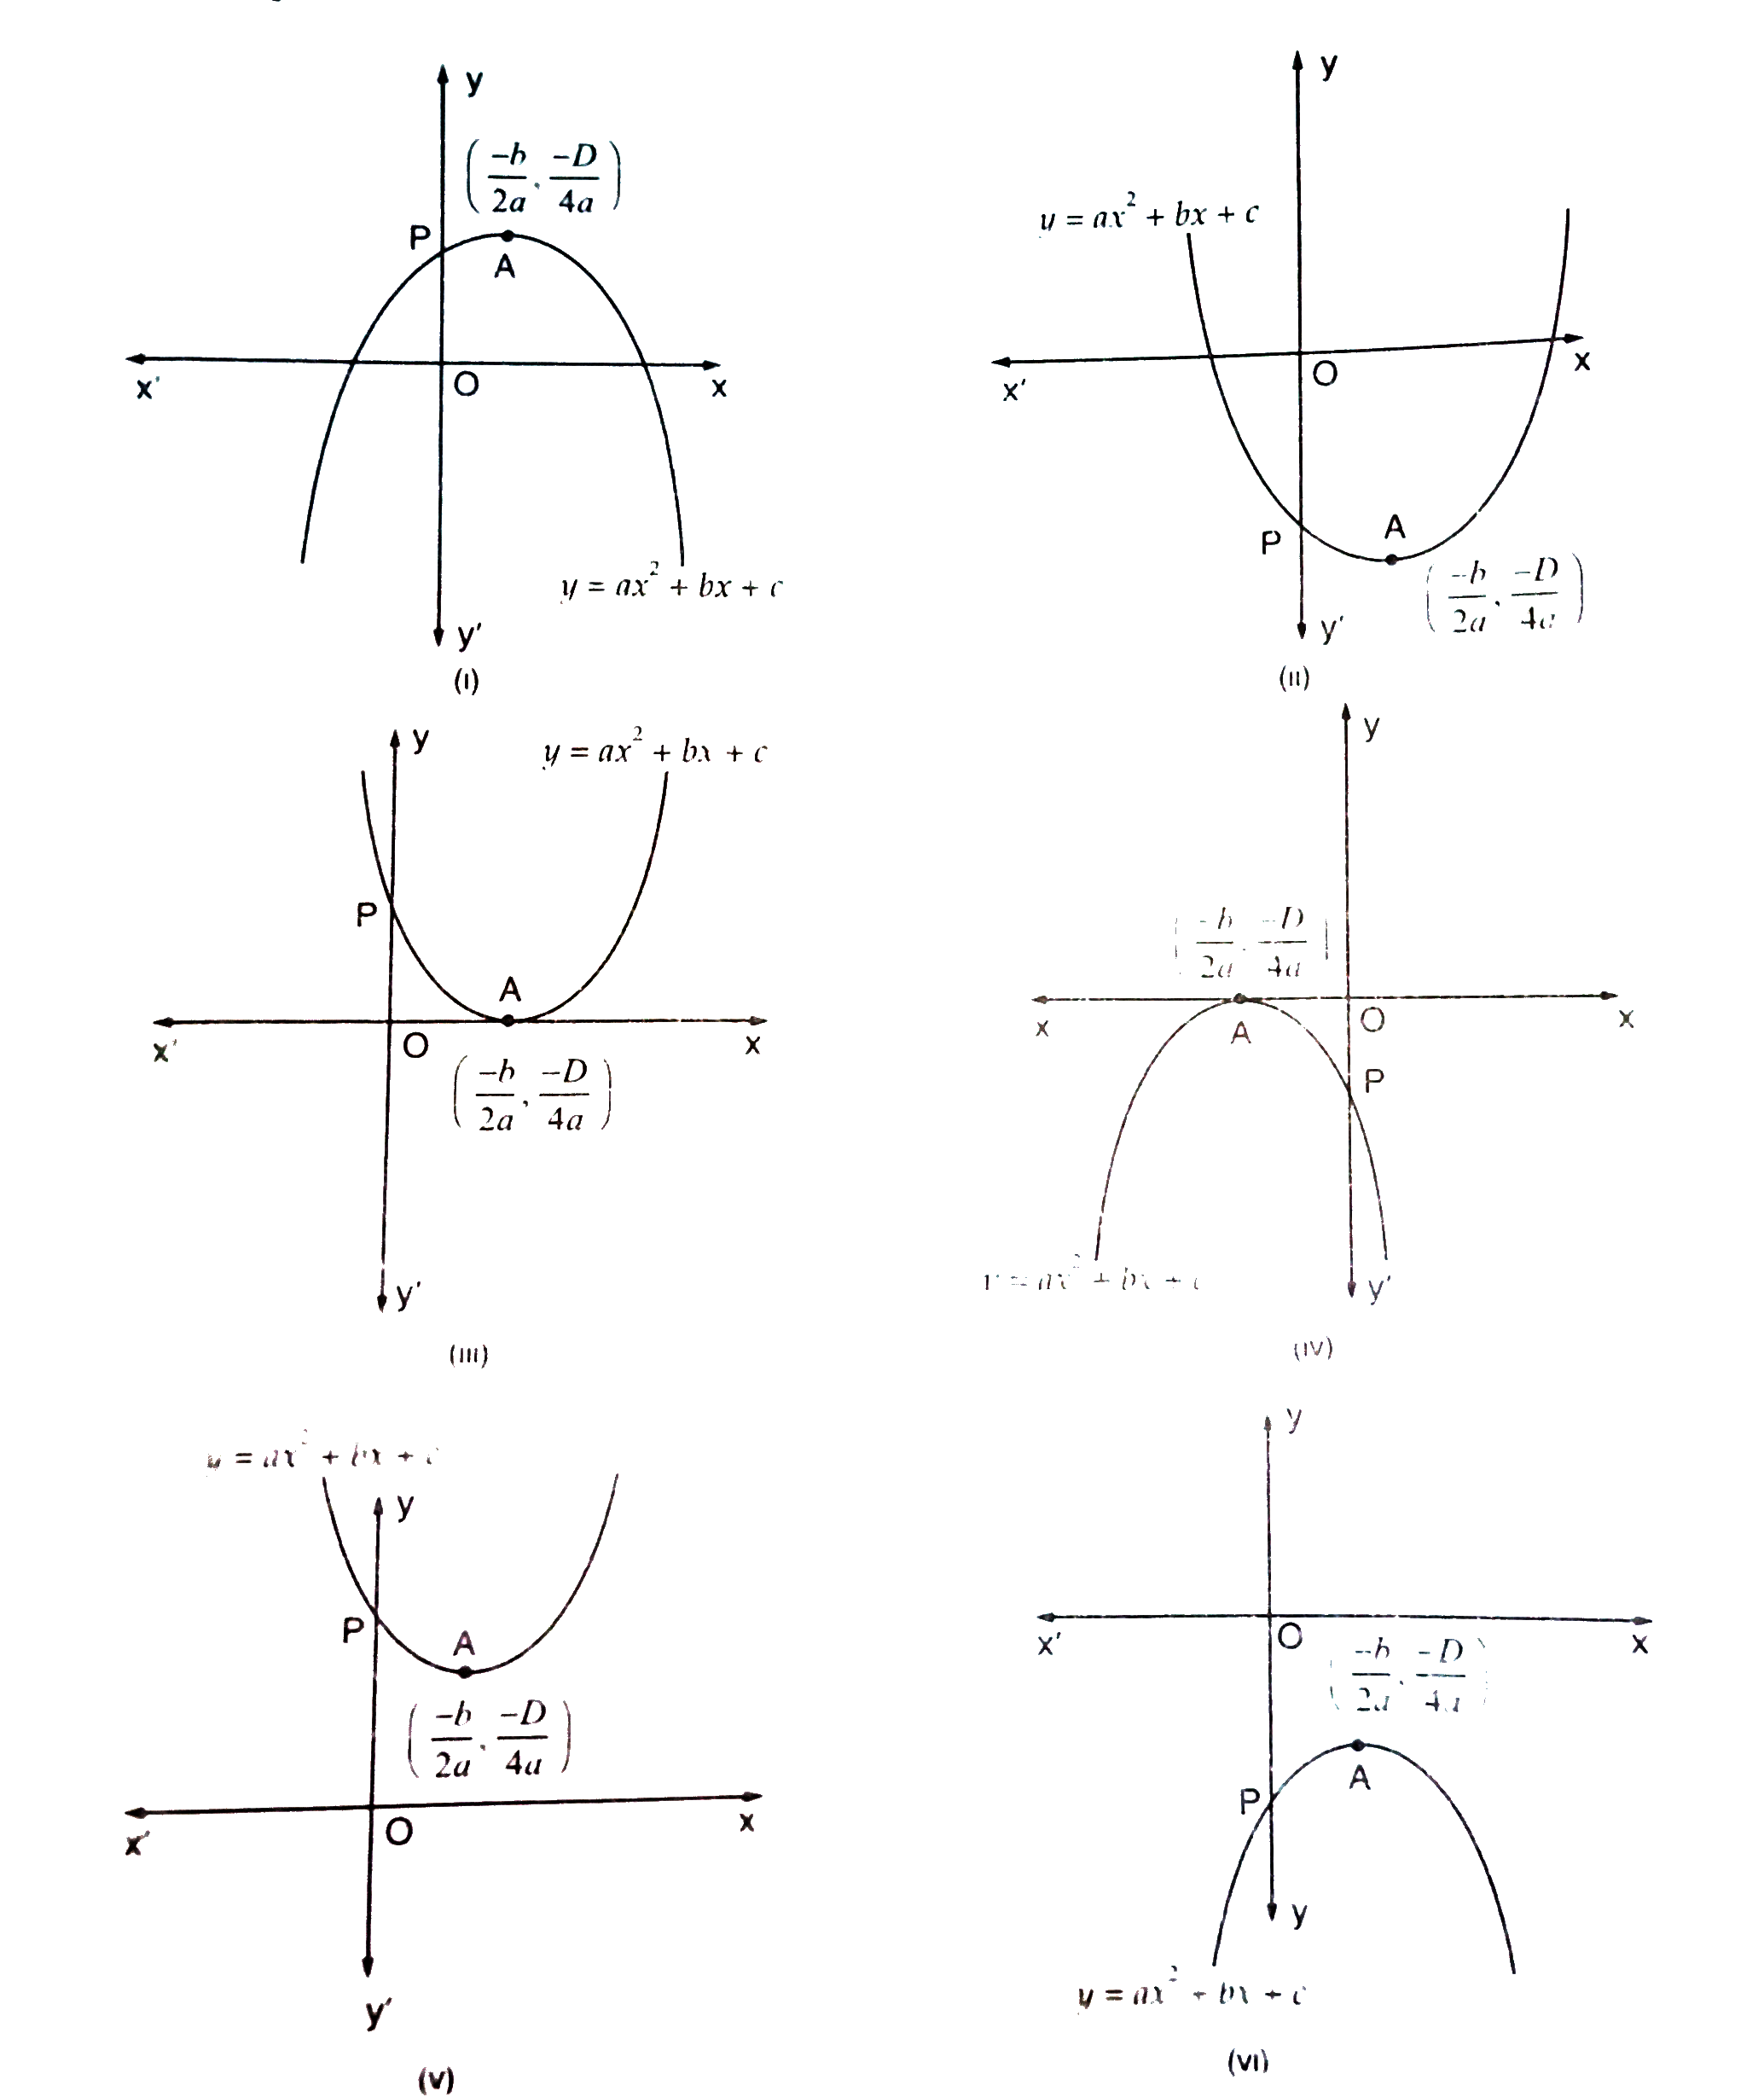
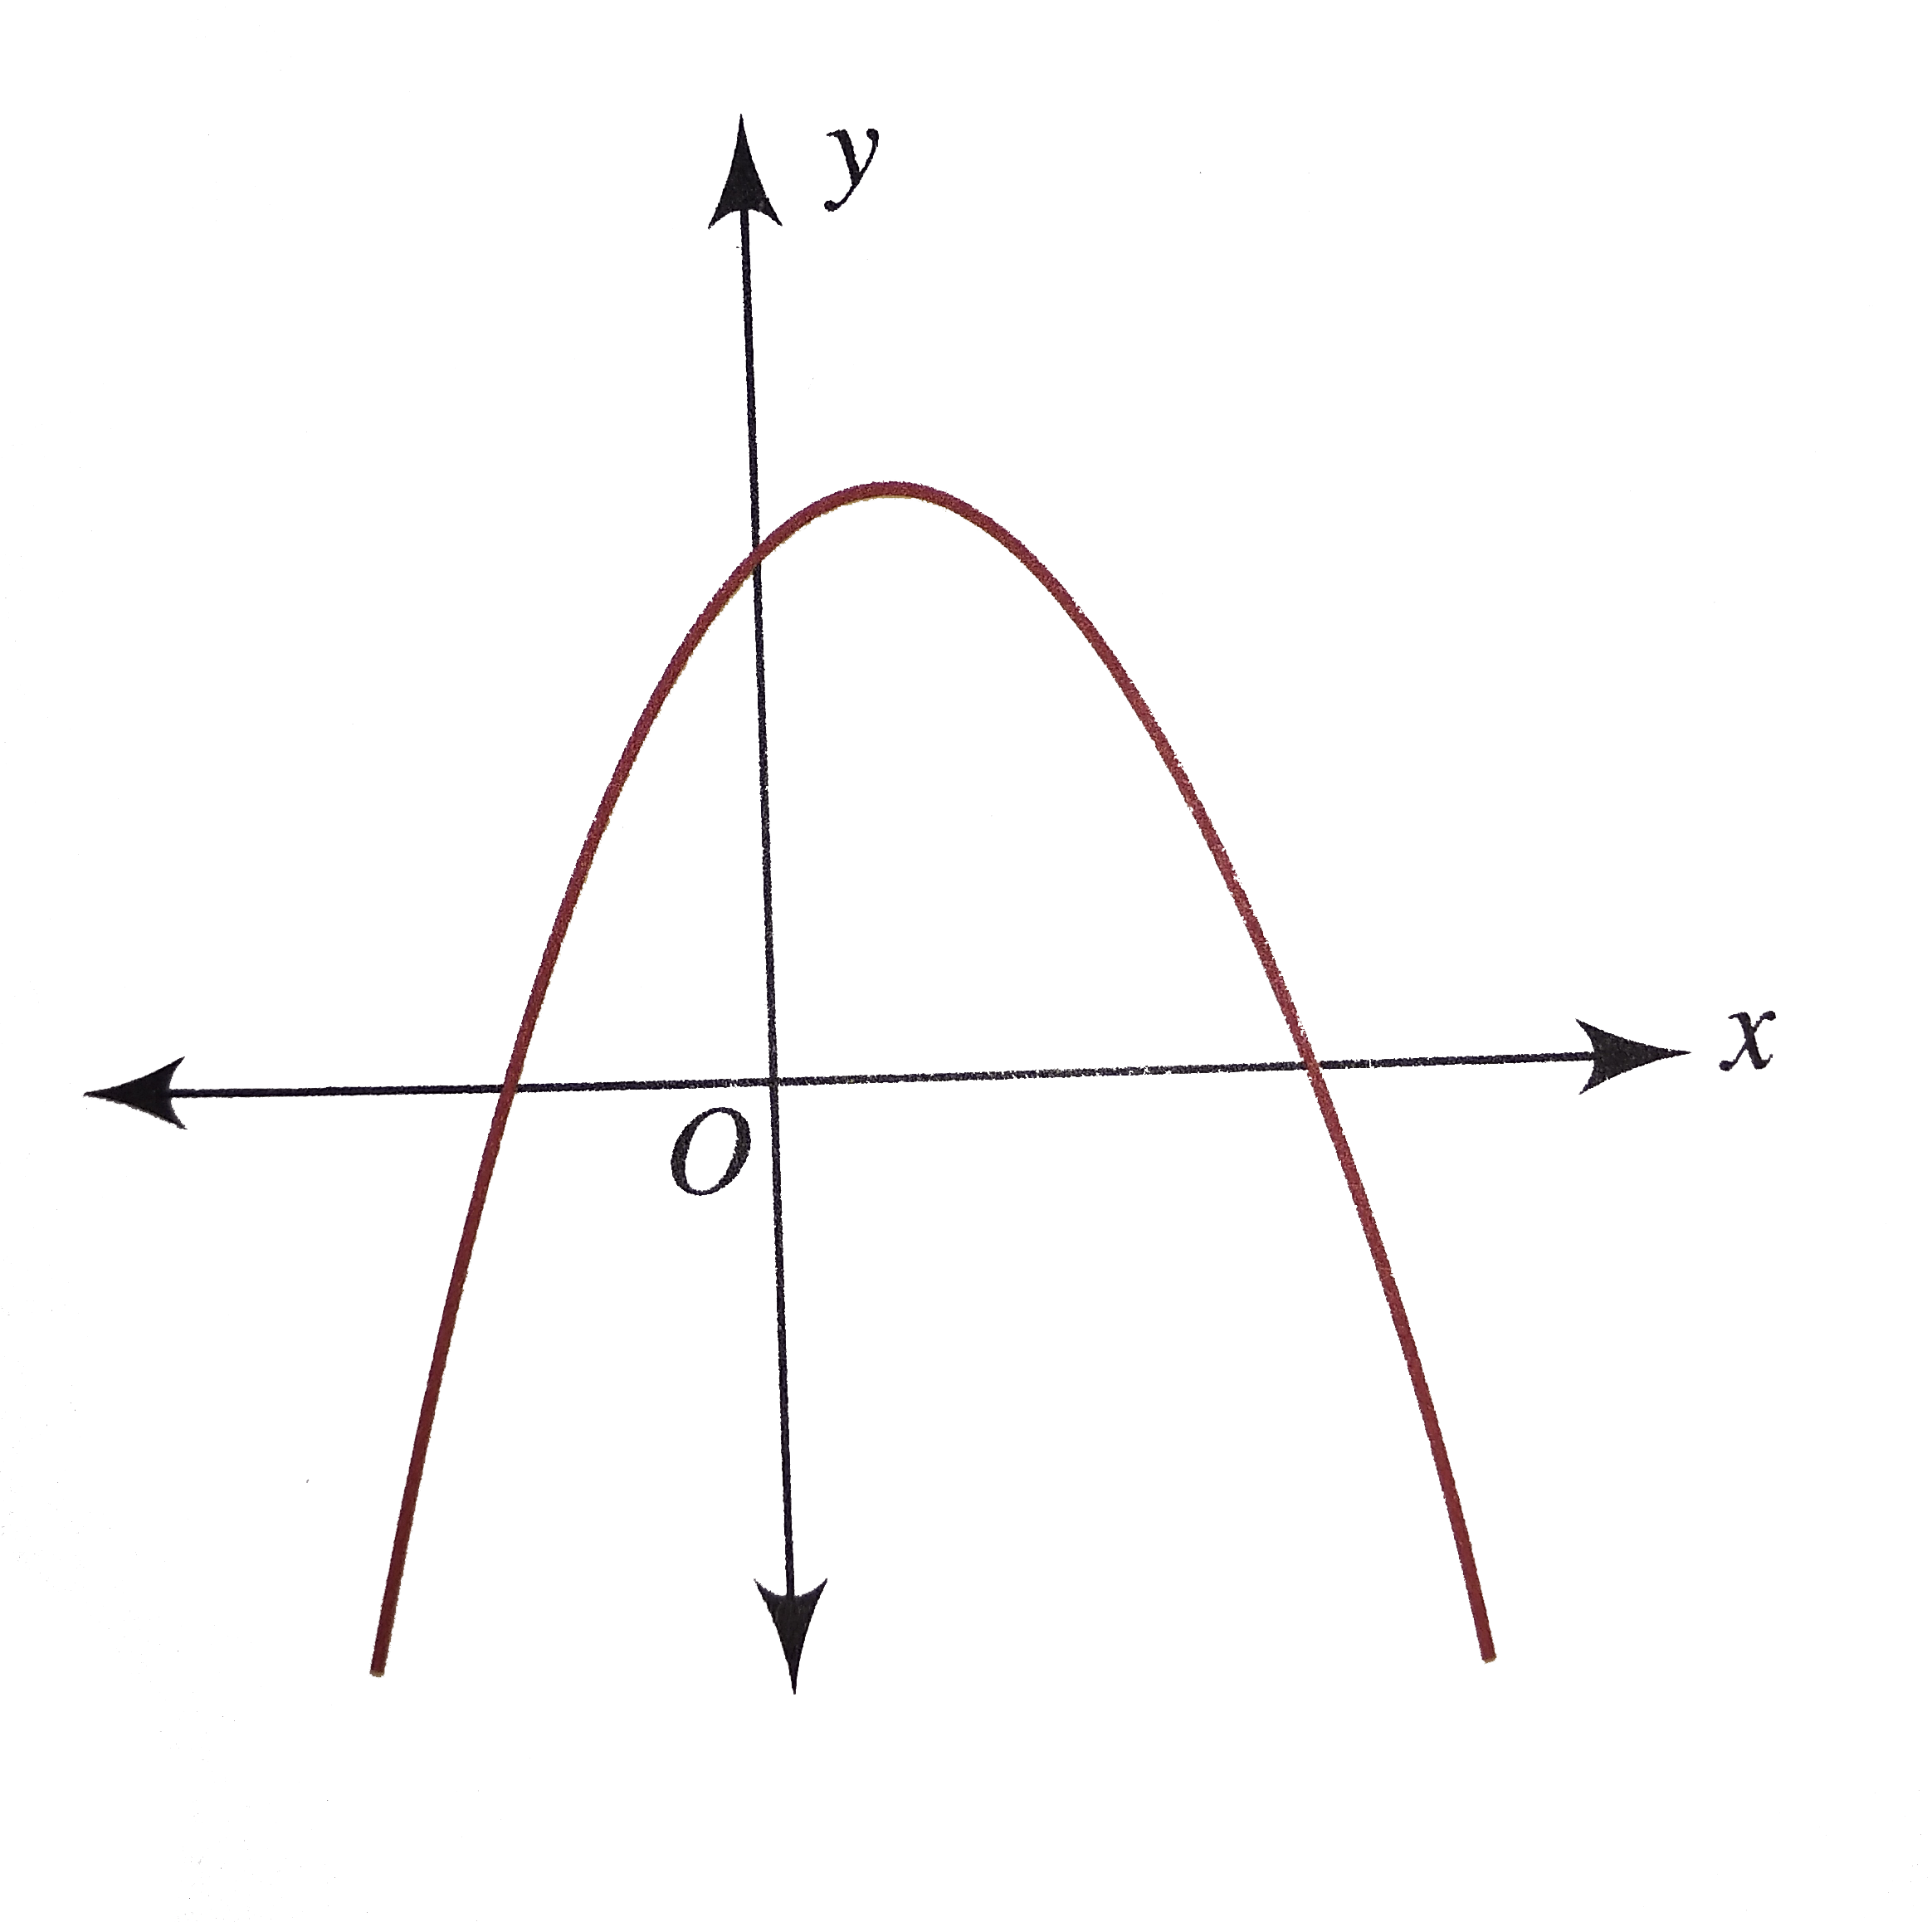
The graph of y=ax2+bx+c is given . Identify the signs of a, b and c.
A
a>0,b<0andc<0
B
a>0,b>0andc<0
C
a<0,b<0andc>0
D
a>0,b<0andc>0
Video Solution
Text Solution
The correct Answer is:D
|
Answer
Step by step video & image solution for The graph of y = ax^(2) + bx + c is given . Identify the signs of a, b and c. by Maths experts to help you in doubts & scoring excellent marks in Class 10 exams.
Updated on:21/07/2023Topper's Solved these Questions
- IMO QUESTION PAPER 2017 SET-BBOOK - SCIENCE OLYMPIAD FOUNDATION CHAPTER - IMO QUESTION PAPER 2017 SET-BEXERCISE - Logical Reasoning
5 Videos
- IMO QUESTION PAPER 2017 SET-BBOOK - SCIENCE OLYMPIAD FOUNDATION CHAPTER - IMO QUESTION PAPER 2017 SET-BEXERCISE - Everyday Mathematics
10 Videos
- IMO QUESTION PAPER 2017 SET ABOOK - SCIENCE OLYMPIAD FOUNDATION CHAPTER - IMO QUESTION PAPER 2017 SET AEXERCISE - Achievers Section
5 Videos
- IMO QUESTION PAPER 2018 SET ABOOK - SCIENCE OLYMPIAD FOUNDATION CHAPTER - IMO QUESTION PAPER 2018 SET AEXERCISE - Achievers section
5 Videos
Similar Questions
Knowledge Check
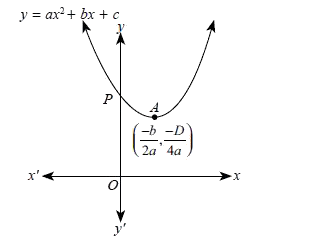
If fig. 3.21 graph of y=ax2+2bx+c is given Which one of the following is not true ?
 Aa>0Bb>0Cc>0Db2<ac
If graph of the quadratic y=ax2+bx+c is given below :
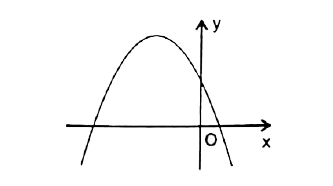 then: Aa<0,b>0,c>0Ba<0,b>0,c<0Ca<0,b<0,c>0Da<0,b<0,c<0
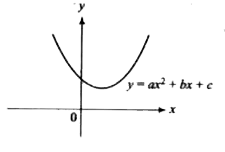
Shows graph of y=ax2+bx+c . Then which one of the following is not true.
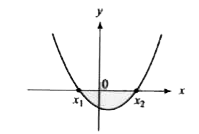 Aa>0Bc<0Cb2−4ac>0Db>0
The following figure shows the graph of f(x)=ax2+bx+c, then find the sign of values of a,bandc.
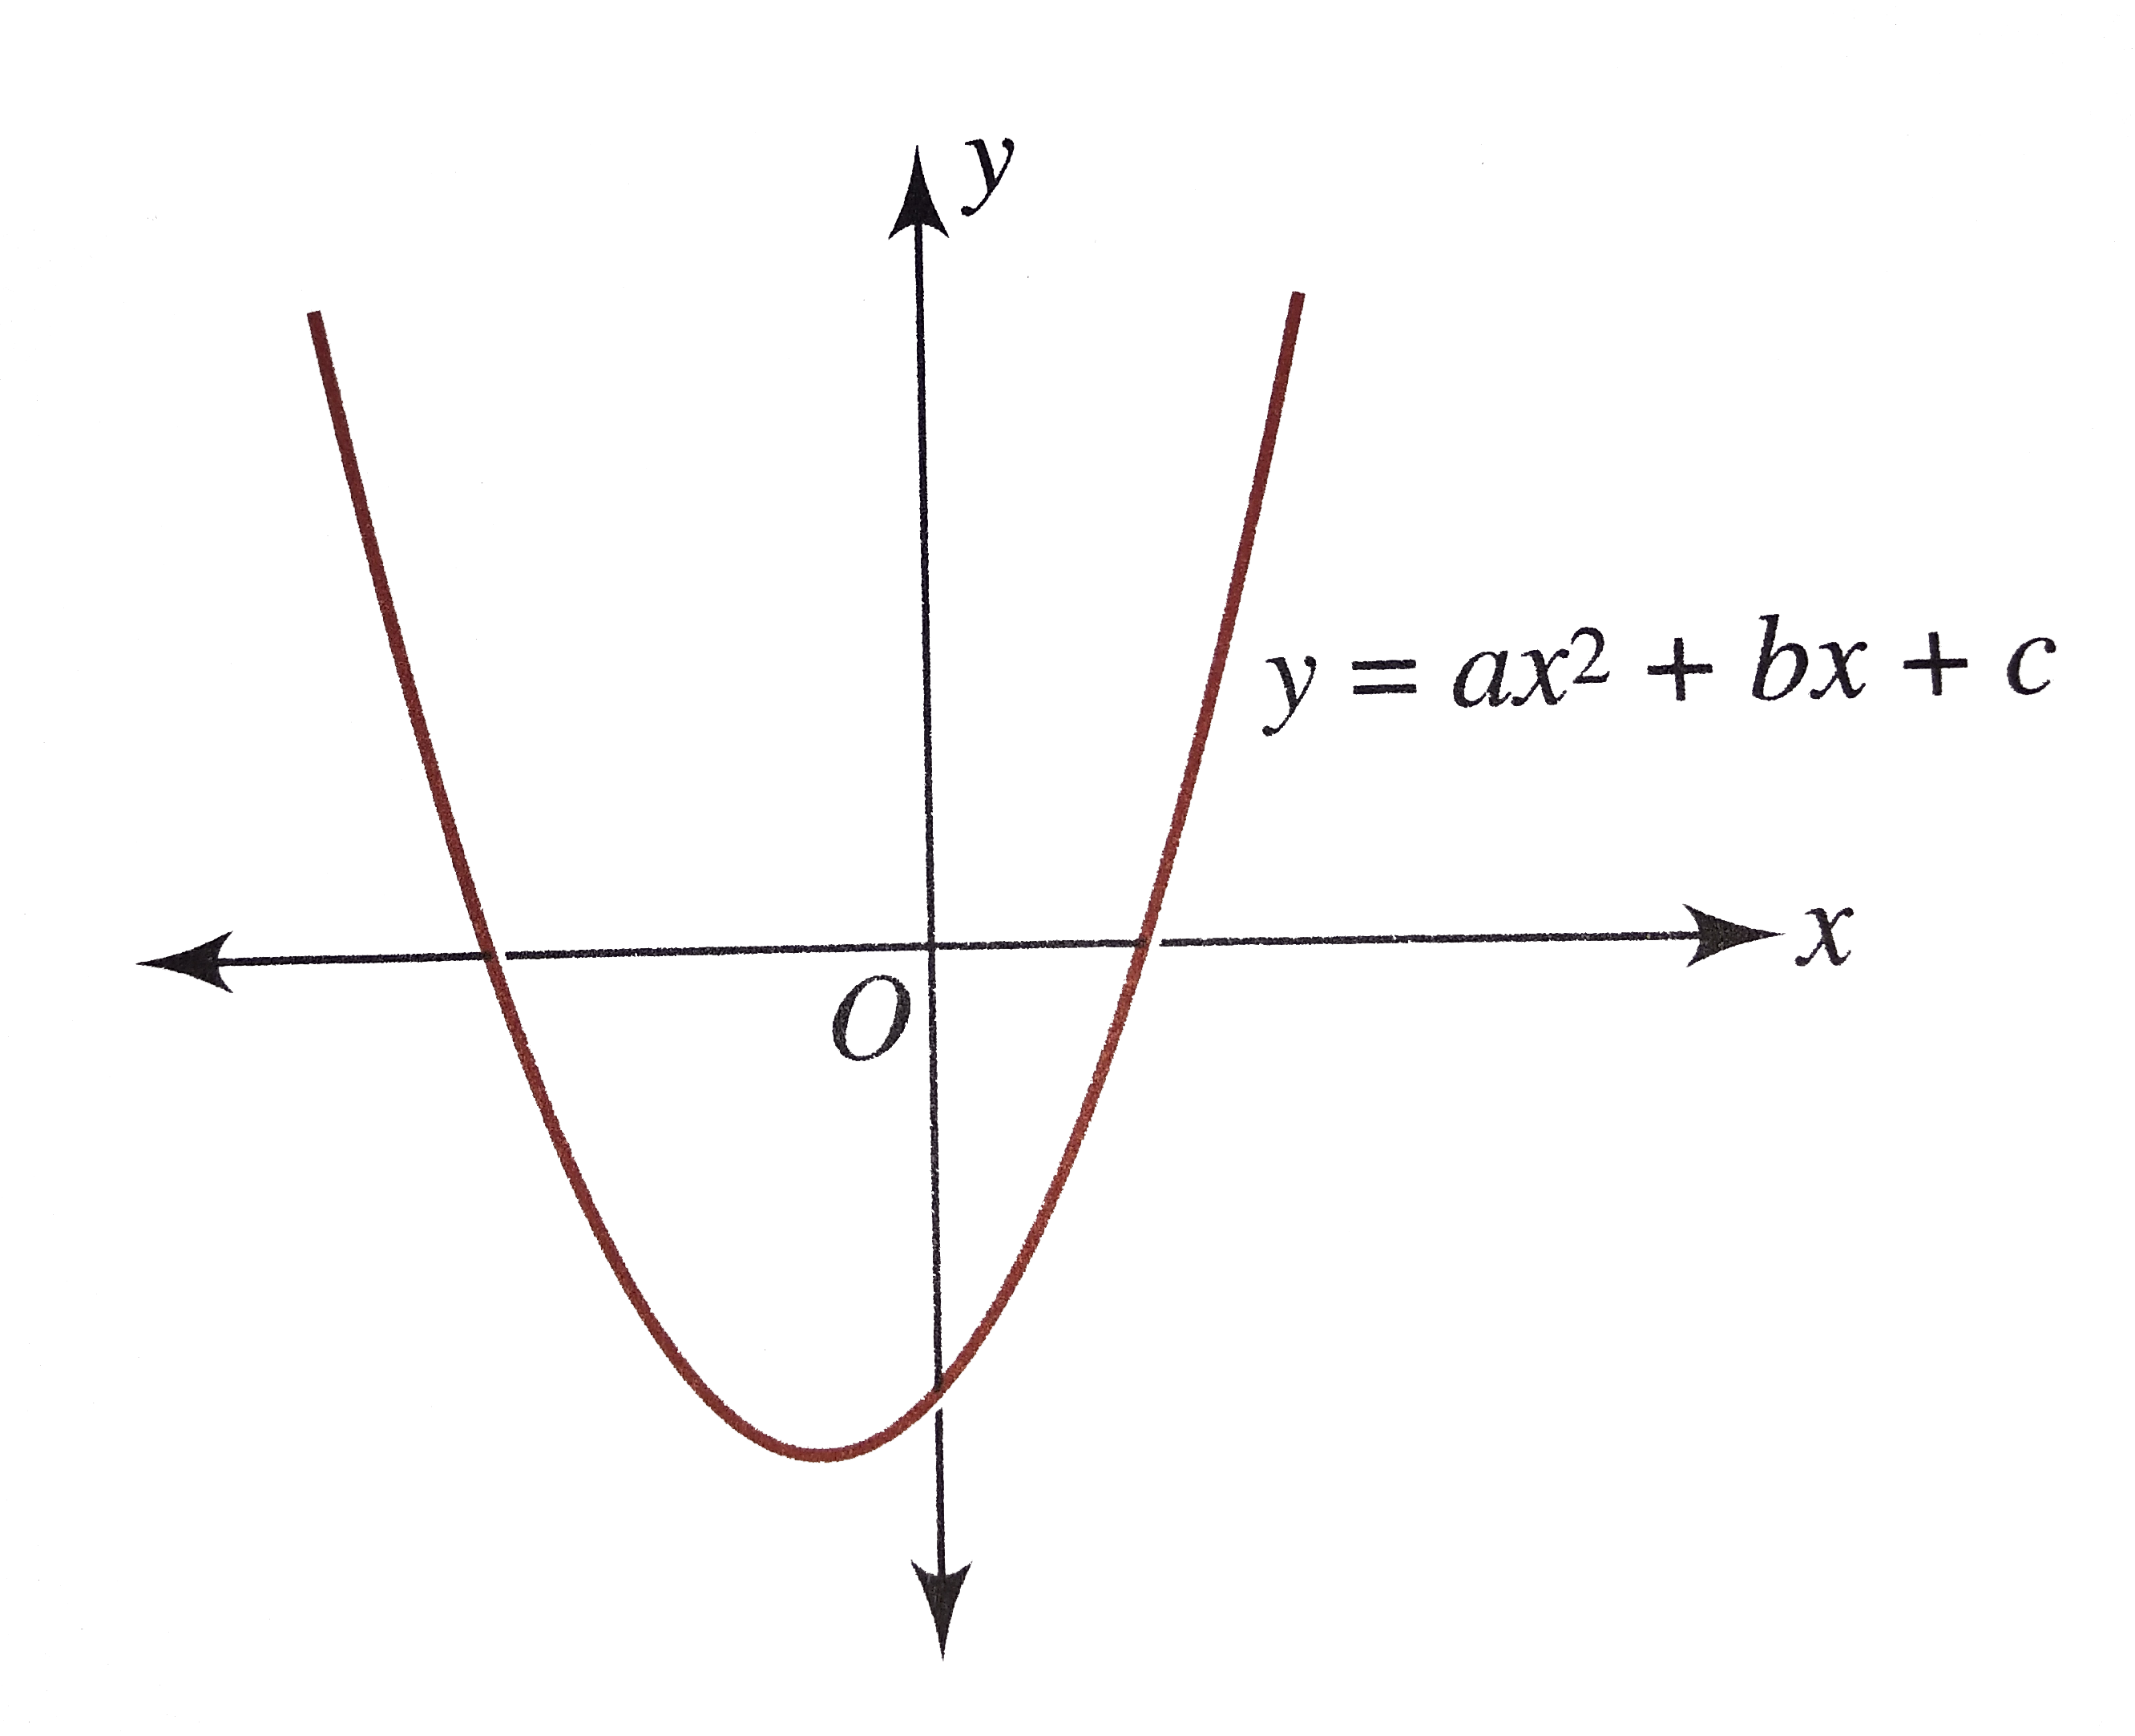
View SolutionIf graph of the quadratic y=ax2+bx+c is given below :
 then:
then:
View SolutionThe adjoining graph of y=ax2+bx+c shows that
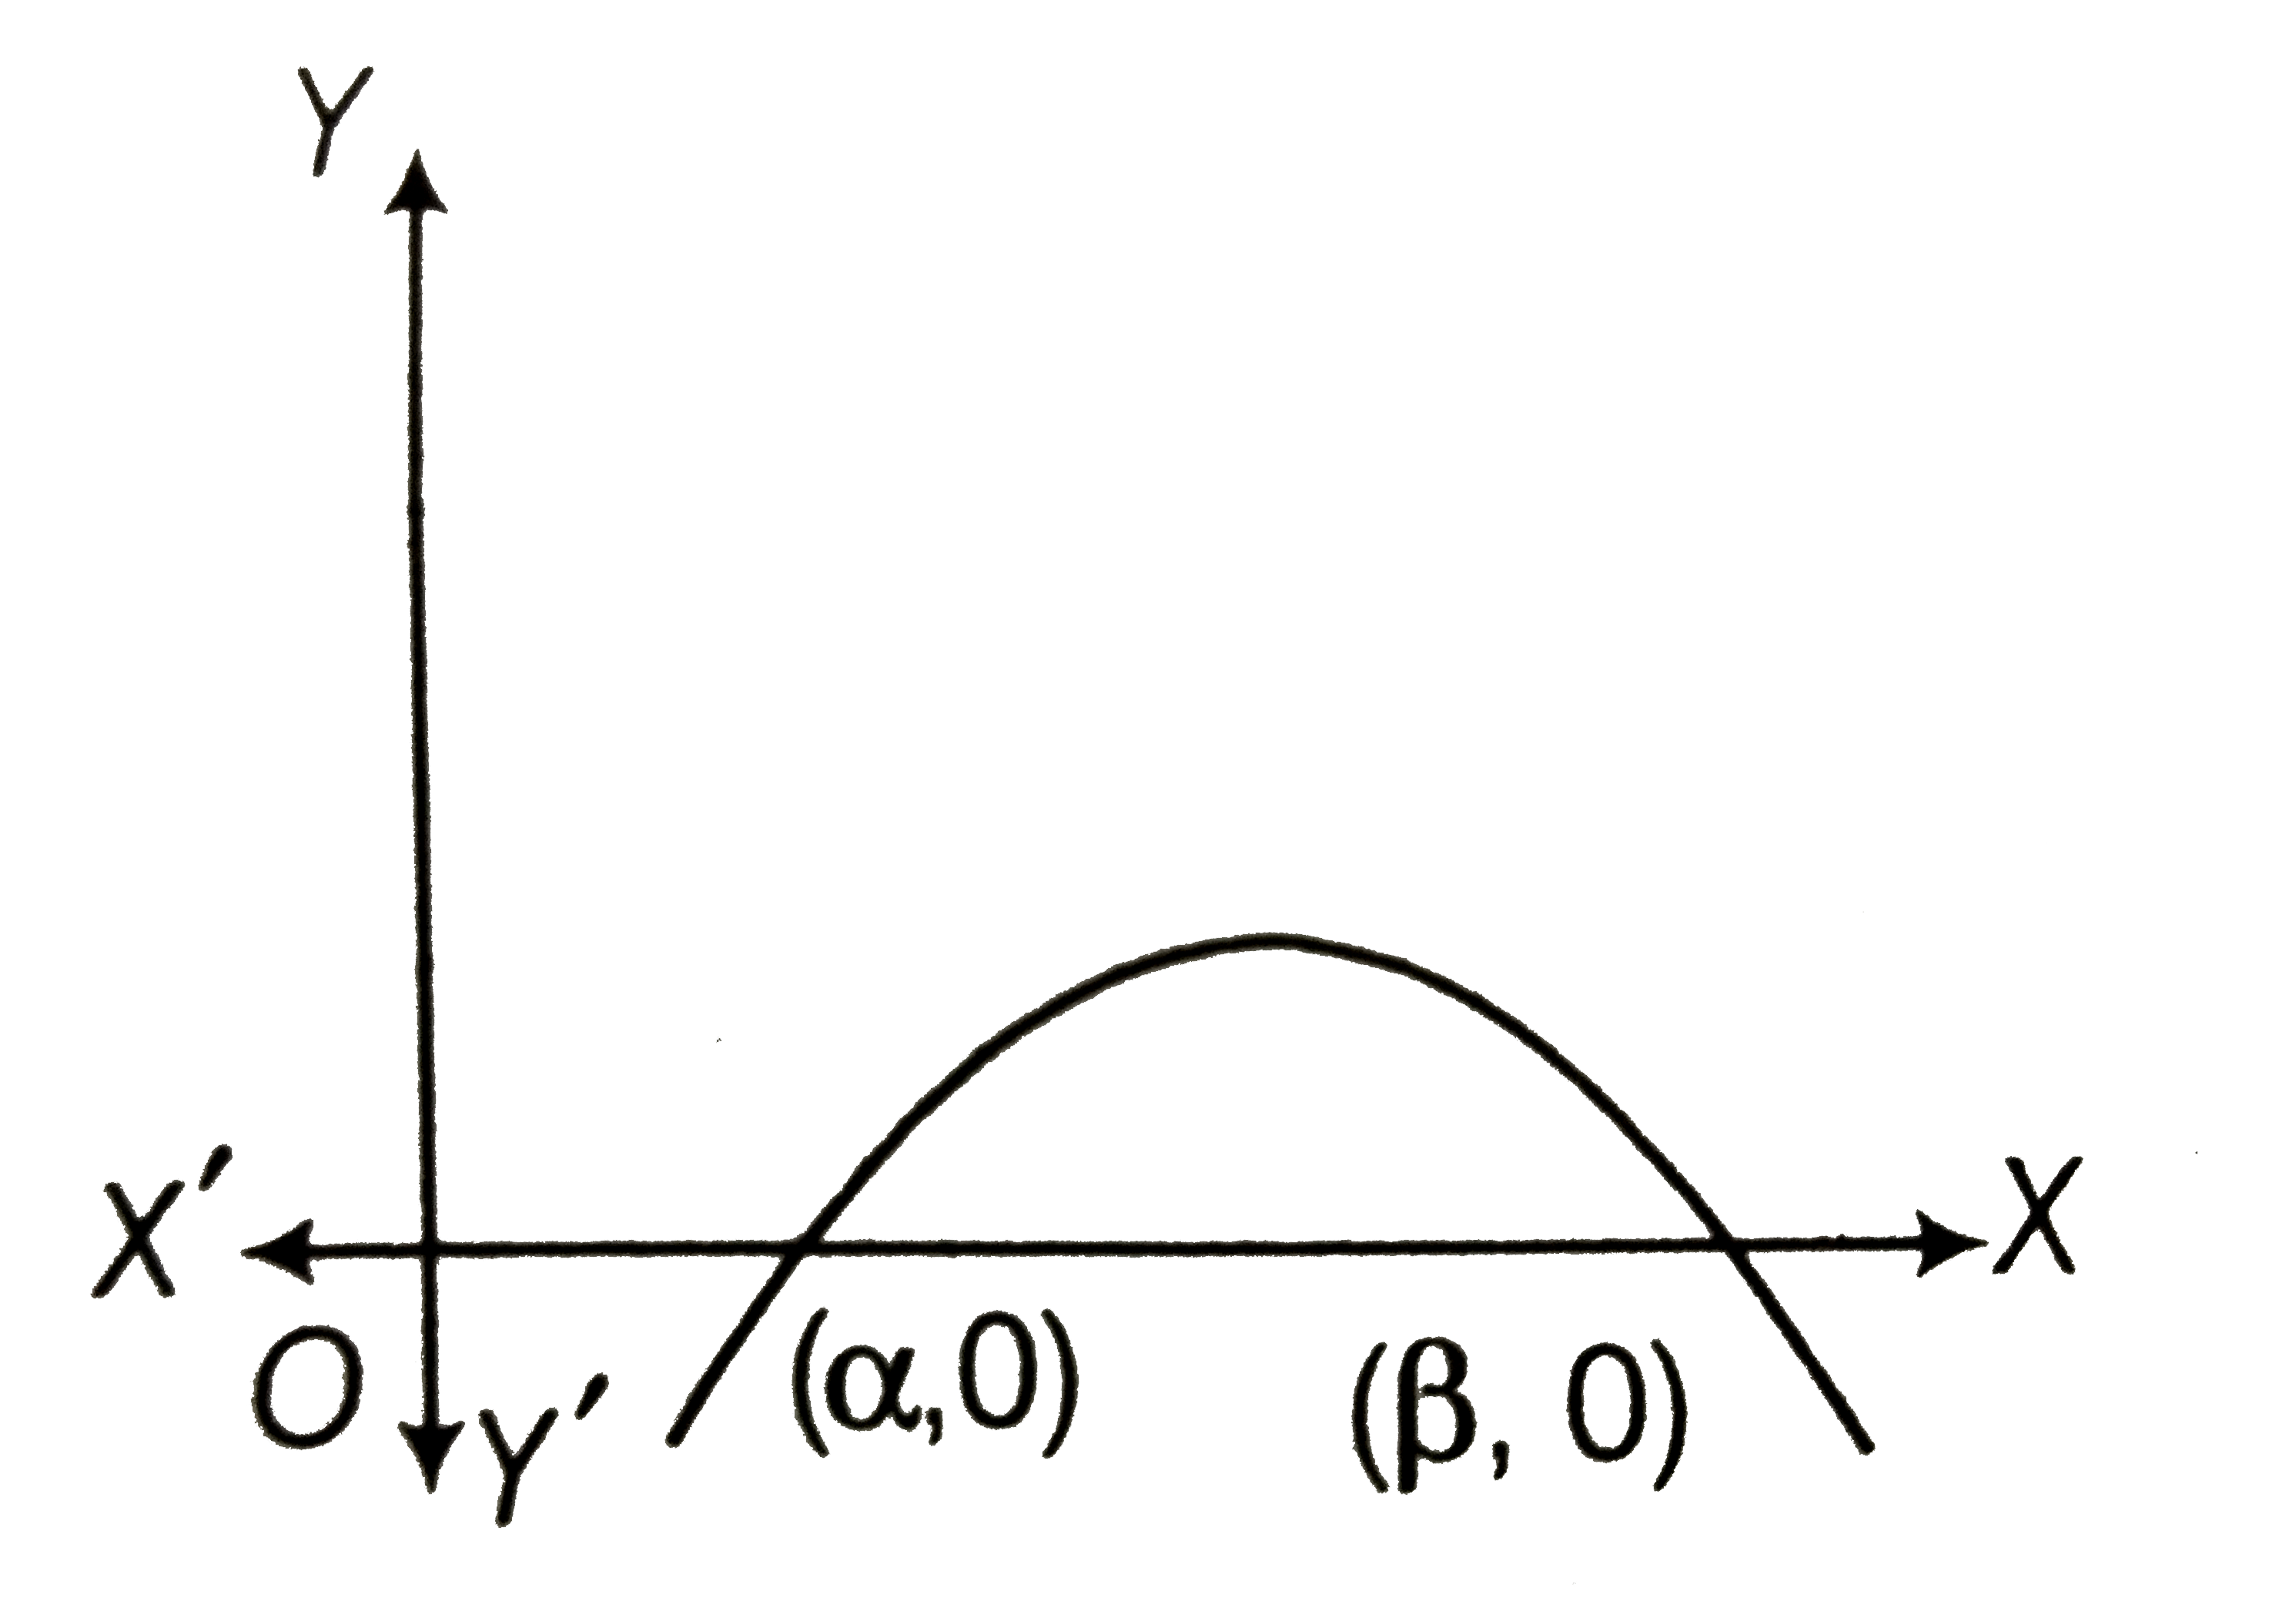
View SolutionFocus of parabola y=ax2+bx+c is
View SolutionGraph of quadratic expression y=ax2+bx+c is given then
View Solution

