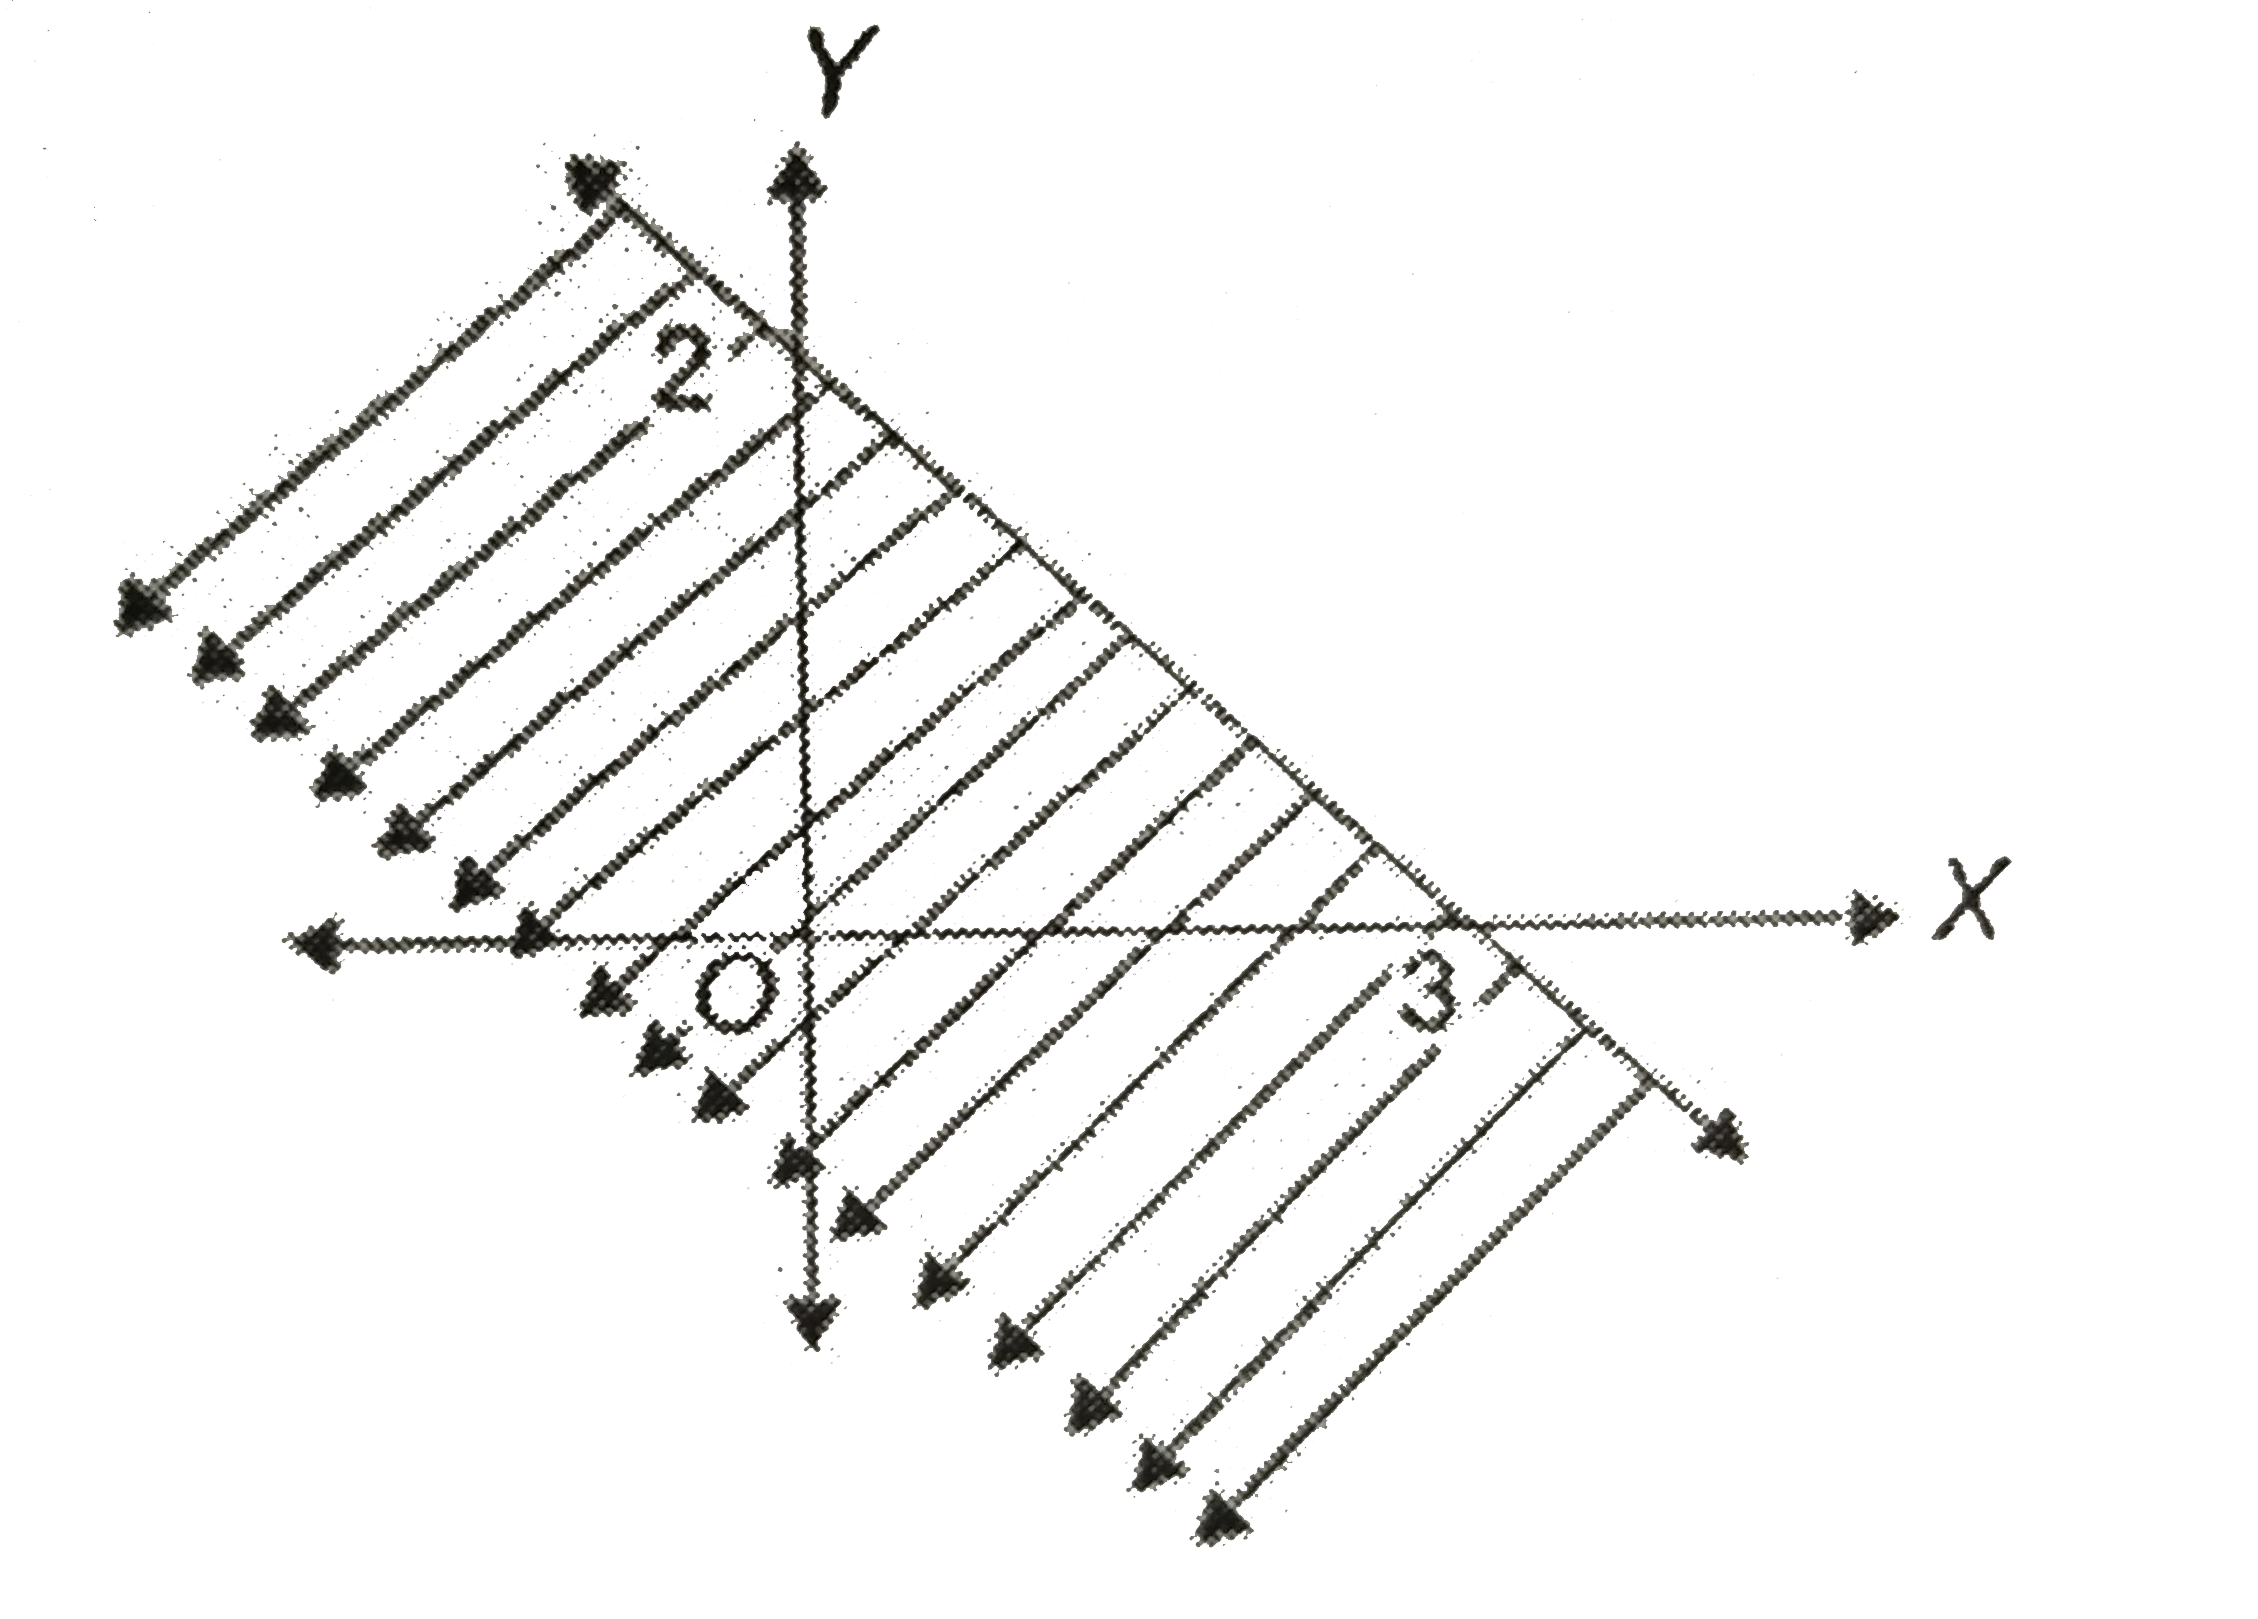
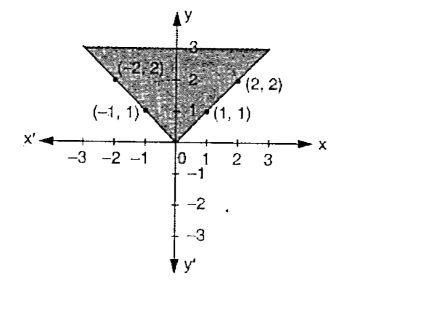
The inequation represented by the graph given below is :
x≥y
x≤y
x+y≥0
x+y≤0
The correct Answer is:B
The corresponding equation of the line is x=y.
Topper's Solved these Questions
- LINEAR PROGRAMMINGBOOK - PEARSON IIT JEE FOUNDATIONCHAPTER - LINEAR PROGRAMMINGEXERCISE - Level 2
15 Videos
- LINEAR PROGRAMMINGBOOK - PEARSON IIT JEE FOUNDATIONCHAPTER - LINEAR PROGRAMMINGEXERCISE - Level 3
10 Videos
- LINEAR PROGRAMMINGBOOK - PEARSON IIT JEE FOUNDATIONCHAPTER - LINEAR PROGRAMMINGEXERCISE - Easy type Question
5 Videos
- LIMITSBOOK - PEARSON IIT JEE FOUNDATIONCHAPTER - LIMITSEXERCISE - LEVEL-3
15 Videos
- LOGARITHMSBOOK - PEARSON IIT JEE FOUNDATIONCHAPTER - LOGARITHMSEXERCISE - Level 3
15 Videos
Similar Questions
Knowledge Check
The equation of the graph given below is
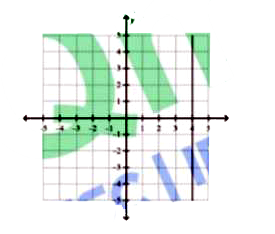 AY=4BX=4CX=−4DY=0
The inequality representing the following graph is
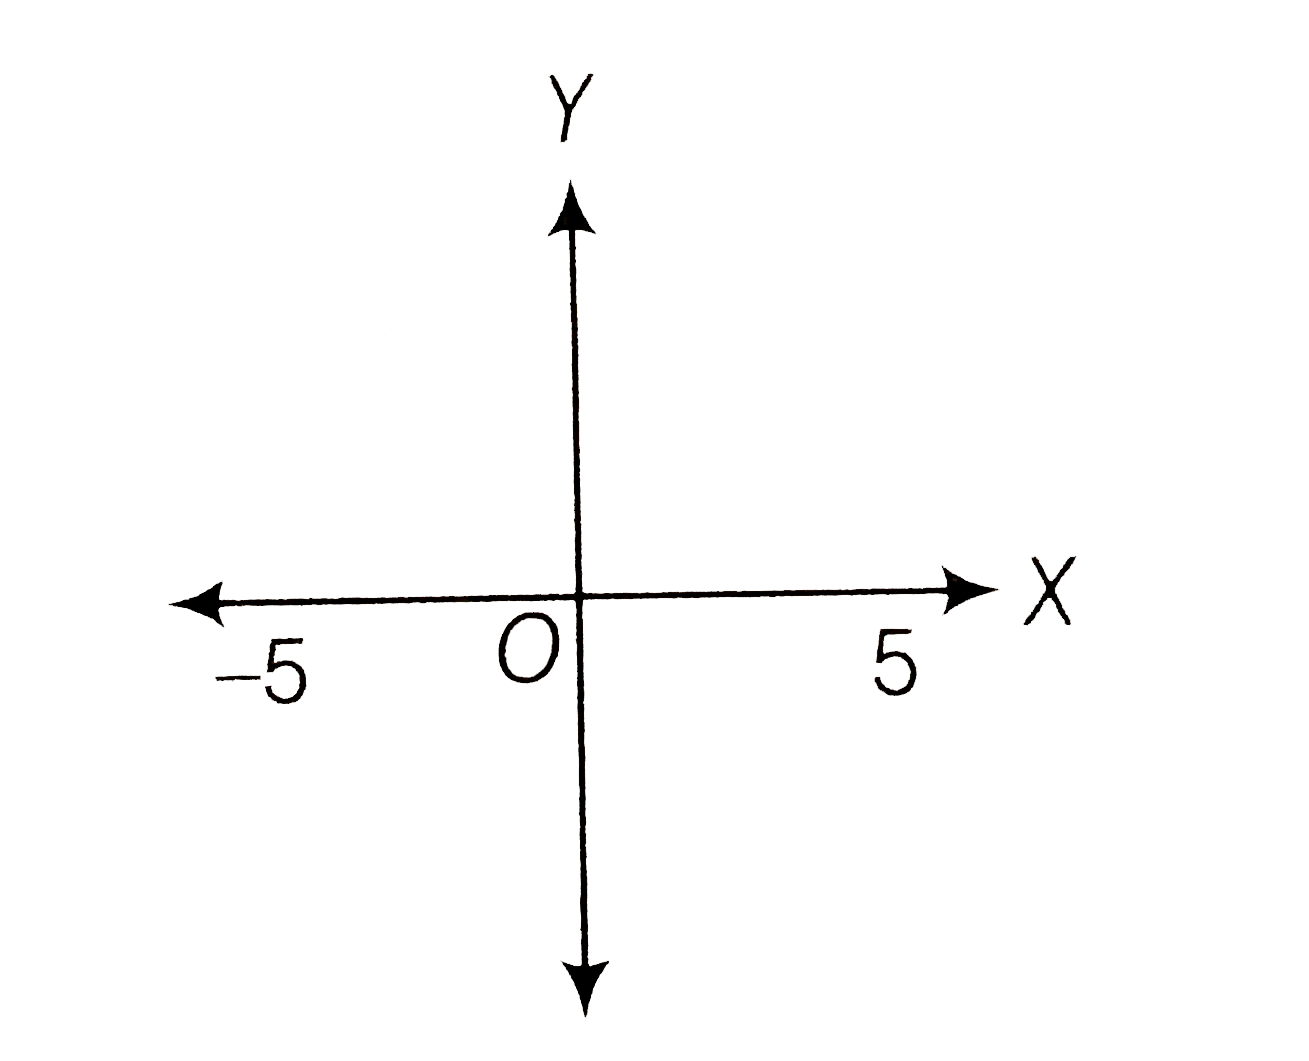 A|x|<5B|x|≤5C|x|>5D|x|≥5
The inequality representing the following graph is
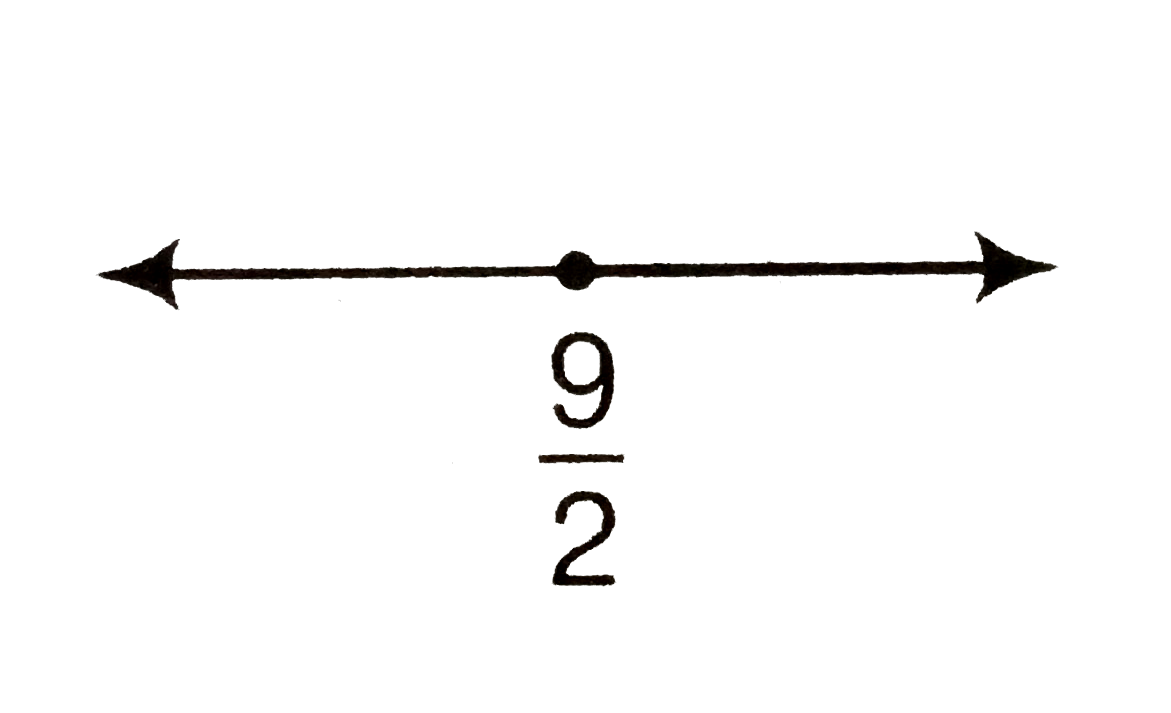 Ax∈(92,∞)Bx∈[92,∞)Cx∈−[∞,92)Dx∈(−∞,92]
In a survey of 130 families of a colony, the number of children in each family was recorded and the data has been represented by the bar graph, given below.
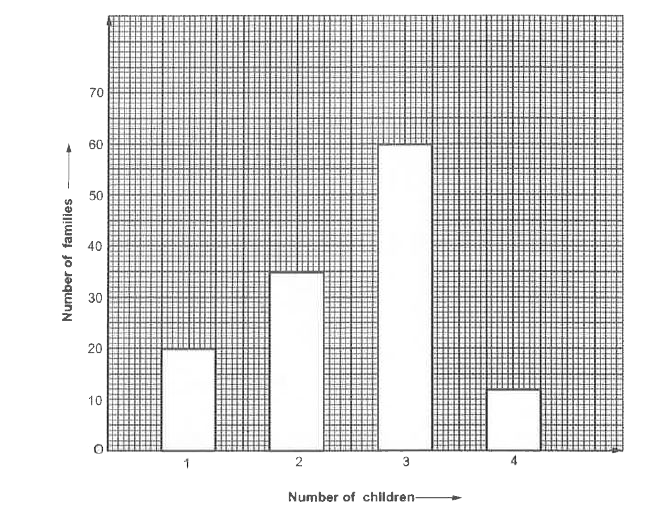
Read the bar graph carefully and answer the questions given below:
(i)what information does the bar graph give?
(ii)how many families have two children ?
(iii)how many families have no children ?
(iv)what percentage of families have 4 children?
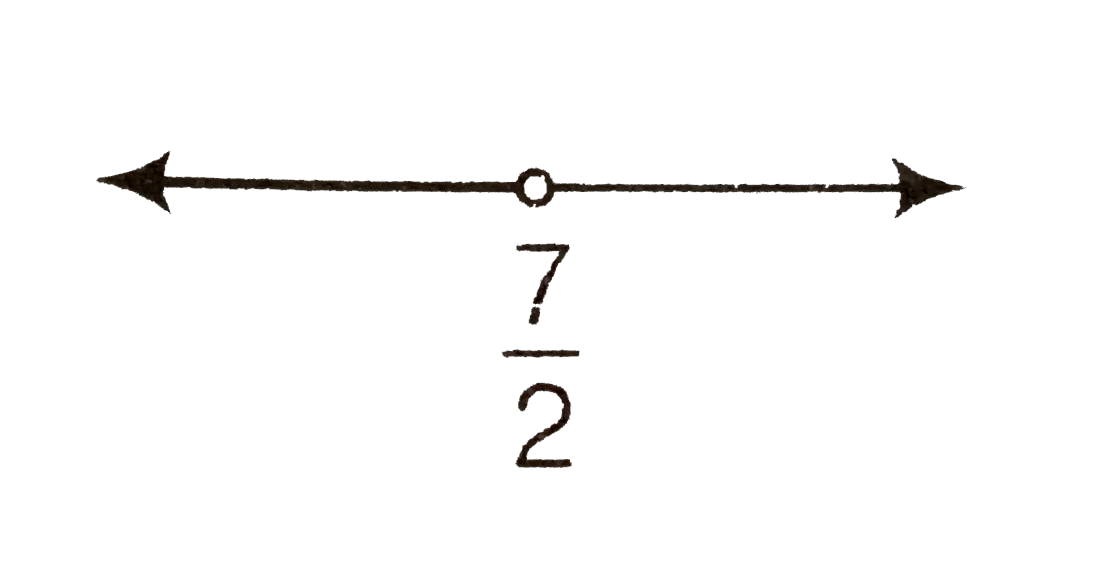
View SolutionThe inequality representing the following graph is
View SolutionStudy the charactristics of a population represented in the graphs below.
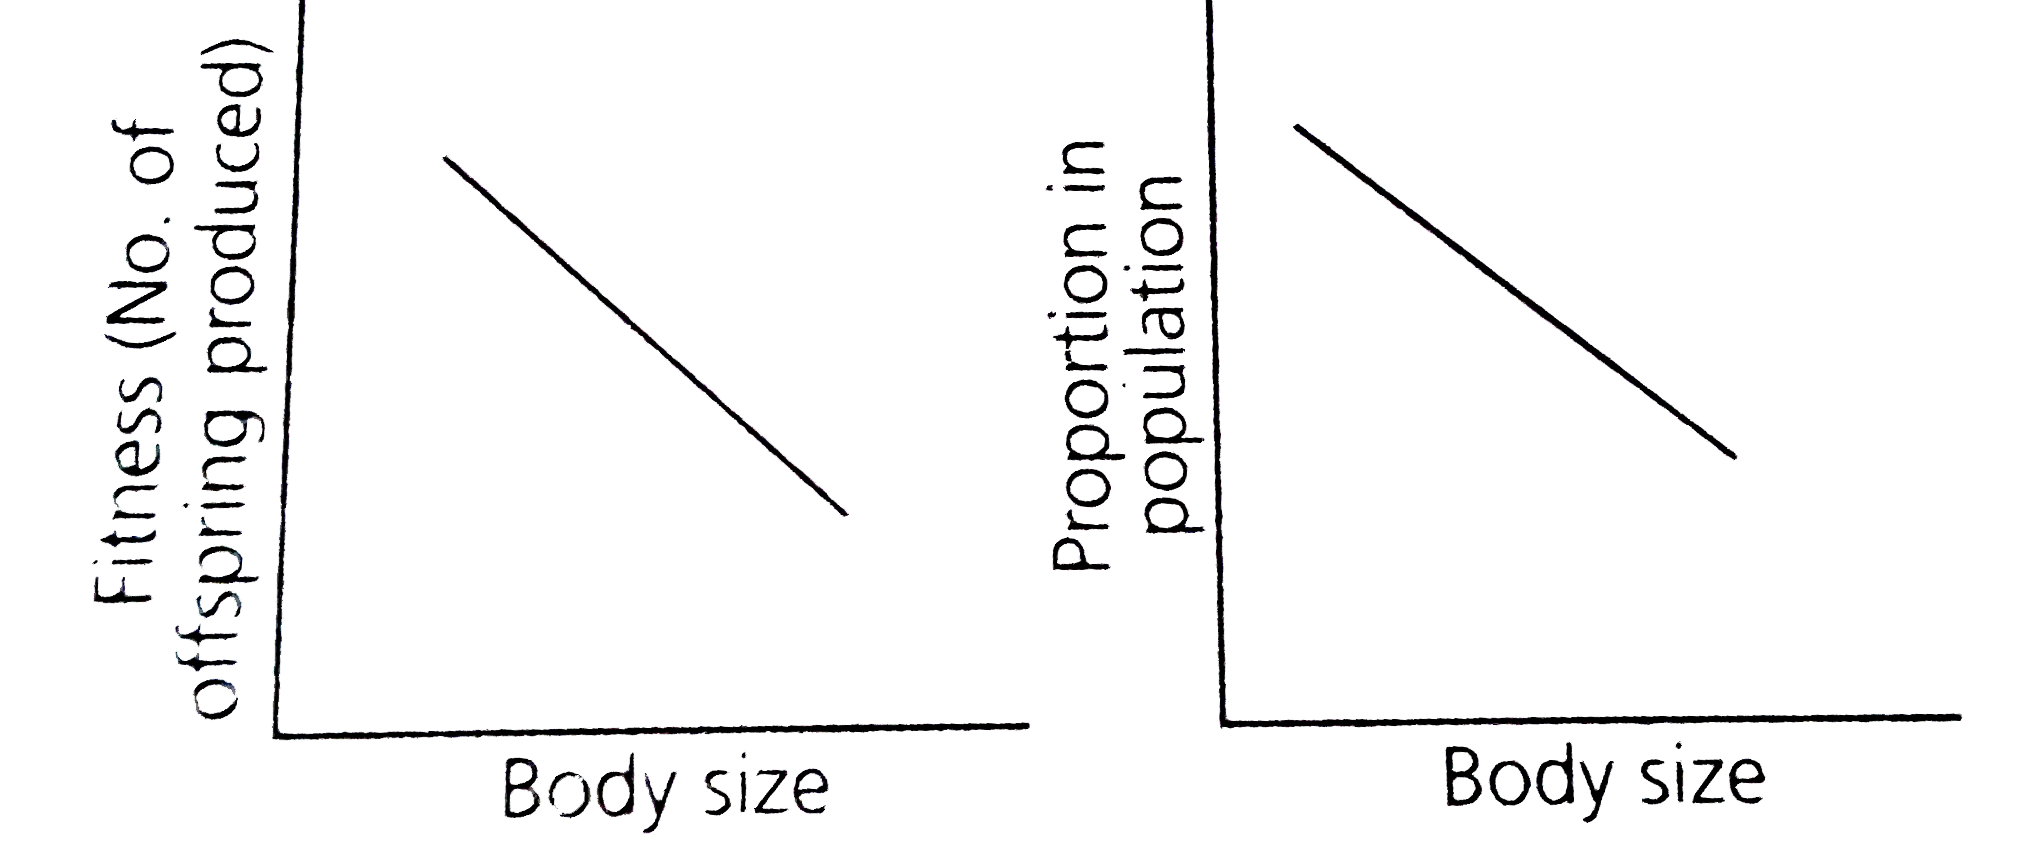
Mark the correct graph that represents the type of selection that this population is likely to undergo
View SolutionStudy the charactristics of a population represented in the graphs below.

Mark the correct graph that represents the type of selection that this population is likely to undergo

View SolutionThe shaded region is represented by the inequation:
View Solution

