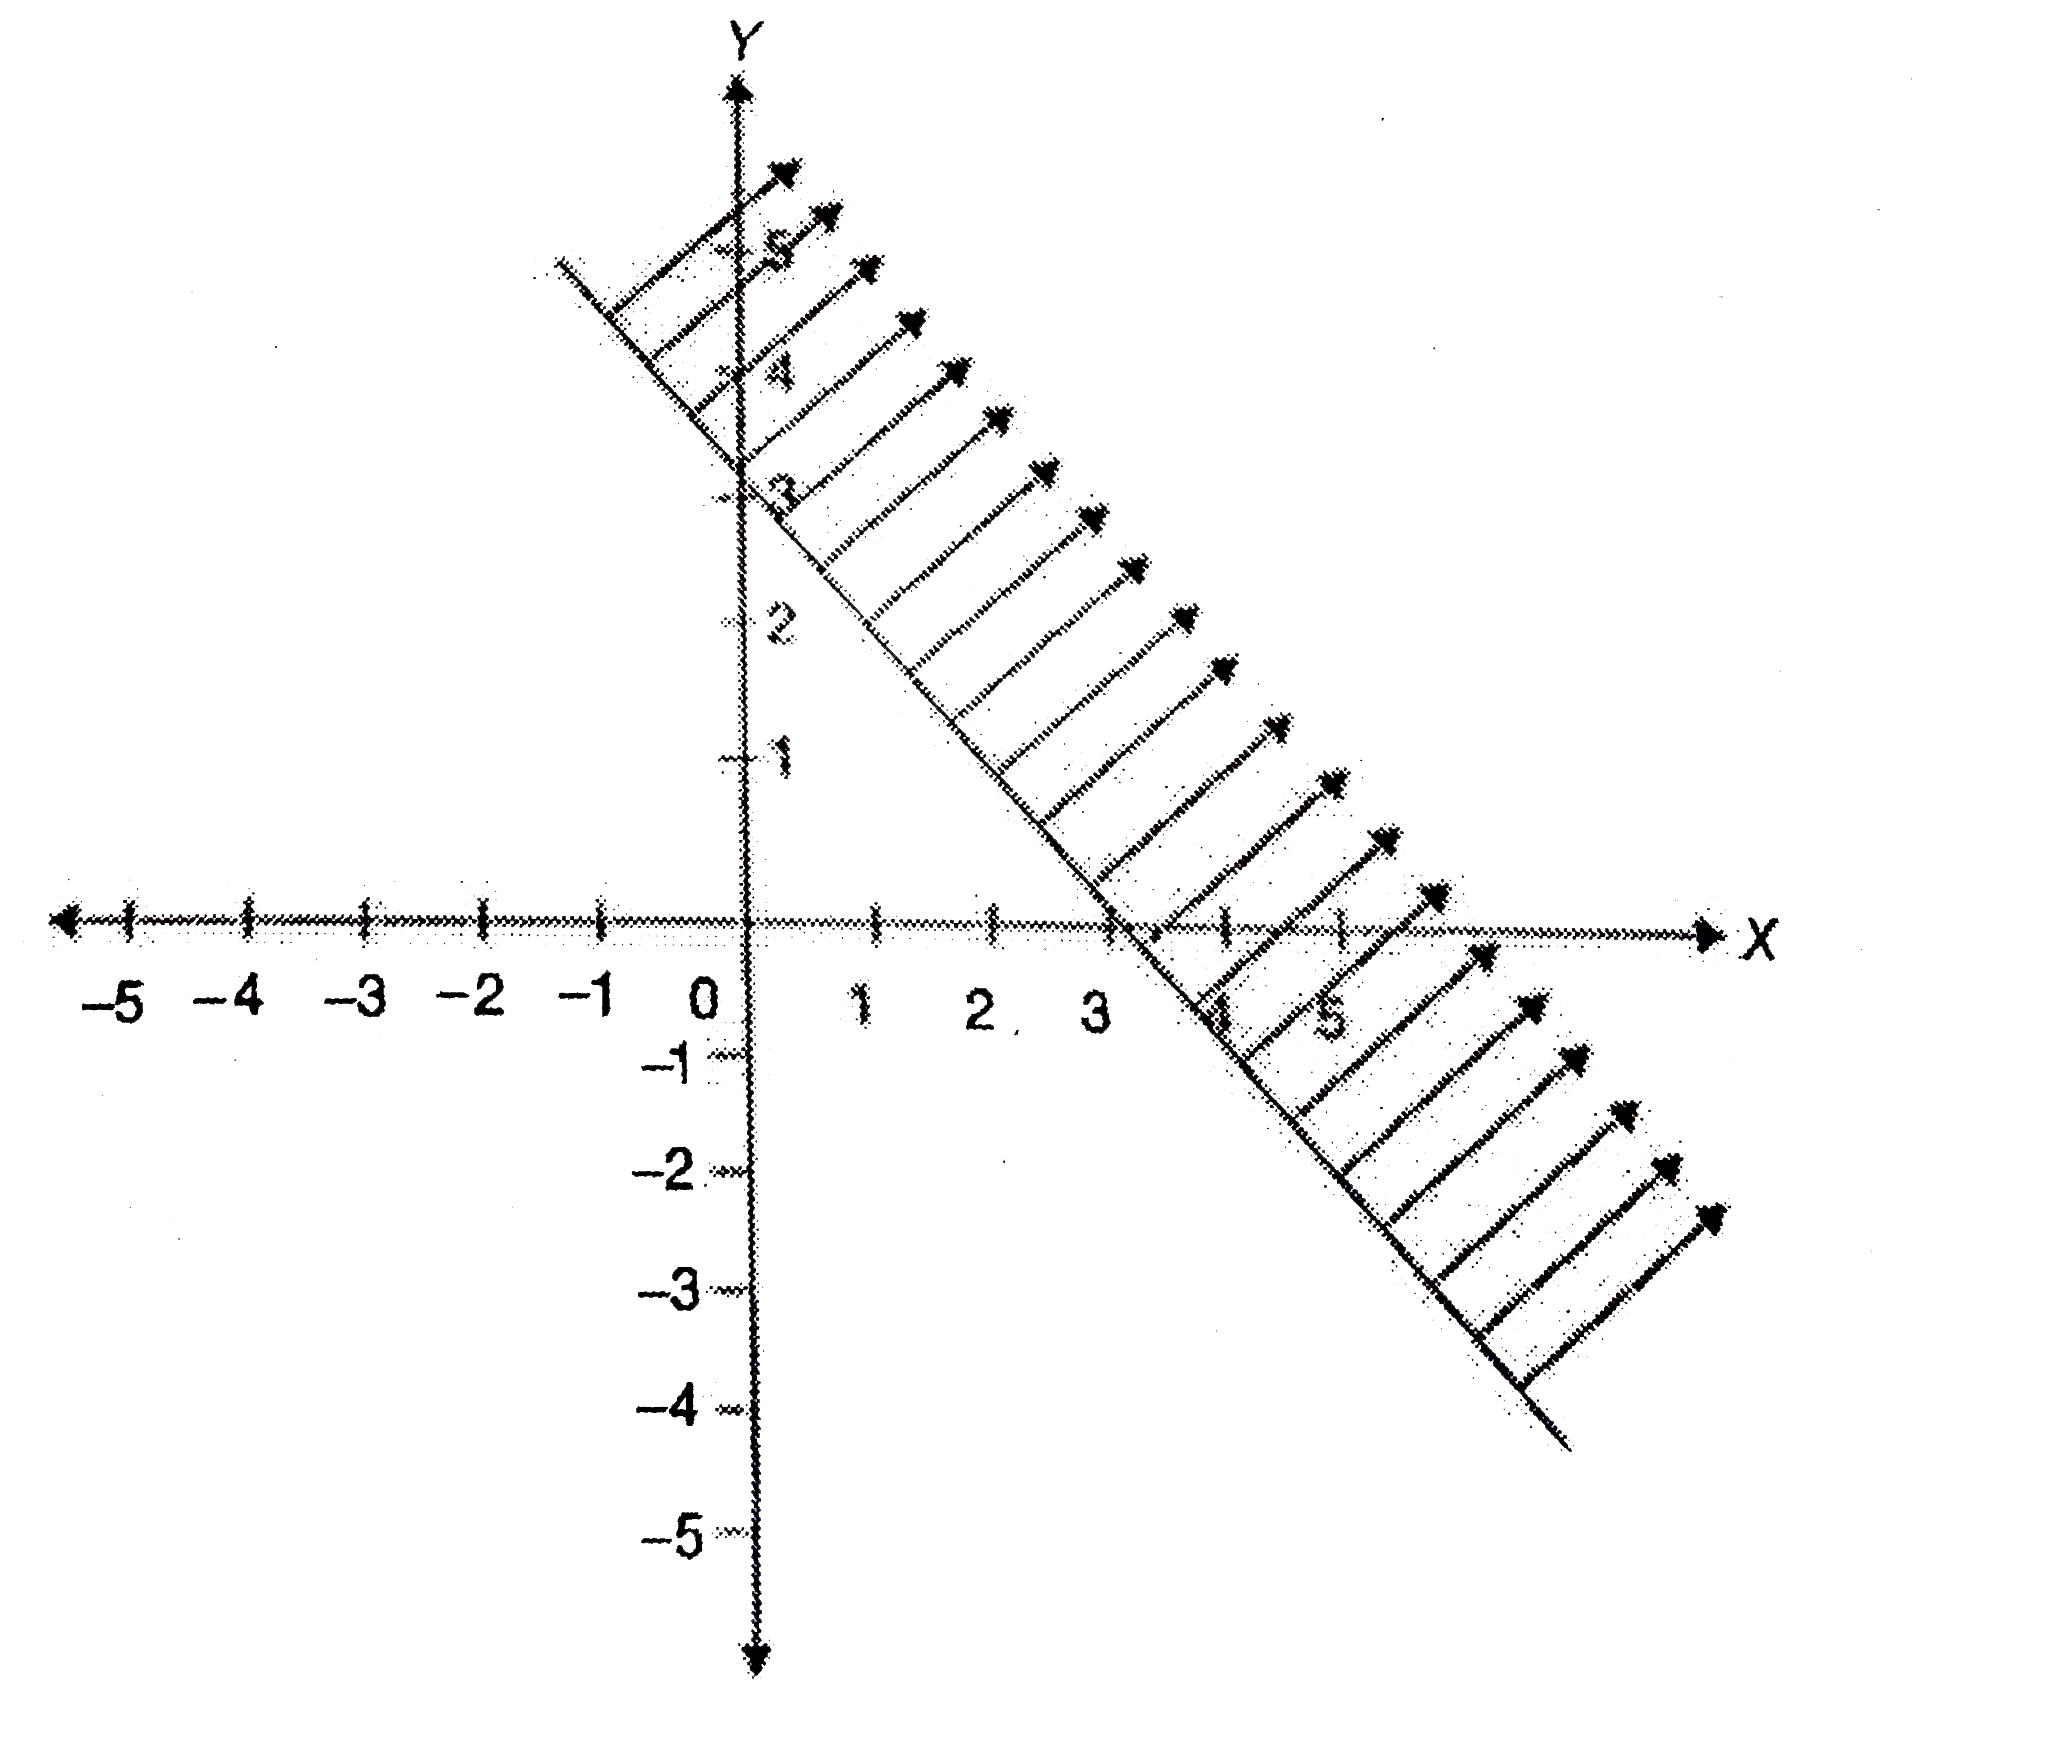
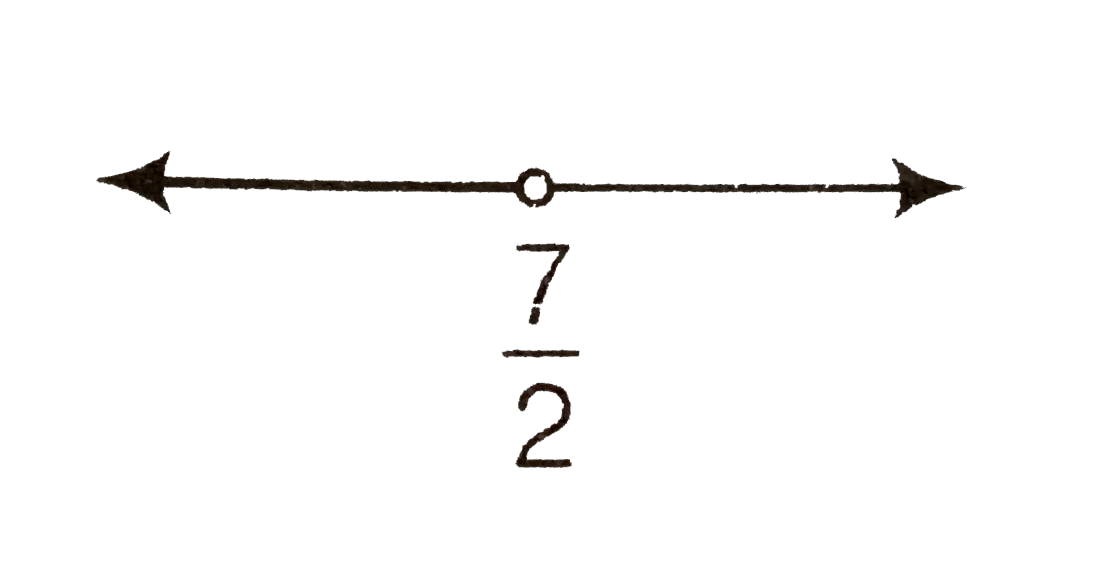
The inequality representing the following graph is
A
x∈(−∞,72)
B
x∈(−∞,72]
C
x∈[72,−∞)
D
x∈(72,∞)
Video Solution
Text Solution
The correct Answer is:A
The given graph represents all the values less than 72 on the real line.
⇒x∈(−∞,72)
|
Updated on:21/07/2023
Topper's Solved these Questions
- BOOK - NCERT EXEMPLARCHAPTER - LINEAR INEQUALITIESEXERCISE - Long Answer Type Question6videos
LINEAR INEQUALITIES
- BOOK - NCERT EXEMPLARCHAPTER - LIMITS AND DERIVATIVES EXERCISE - FILLERS4videos
LIMITS AND DERIVATIVES
- BOOK - NCERT EXEMPLARCHAPTER - MATHEMATICAL REASONING EXERCISE - OBJECTIVE TYPE QUESTIONS21videos
MATHEMATICAL REASONING
Similar Questions
Knowledge Check
- Question 1 - Select One
The function represented by the following graph is
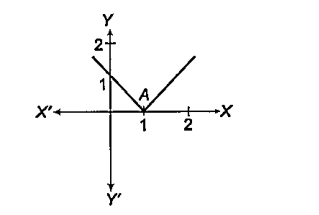 Acontinuous but not differentiable at x=1Bdifferentiable but not continuous at x=1Ccontinuous and differentiable at x=1Dneither continuous nor differentiable at x=1
 - Question 2 - Select One
Which of the following graph represents e−x?
A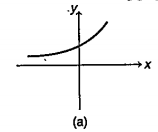 B
B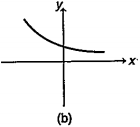 C
C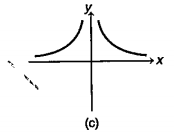 D
D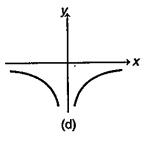
- Question 3 - Select One
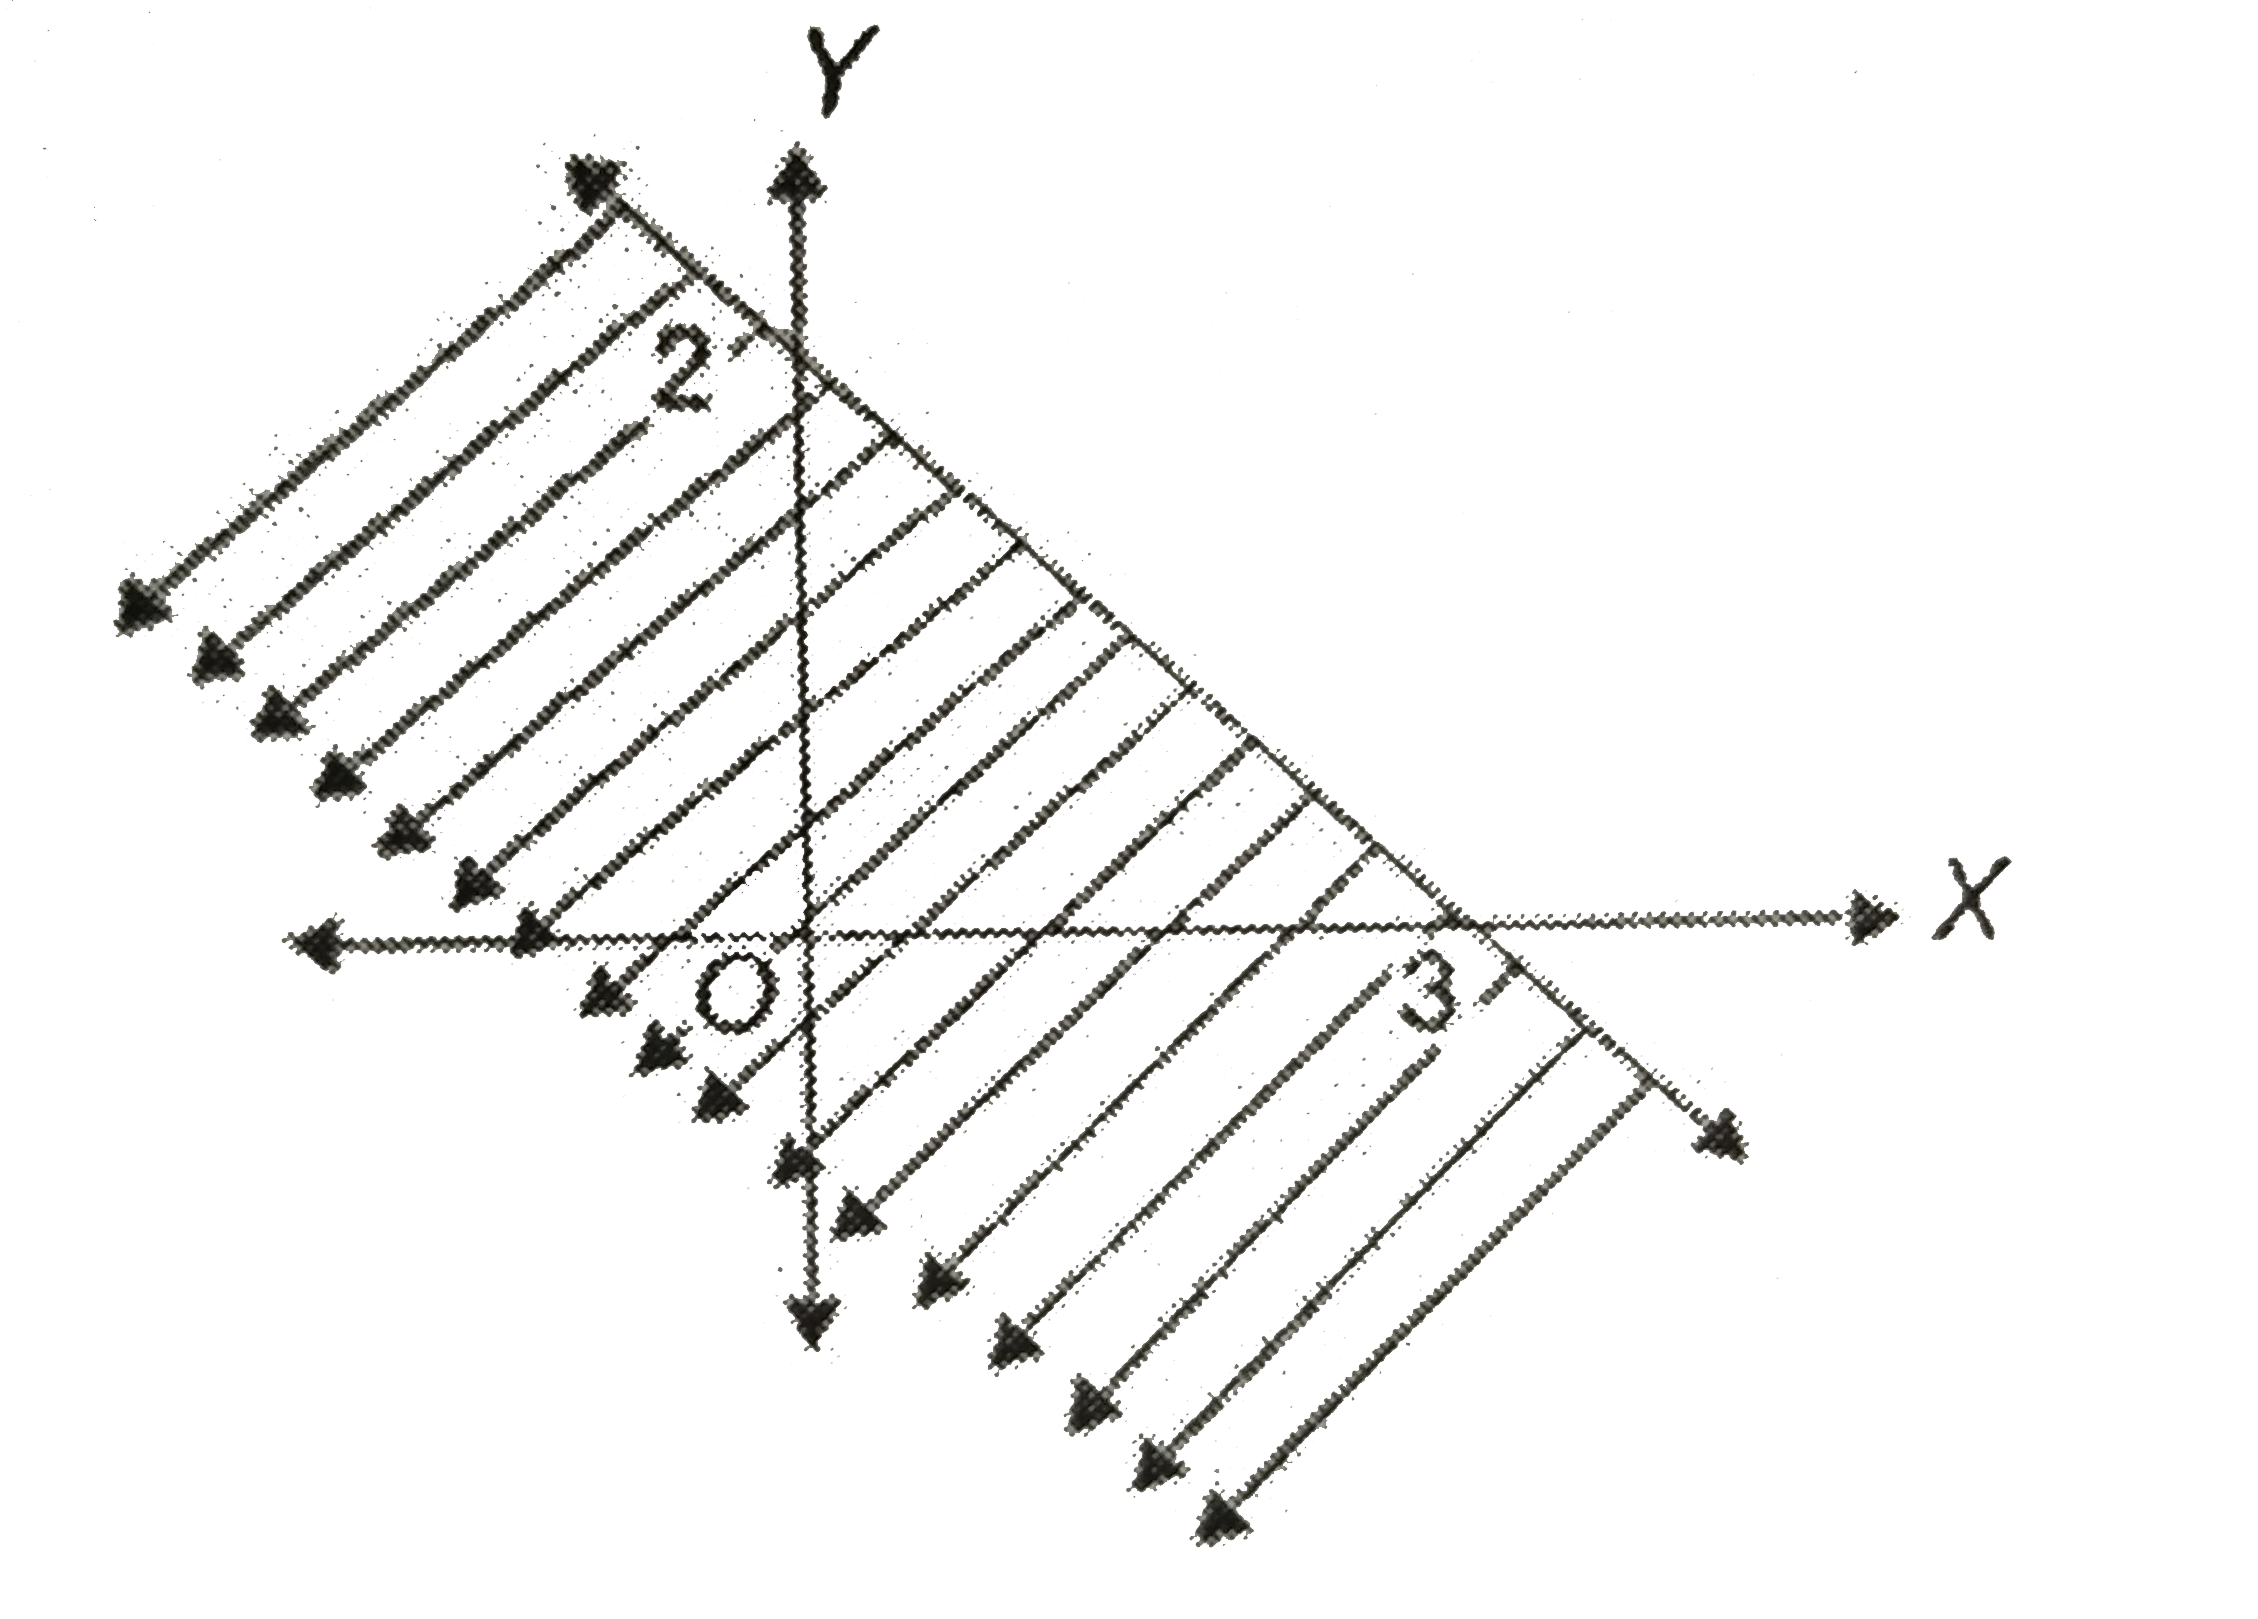
The solution of the inequality 3x+2y>6in the graph is represented by shading the
AHalf plane, which contains origin including the points on the lineBHalf plane , which does not contain origin excluding the points on the lineCHalf plane, which does not contain origin including the point on the lineDHalf plane, which contain origin excluding the points on the line
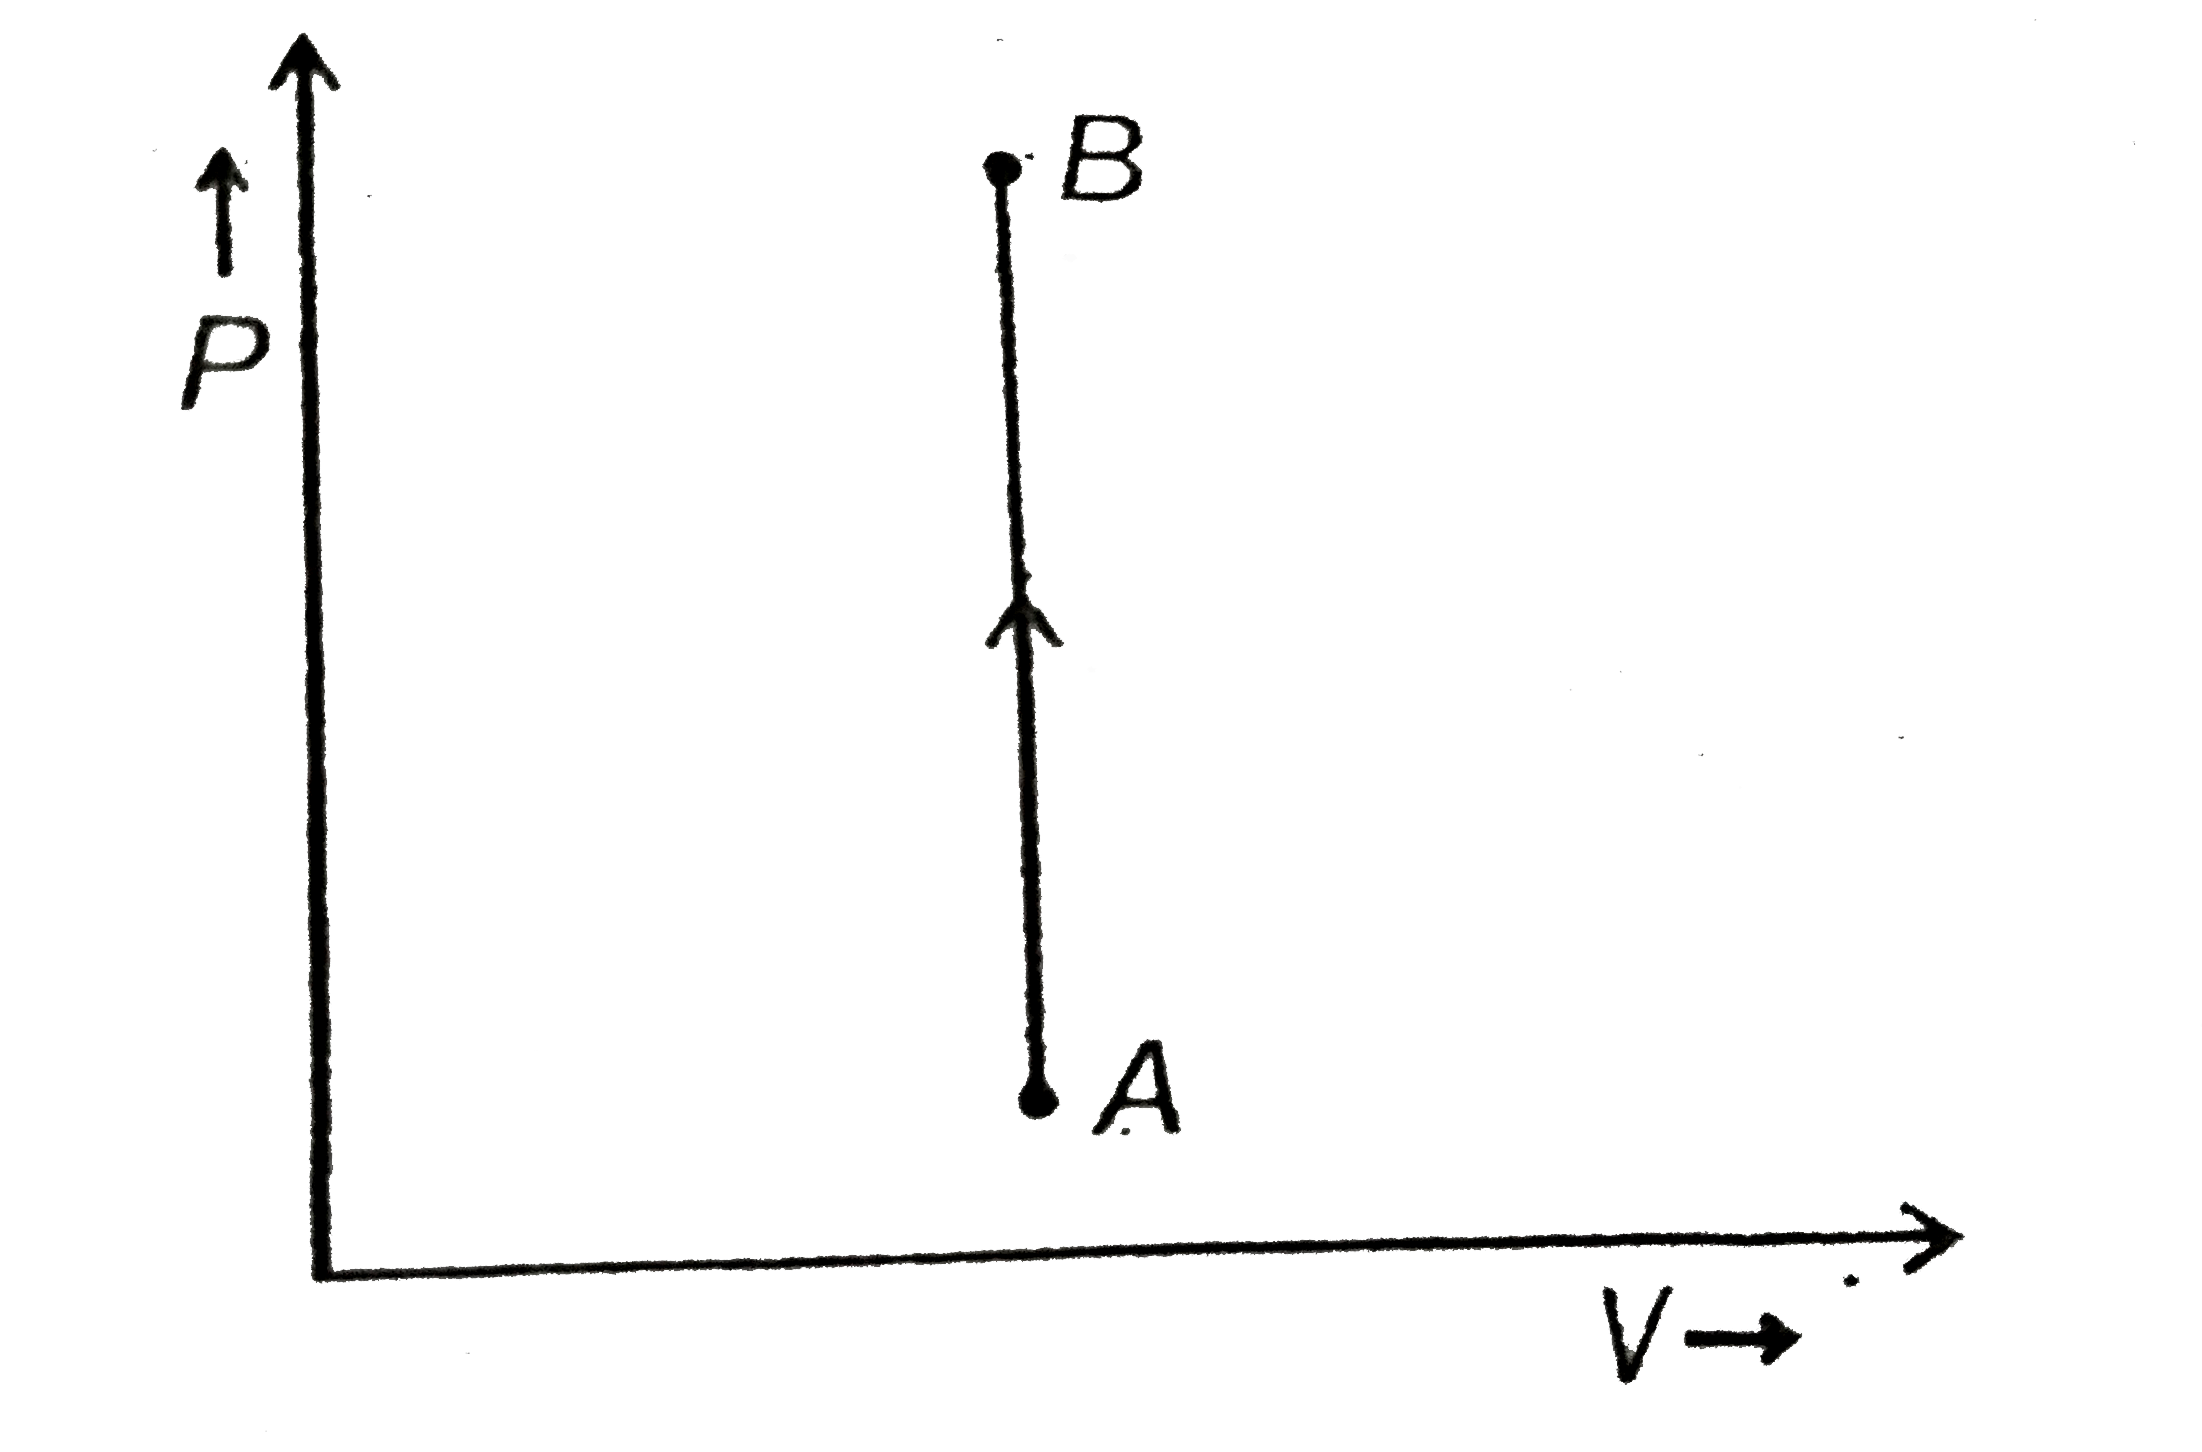
The following graph represents
 View Solution
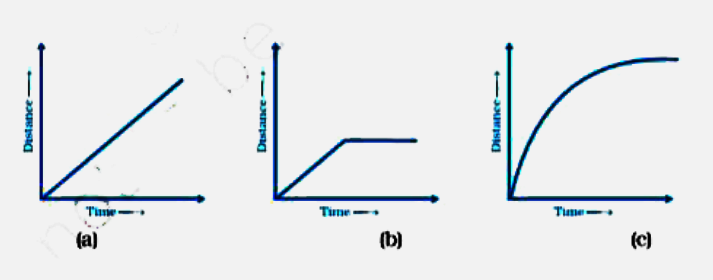
Explain the situations represented by the following distance-time graphs :
 View Solution
Explain the situations represented by the following distance-time graphs.
 View Solution
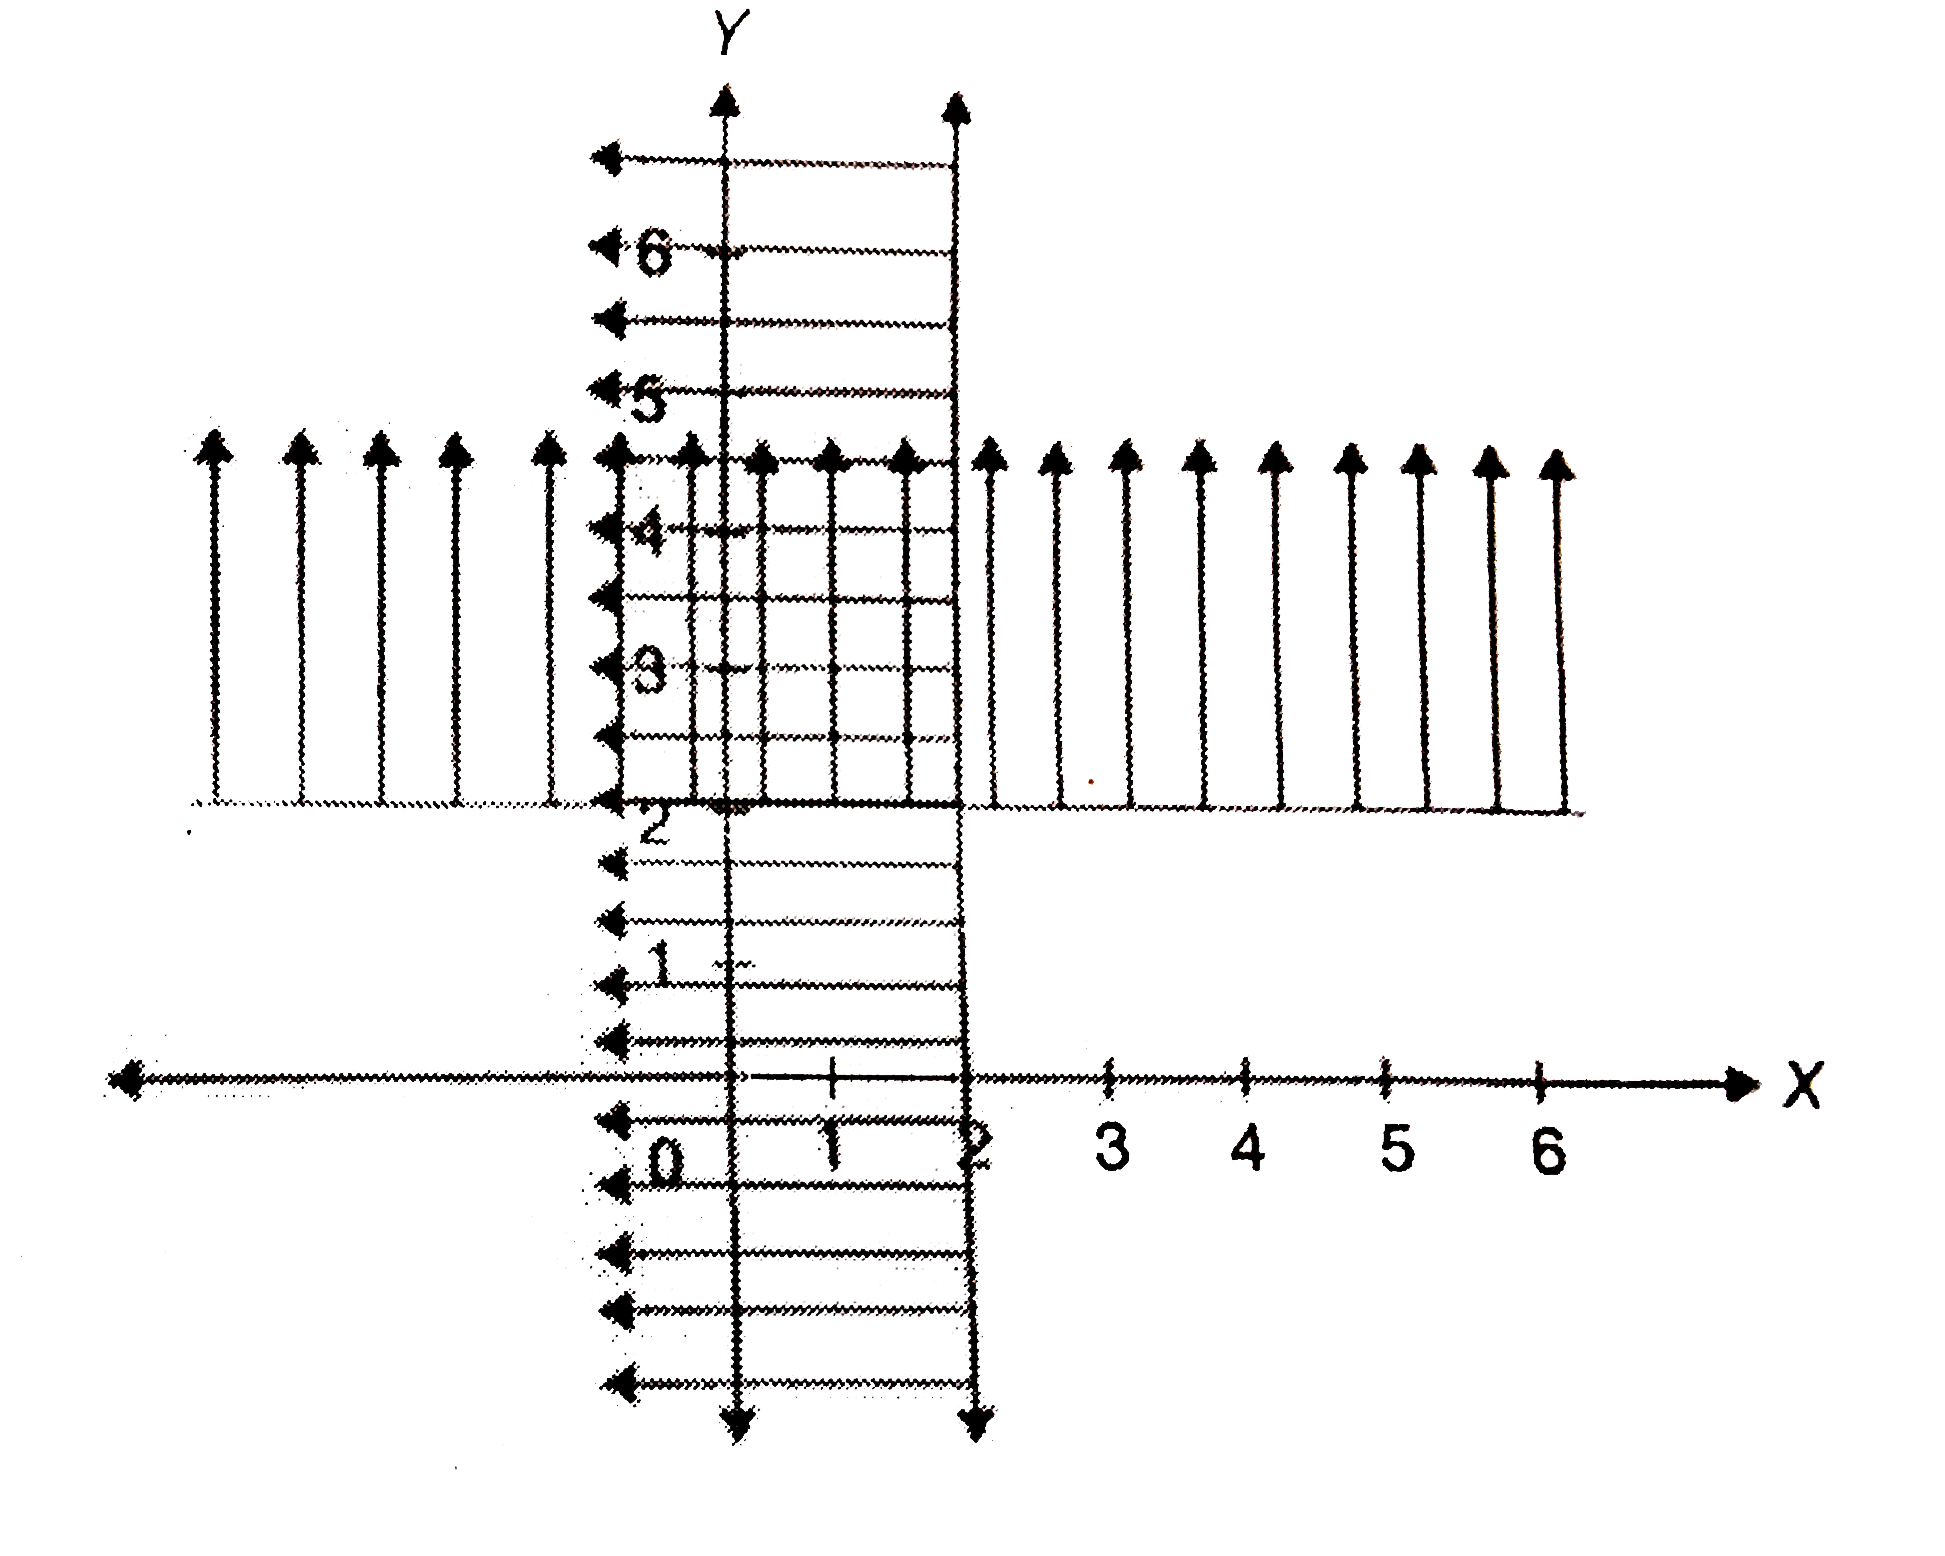
Inequations that represents the shaded region of the following graph is ____
 View Solution
Represent the following inequations graphically
View Solution


