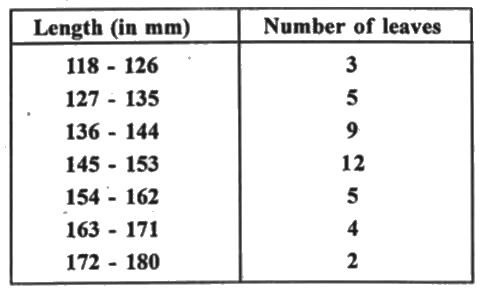
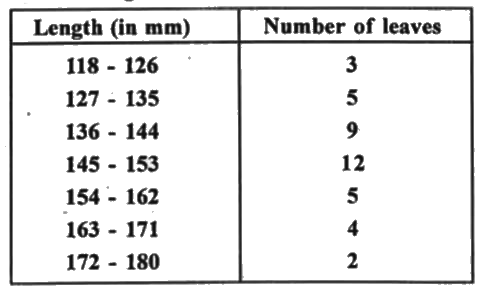
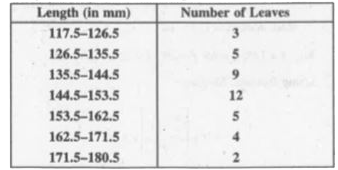
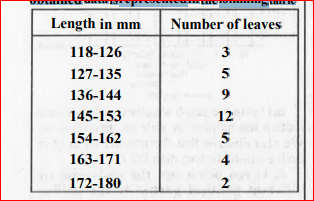
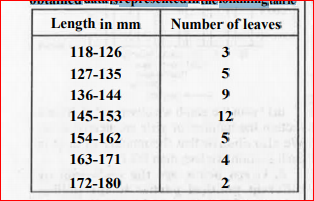
The length of 40 leaves of a plant are measured correct to one millimeter, and the obtained data is represented in the following table:
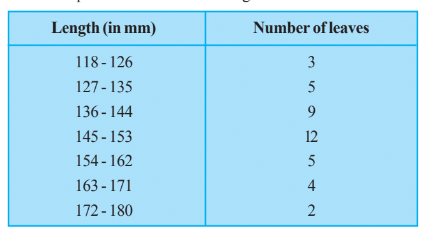
(i) Draw a histogram to represent the given data.
(ii) Is there any other suitable graphical representation for the same data?
(iii) Is it correct to conclude that the maximum number of leaves are 153 mm long?Why?
1)The above data is represented through a histogram as below:
Represent length of leaves on the x-axis (in mm) and the number of leaves on the y-axis.
Put a scale of ‘1 unit = 2 leaves on y-axis since the lower-class value is 2 and the highest class value is 12.
Also, since the interval of first-class is starting from 117.5 and not from zero, we represent it on the graph by making a kink on the x-axis.
Now draw rectangular bars of equal width and the lengths according to the class interval's frequencies.
(ii) The other suitable graphical representation of the given data would be a frequency polygon.
(iii) The maximum number of leaves lie between 144.5 mm and 153.5 mm in length. Hence, we can't conclude that the maximum leaves are 153 mm long.
Topper's Solved these Questions
- STATISTICSBOOK - NCERTCHAPTER - STATISTICSEXERCISE - EXERCISE 14.1
2 Videos
- STATISTICSBOOK - NCERTCHAPTER - STATISTICSEXERCISE - Exercise 14.2
9 Videos
- QUADRILATERALSBOOK - NCERTCHAPTER - QUADRILATERALSEXERCISE - SOLVED EXAMPLES
8 Videos
- SURFACE AREAS AND VOLUMESBOOK - NCERTCHAPTER - SURFACE AREAS AND VOLUMESEXERCISE - EXERCISE 13.8
10 Videos
Similar Questions
Give five examples of data that you can collect from your day-to-day life.
View SolutionThree coins were tossed 30 times simultaneously. Each time the number of heads occurring was noted down as follows: 0 1 2 2 1 2 3 1 3 0 1 3 1 1 2 2 0 1 2 1 3 0 0 1 1 2 3 2 2 0 Prepare a frequency distribution table for the data given above.
View SolutionShow that each angle of a rectangle is a right angle.
View SolutionA capsule of medicine is in the shape of a sphere of diameter 3.5 mm. How muchMedicine (∈ mm3) is needed to fill this capsule?
View SolutionThe length of 40 leaves of a plant measured correct to one millimetre and the obtained data is represented in the following table:

(i) Draw a histogram to represent the given data.
(ii) Is there any other suitable graphical representation for the same data?
(iii) Is it correct to conclude that the maximum number of leaves 153 mm long and why?
View Solutionएक पौधे की 40 पत्तियों की लंबाइयाँ एक मिलीमीटर तक शुद्व मापी हैं और प्राप्त आंकडों को निम्नलिखित सारणी में निरूपित किया गया हैं:
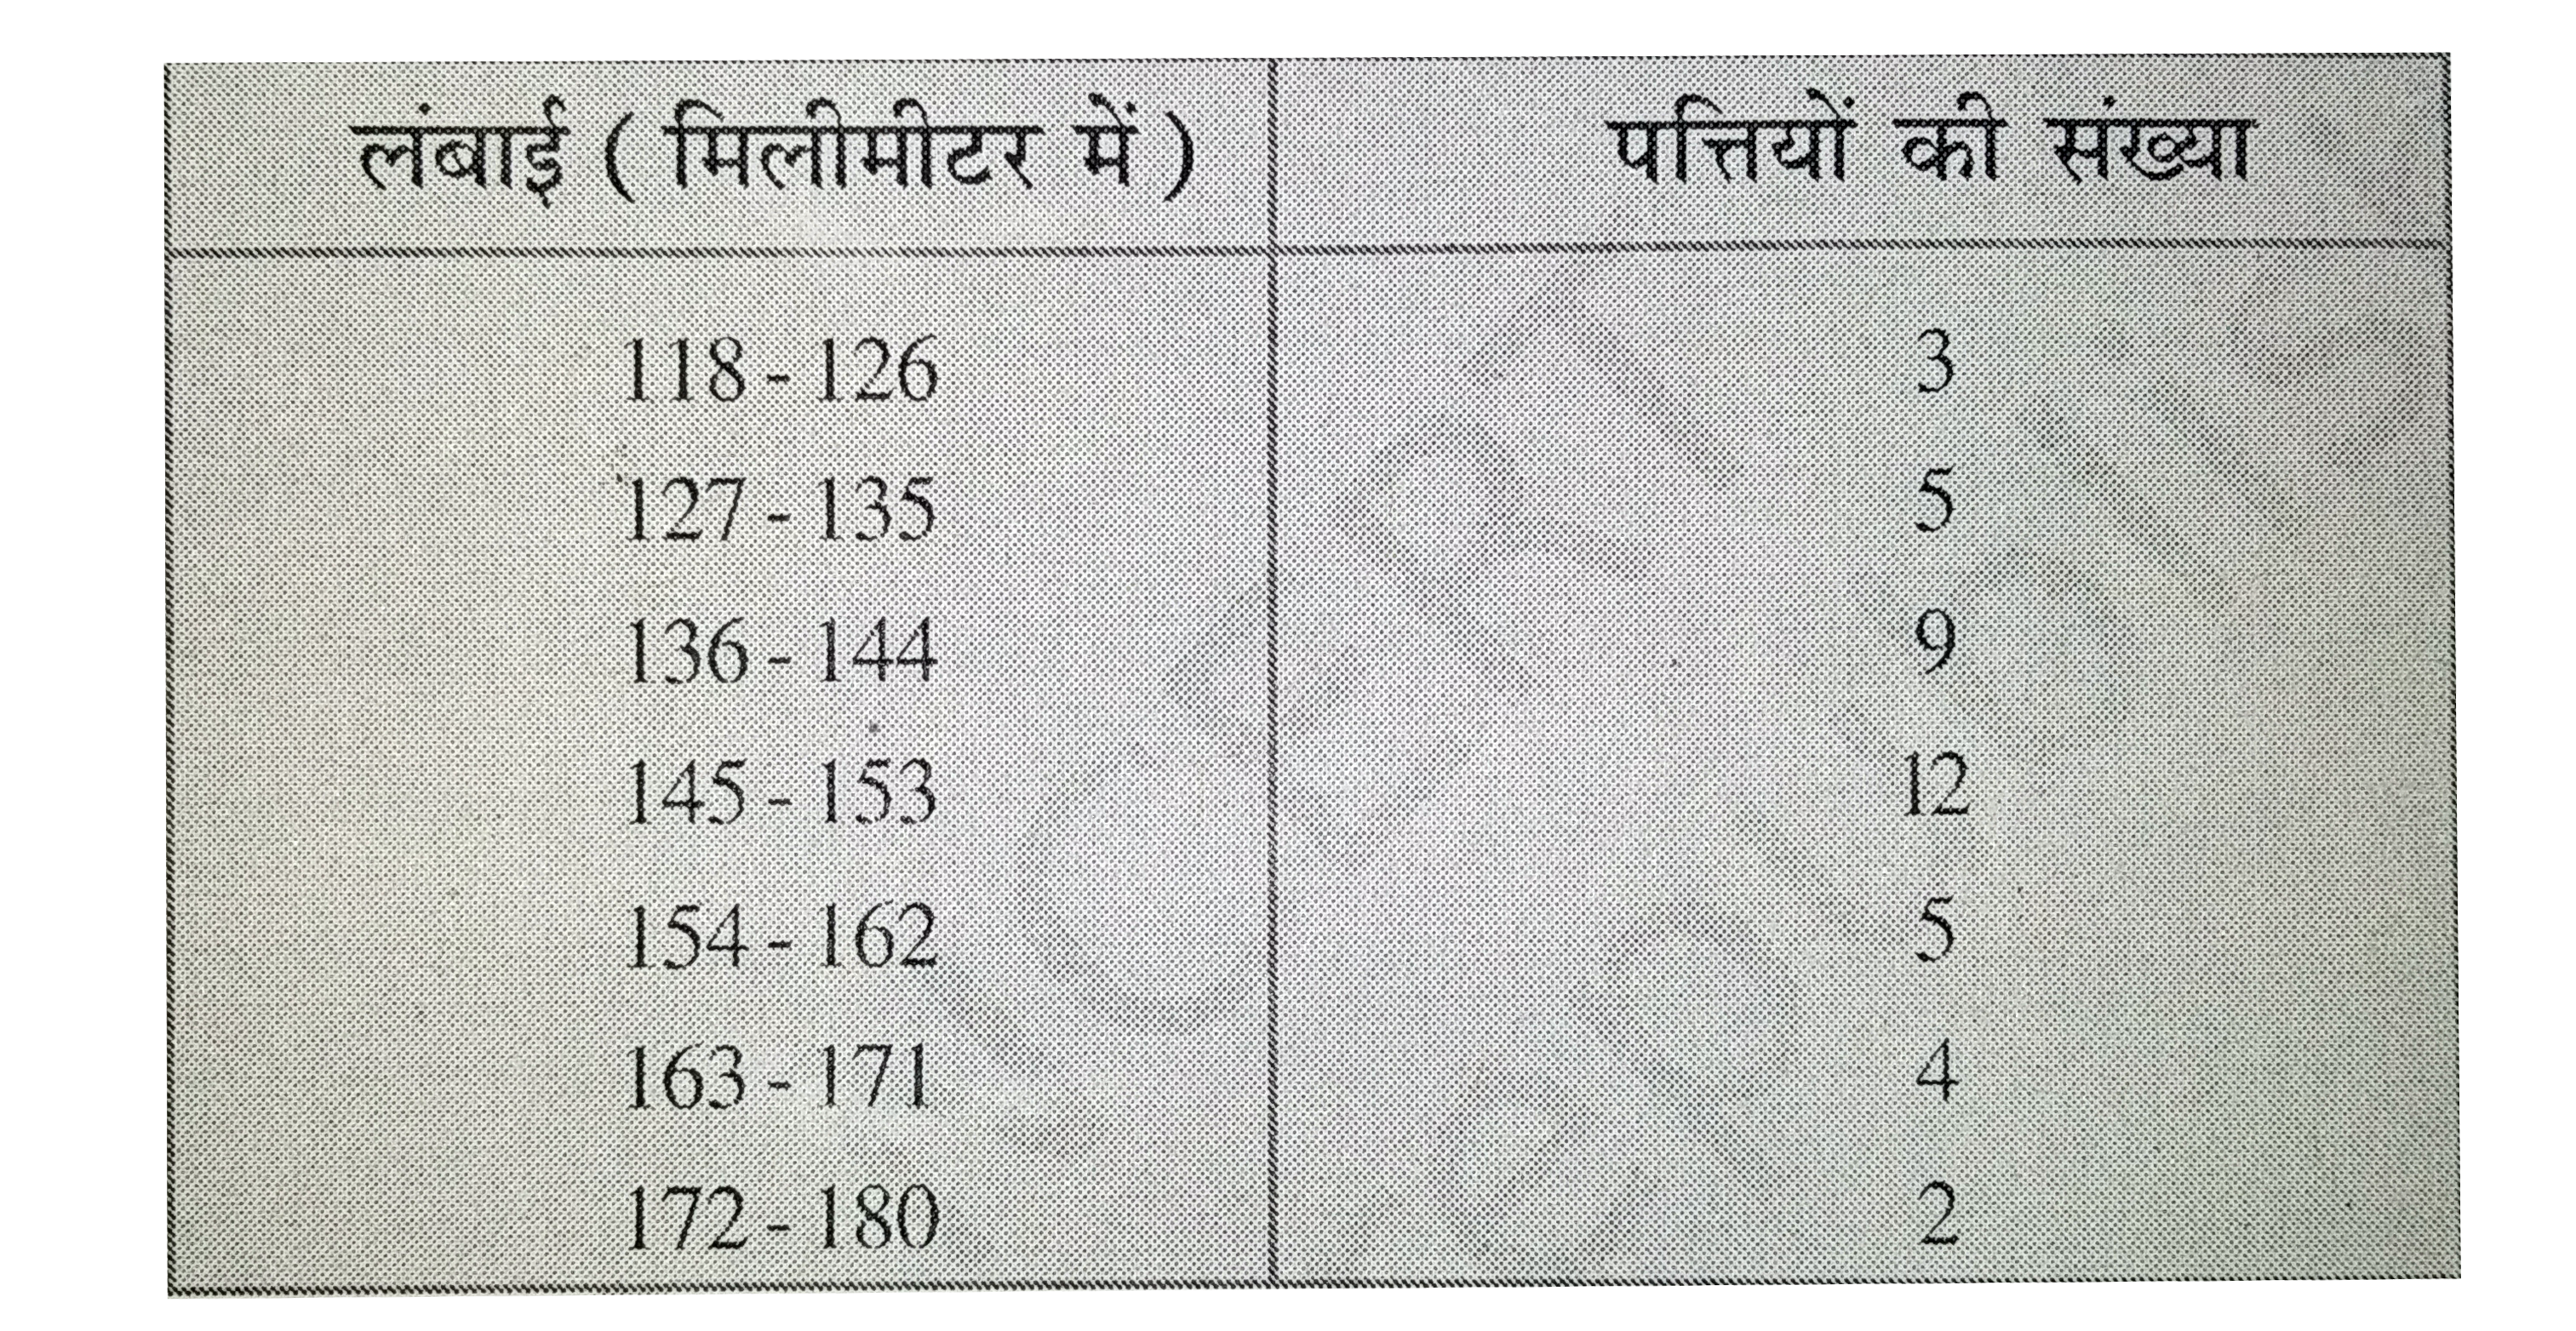
(i) दिए हुए आंकडों को निरूपित करने वाला एक आयतचित्र खीचिए।
(ii) क्या इन्हीं आंकडों को निरूपित करने वाला कोई अन्य उपयुक्त आलेख हैं।
(iii) क्या यह सही निष्कर्ष है कि 153 मिलीमीटर लम्बाई वाली पत्तियों की संख्या सबसे अधिक हैं। क्यों ?
View Solutionएक पौधे की 40 पत्तियों की लम्बाई निकलता मिलिमीटरो में मापी जाती है तथा प्राप्त आंकड़ों को निम्नलिखित सारणी के रूप में निरूपित किया जाता है :
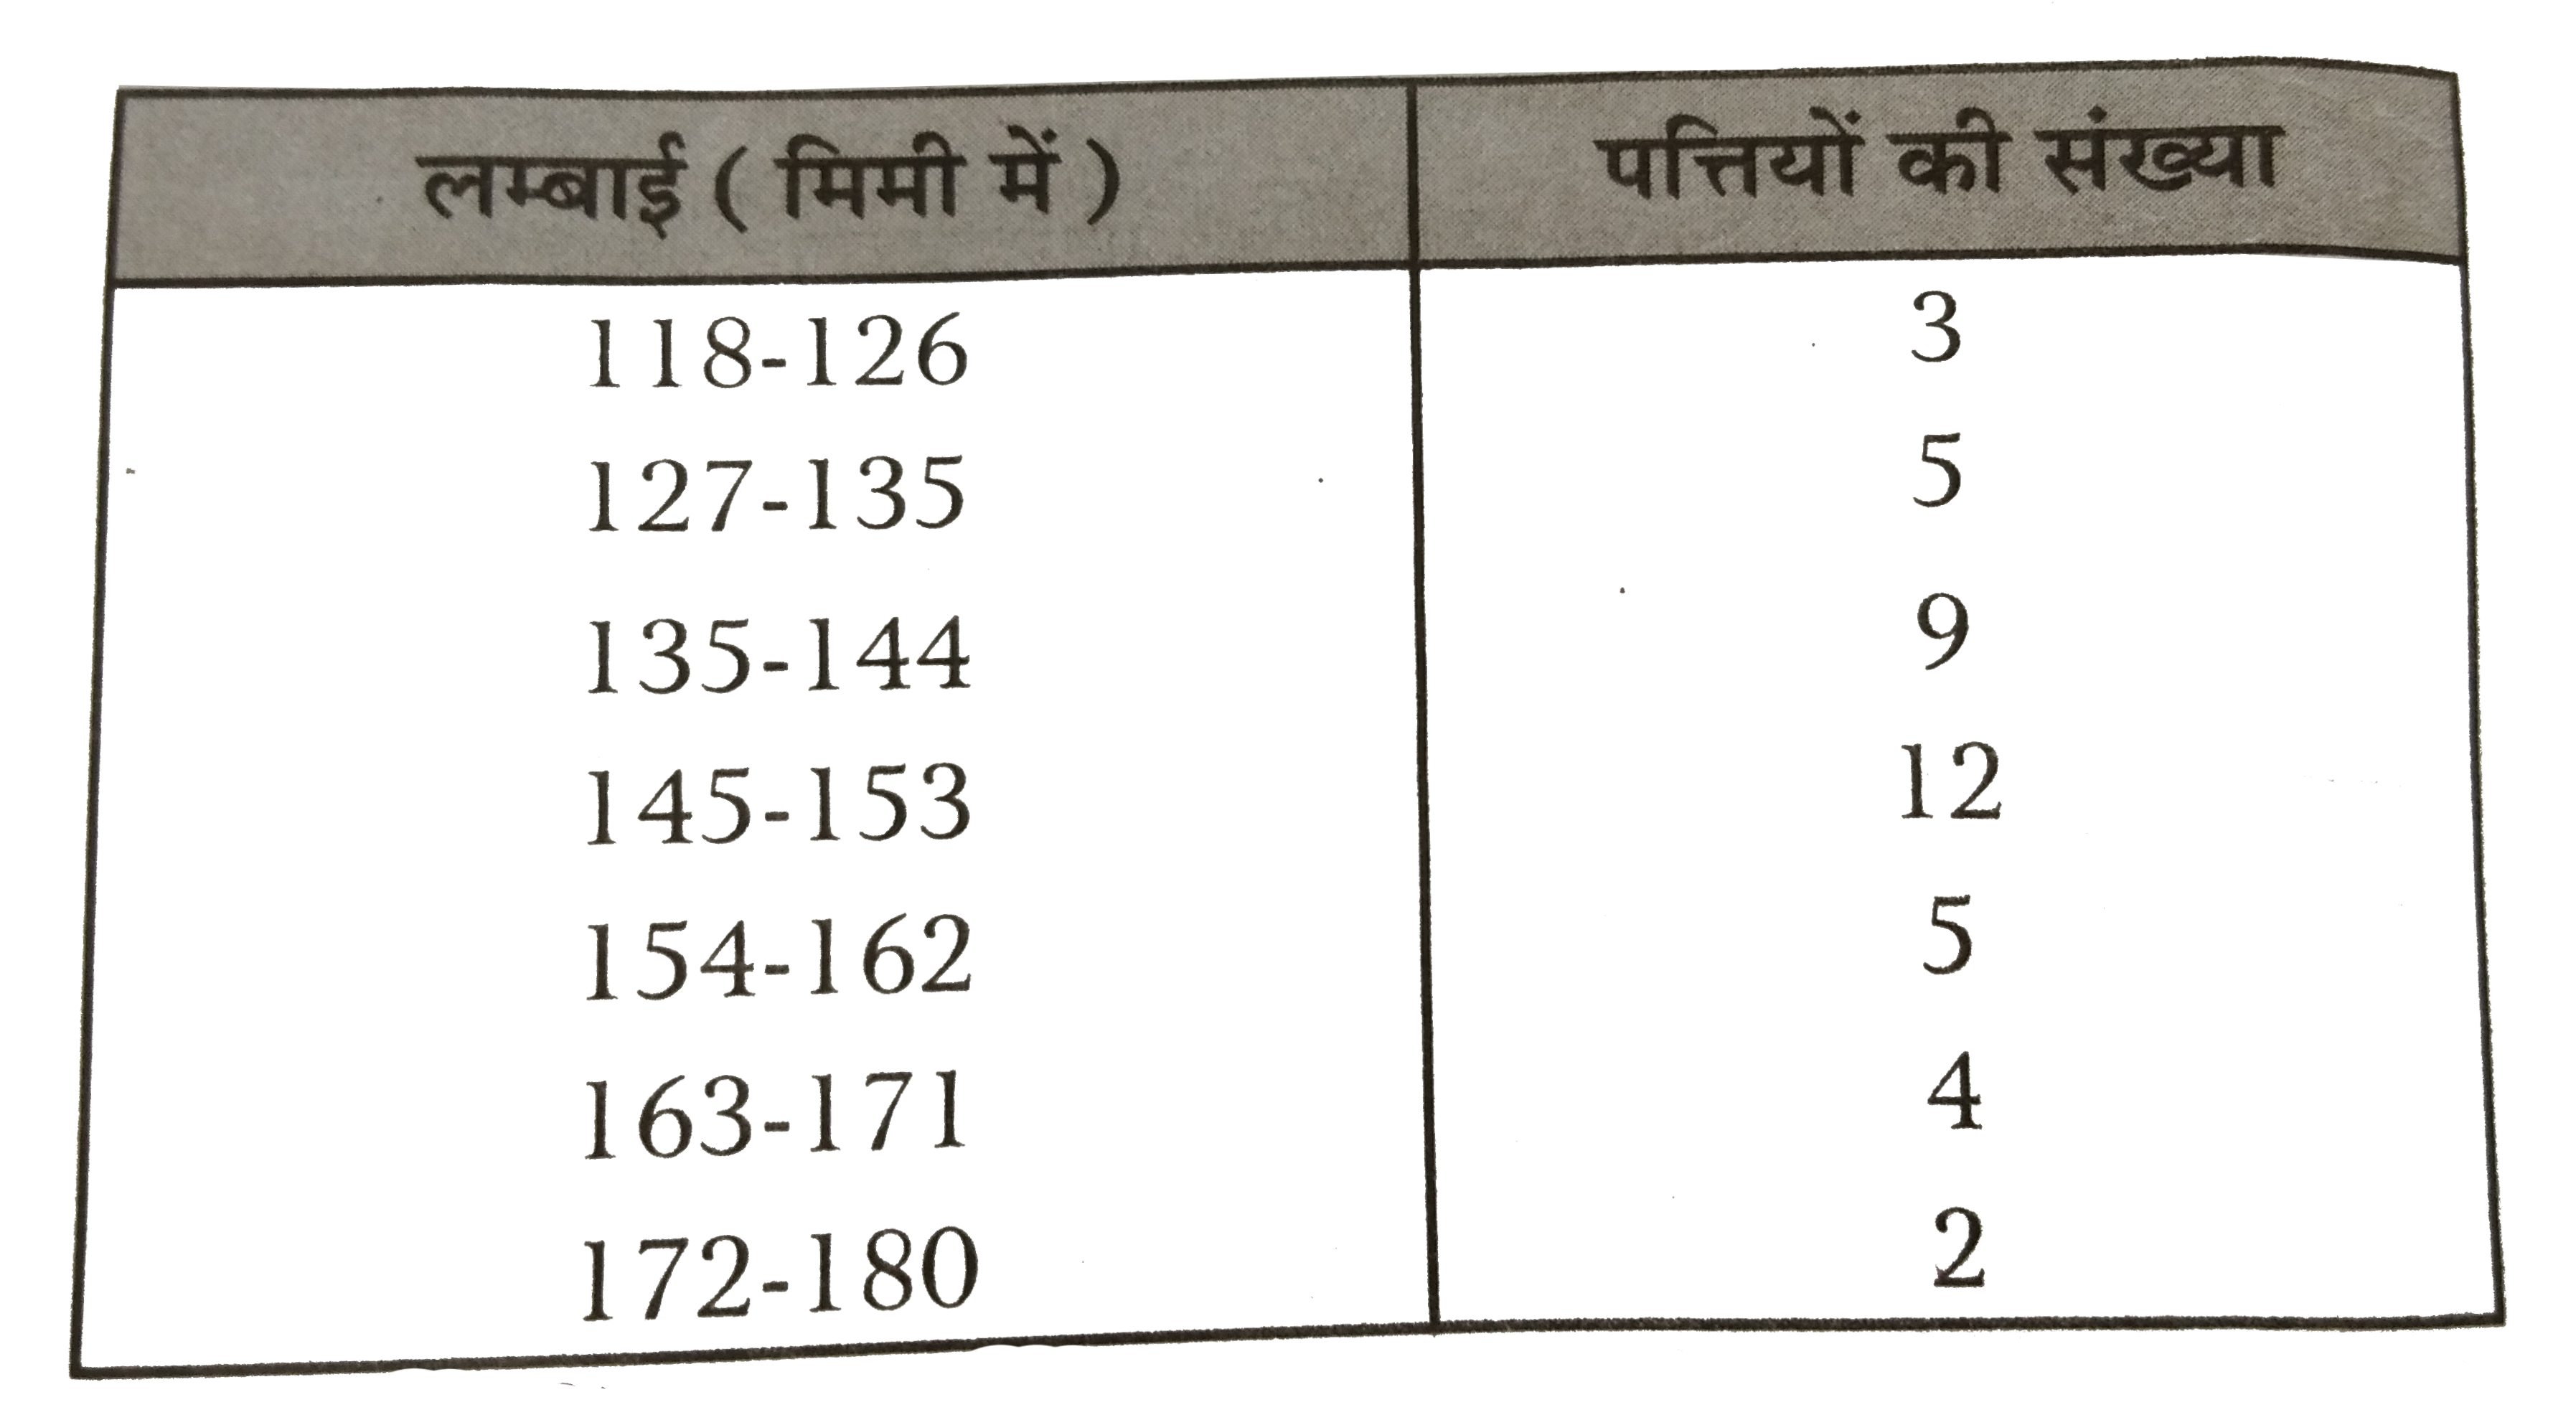
पत्तियों की माध्यक लम्बाई ज्ञात कीजिये
View Solutionएक पौधे की 40 पत्तियों की लंबाइयाँ एक मिलीमीटर तक शुद्ध मापी गई हैं और प्राप्त आँकड़ों को निम्नलिखित सारणी में निरूपित किया गया है :
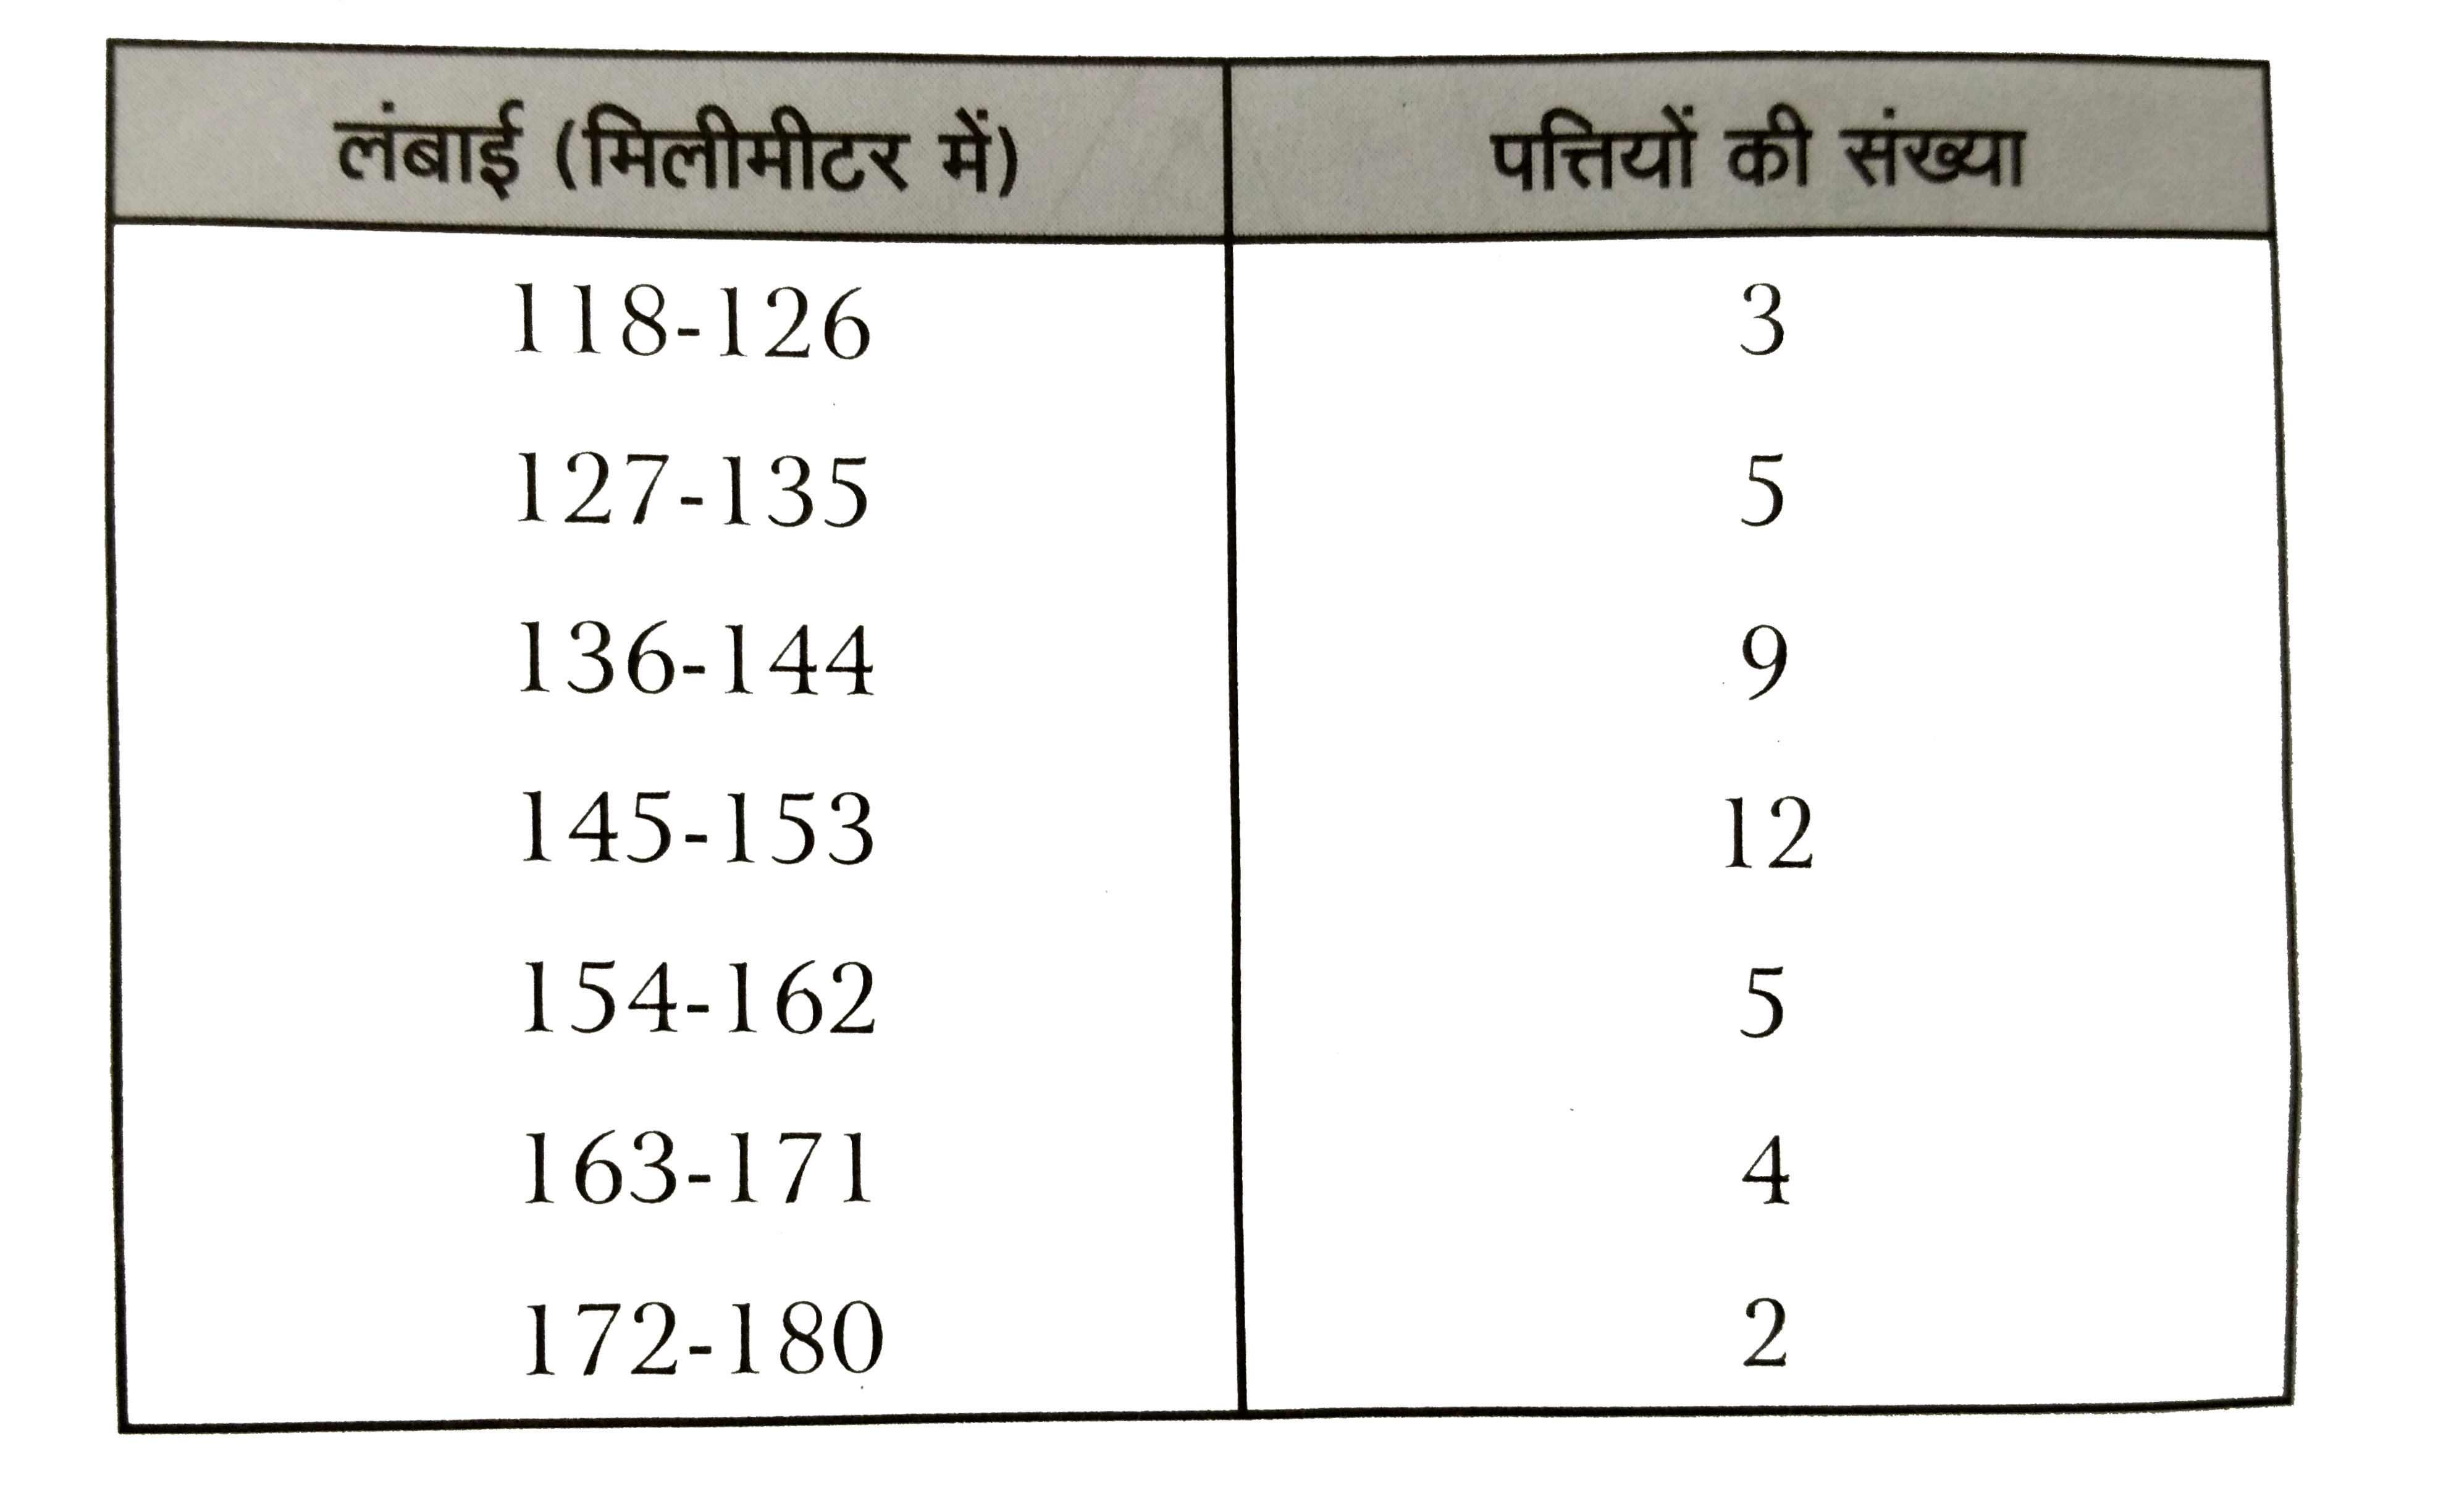
(i) दिए हुए आँकड़ों को निरूपित करने वाला एक आयतचित्र खींचिए।
(संकेत : पहले वर्ग अंतरालों को संतत बनाइए।)
(ii) क्या इन्हीं आँकड़ों को निरूपित करने वाला कोई अन्य उपयुक्त आलेख है?
(iii) क्या यह सही निष्कर्ष है कि 153 मिलीमीटर लम्बाई वाली पत्तियों की संख्या सबसे अधिक है? क्यों?
View SolutionThe length of 40 leaves of a plant are measured correct to one millimetre, and the obtained data is represented in the following table :
(ii) Is there any other graphical representation for the same data ?
View SolutionThe length of 40 leaves of a plant are measured correct to one millimetre, and the obtained data is represented in the following table :
(iii) Is it correct to conclude that the maximum number of leaves are 153 mm long ? Why ?
View SolutionThe lengths of 40 leaves of a plant are measured correct to the nearest millimeter and the data obtained is represented in the following table :
Find the median length of the leaves.
View SolutionThe length of 40 leaves of a plant are measured correct to one millimetre, and the obtained data is represented in the following table: (i) Draw a histogram to represent the given data.(ii) Is there any other suitable graphical representation for the same data?(iii) Is it correct to conclude that the maximum number of leaves are 153 mm long?Why?
View Solution100 surnames were randomly picked up from a local telephone directory and a frequency distribution of the number of letters in the English alphabet in the surnames was found as follows:
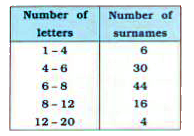
(i) Draw a histogram to depict the given information, (ii) Write the class interval in which the maximum number of surnames lie.
View SolutionThe length of 40 leaves of a plant are measured correct to one millimetre, and the obtained data is represented in the following table.
 : Draw a histogram to represent the given data.
View SolutionThe length of 40 leaves of a plant are measured correct to one millimetre, and the obtained data is represented in the following table.
 : Is there any other suitable graphical representation for the same data ?
View Solution
