The line graph shows the average hours per day spent by teenagers playing outdoor games. Study the diagram and answer the following questions.
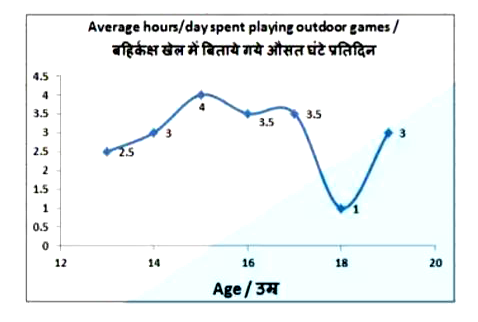
what is ratio of hours per day spend in playing outdoor games by 13 years olds and 18 years old
1:5
5:2
2:5
5:1
The correct Answer is:B
Step by step video, text & image solution for The line graph shows the average hours per day spent by teenagers playing outdoor games. Study the diagram and answer the following questions. what is ratio of hours per day spend in playing outdoor games by 13 years olds and 18 years old by Maths experts to help you in doubts & scoring excellent marks in Class 14 exams.
Updated on:21/07/2023Similar Questions
The line graph shows the exprots by a certain company. Study the diagram and answer the following questions.
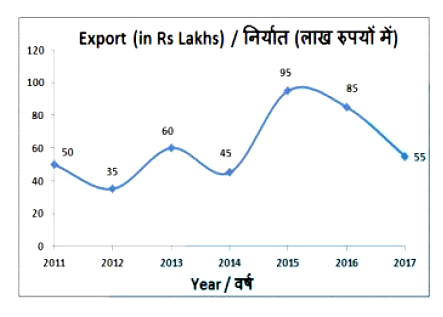
In which year were the exports greater than that of the previous year?
View SolutionThe line graph shows the Sales per employee of a certain company. Study the diagram and answer the following questions.
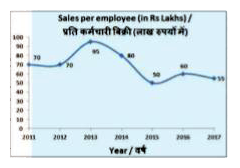
In which year were the Sales per employee greater than that of the previous year?
View Solution
Knowledge Check
The line graph shows the average hours per day spent by teenagers playing outdoor games. Study the diagram and answer the following questions.
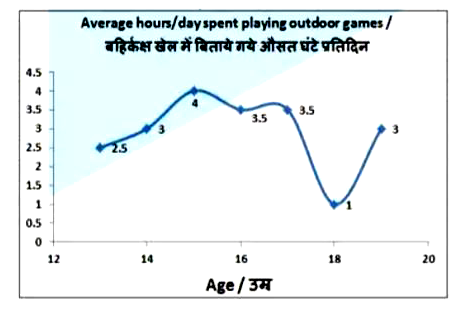
The number of hours per day spent in playing outdoor games is_______more by 17 year olds as compared to 14 year olds.A0.1428B0.1667C0.1265D0.1079The line graph shows the average hours per day spent by teenagers playing outdoor games. Study the diagram and answer the following questions.
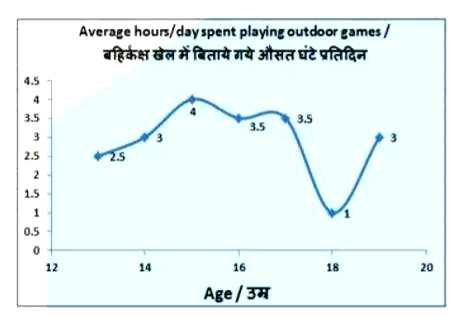
How many hours does a 16 year old spend playing outdoor games in a week?A24.5B25.5C24D25The line graph shows the average hours per day spent by teenagers watching TV. Study the diagram and answer the following questions.
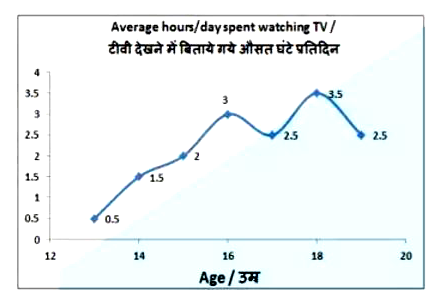
What is the ratio of hours per day spent in watching TV by 14 year olds and 18 year olds?A7:3B3:7C5:7D7:5
The line graph shows the average hours per day spent by teenagers watching TV. Study the diagram and answer the following questions.
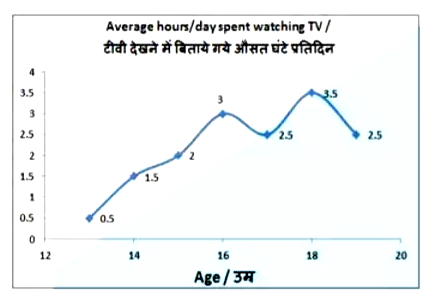
How many hours does a 16 year old spend watching TV in a week?
View SolutionThe line graph shows the average hours per day spent by teenagers watching TV. Study the diagram and answer the following questions.
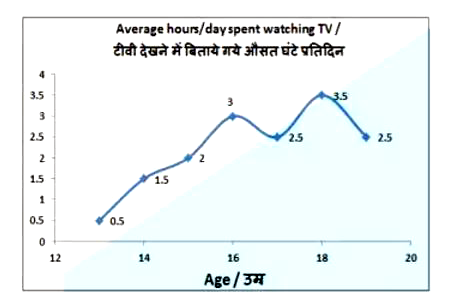
The number of hours per day spent in watching TV is ___________ more by 17 year olds as compared to 15 year olds.
View SolutionThe line graph shows the average hours per day spent by teenagers watching TV. Study the diagram and answer the following questions.
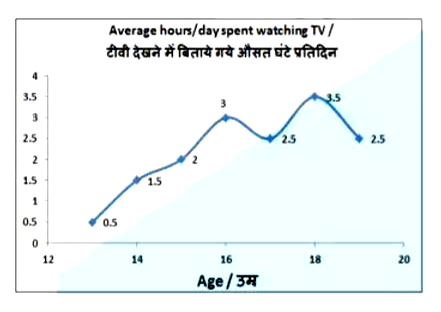
In which age do teenagers spend the least number of hours watching TV?
View SolutionStudy the graph and answer the following questions-
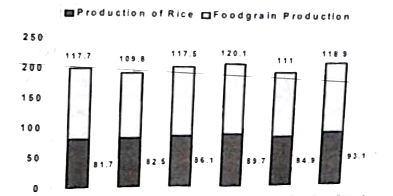
Over the given years what is average production of rice?
View SolutionThe line graph shows the production of steel of a certain country. Study the diagram and answer the following questions.
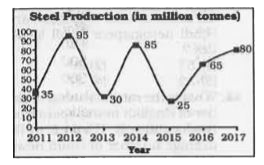
In which year was the steel production lesser than that of the previous year?
View Solution
