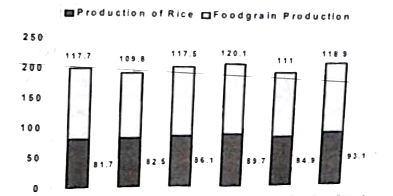
Study the graph and answer the following questions-

Over the given years what is average production of rice?
86.33 million tonnes
88.66 million tonnes
85 million tonnes
88 million tonnes
The correct Answer is:A
Step by step video, text & image solution for Study the graph and answer the following questions- Over the given years what is average production of rice? by Maths experts to help you in doubts & scoring excellent marks in Class 14 exams.
Updated on:21/07/2023Topper's Solved these Questions
Similar Questions
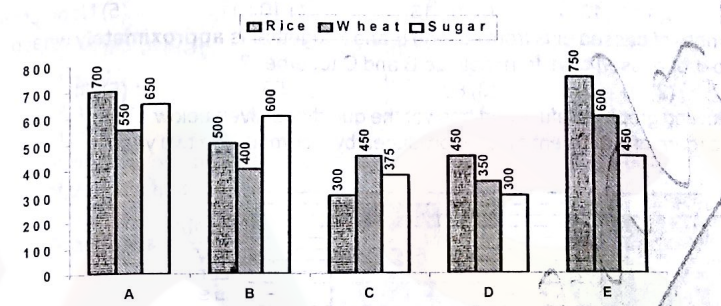
Study the following graph carefully and answer the question given below-
Amount of Rice, Wheat and Sugar Consumed by various restaurants over a years.

What is the respective ratio of the amount of Rice, Wheat and Sugar consumed by restaurant D to the same consumed by restaurant B ?
View SolutionIn one hour,a boat goes 11 km along the stream and 5 km against the stream. Then speed of the boat in still water (in km/hr) is :
View SolutionThe total of the present ages of A,B,C and D is 96 years. What is B's present age ?
(i) The average age of A, B and D is 20 years.
(ii) The average age of C and D is 25 years.
View SolutionWhich of the following are correct chain isomers of butane ? (i)
View SolutionDetermine the point of symmetry of a regular hexagon.
View SolutionDtermine the images of the following figure about the given line :
View SolutionMatch the following Column A to Column B

View SolutionMatch the following Column A to Column B

View SolutionMatch the following Column A to Column B

View SolutionFind the area of figure given below.

View SolutionFind the perimeter of the figure given below.

View SolutionFind the area of the figure given below.

View SolutionCalculate the volume of the given solid.
ltimg src="https://d10lpgp6xz60nq.cloudfront.net/physics_images/PS_MATH_VII_C06_E03_002_Q01.png" width="80%"gt
View SolutionThe area of the shaded part in the figure given below is ______.

View SolutionThe inequation represented by the graph given below is :
View SolutionThe inequation that best describes the graph given below is _________
View Solution
