The line graph shows the number of teddy bears Latika sold from January to April.

If she earned Rs 484 for every teddy bear sold, then how much more did she earn in April than in March ?
Rs 1480
Rs 5405
Rs 4840
Rs 484
The correct Answer is:C
Step by step video & image solution for The line graph shows the number of teddy bears Latika sold from January to April. If she earned Rs 484 for every teddy bear sold, then how much more did she earn in April than in March ? by Maths experts to help you in doubts & scoring excellent marks in Class 6 exams.
Topper's Solved these Questions
Similar Questions
Knowledge Check
- Question 1 - Select One
The Bar graph given below presents the number of books sold by a bookseller during different months of a year.
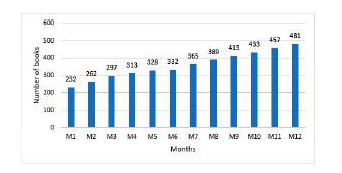
The number of books sold in month M8 is how much more than the average number of books sold per month?A34.5B22.5C30.5D26.5 - Question 2 - Select One
The line graph shows the number of candidates who applied for admission to a certain college. Study the diagram and answer the following questions.
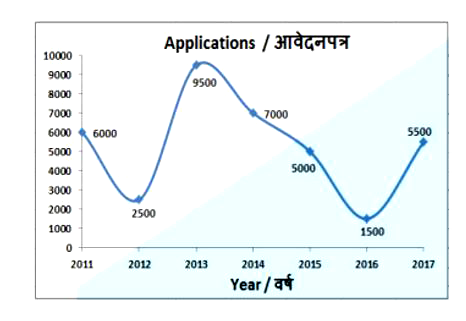
If each applicant has to submit Rs 500 as application fees how much did the college collect (in Rs lakhs) as application fees in the last three years?A6B50C60D5
The bar graph shows the number of cycles sold by a distributor in each month from January to June. Whatis the increase in the number of cycles sold in April as compared to March ?
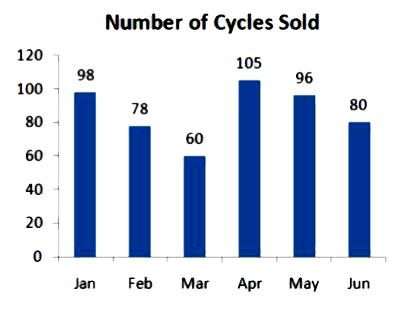 View Solution
The bar graph shows the number of cycles sold by a distributor in each month from January to June. Whatis the increase in the number of cycles sold in April as compared to March?
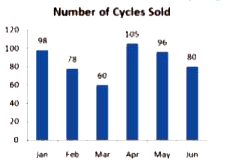 View Solution
The bar graph shows the number of paintings sold by an art gallery in each month from January to June. How many paintings does it need to sell in July for the 7 month average to be 90?
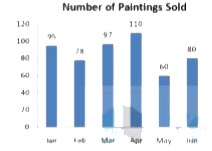 View Solution
Kajol has Rs 75. This is 38 of the amount she earned. How much did she earn?
View SolutionDirection: The given bar graph shows the number of pens sold by two shops A & B in four consecutive months. Study the following data and answer the following questions:
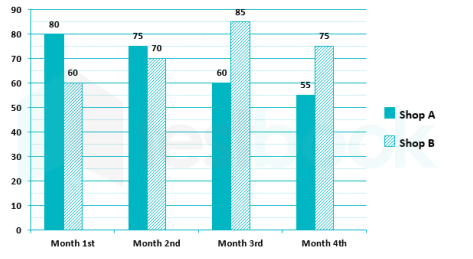
Find that the number of pens sold by shop A in 1st month is how much percent more than the number of pens sold by shop A in 3rd month.View SolutionEggs sold by a shopkeeper over a week is given in the table below.
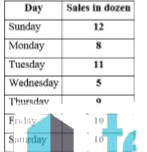
If the price of one egg was Rs. 2.50, how much more did he earn on
Friday than on Monday?
A. 25 rupees
B. 2.50 rupees
C. 5.00 rupees
D. 3.25 rupees.View Solution

