The bar graph shows the number of paintings sold by an art gallery in each month from January to June. How many paintings does it need to sell in July for the 7 month average to be 90?
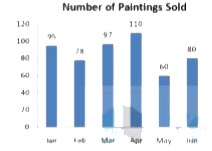
115
85
90
110
The correct Answer is:D
Step by step video & image solution for The bar graph shows the number of paintings sold by an art gallery in each month from January to June. How many paintings does it need to sell in July for the 7 month average to be 90? by Maths experts to help you in doubts & scoring excellent marks in Class 14 exams.
Updated on:21/07/2023Similar Questions
The bar graph shows the number of cycles sold by a distributor in each month from January to June. Whatis the increase in the number of cycles sold in April as compared to March?
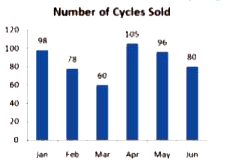
View SolutionThe bar graph shows the number of cycles sold by a distributor in each month from January to June. Whatis the increase in the number of cycles sold in April as compared to March ?
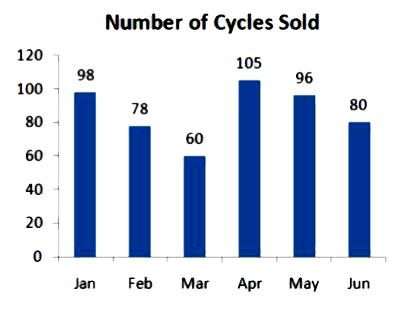
View SolutionThe bar graph shows the number of cycles sold by a distributor in each month from January to June. Whatis the increase in the number of cycles sold in April as compared to March ?

View SolutionThe bar graph shows the number of cars of different brands sold by a dealer in a month, Study the diagram and answer the following question.
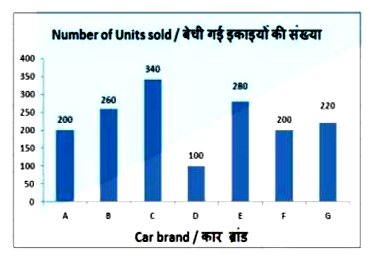
If the average price of a car sold by the dealer is Rs 5 lakhs then what is the sales (in Rs lakhs) of all the cars sold by the dealer in the month?
View SolutionThe bar graph shows the number of motorcycles of different brands sold by dealer in a month . Study the diagram and answer the following questions.
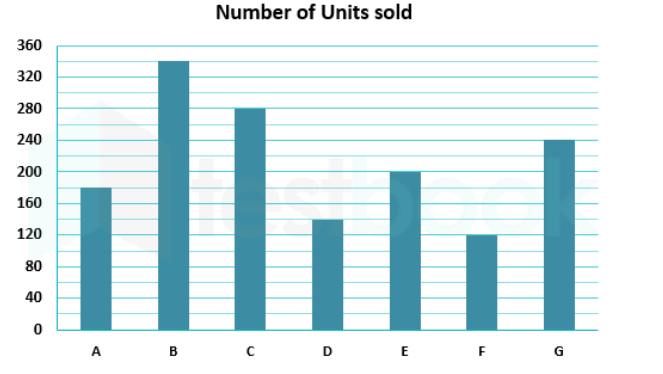
If the average price of a Motorcycle sold by the dealer is Rs 1 lakh then what is the sales (in Rs lakhs) of all the motorcycles sold by the dealer in the month?
View SolutionThe given bar graph shows the number of cars sold from Jan to Dec.
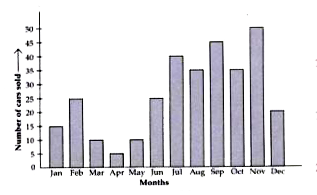
How many cars were sold in the last quarter of the year?
View SolutionThe bar graph shows the number of cars of different brands sold by a dealer in a month. Study the diagram and answer the following question.
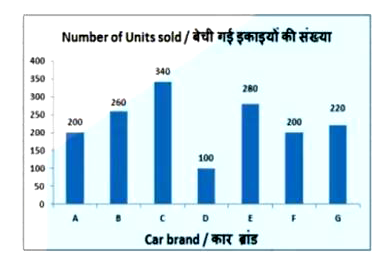
What is the ratio of units sold of brand G to that of brand E?
View SolutionThe bar graph shows the number of cars of different brands sold by a dealer in a month. Study the diagram and answer the following question.
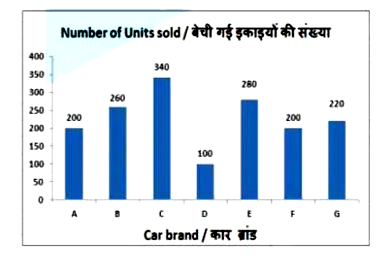
Units sold of which car brand were the second highest?
View SolutionThe bar graph shows the number of motorcycles of different brands sold by a dealer in a month . Study the diagram and answer the following questions .

What is the ratio of units sold of brand A to that of brand C?
View SolutionThe given bar graph shows the sale of different brands of shirts in a shop in one month.
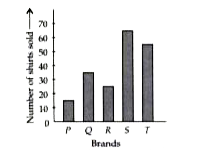
(i) How many total shirts are sold in the month ?
View Solution
