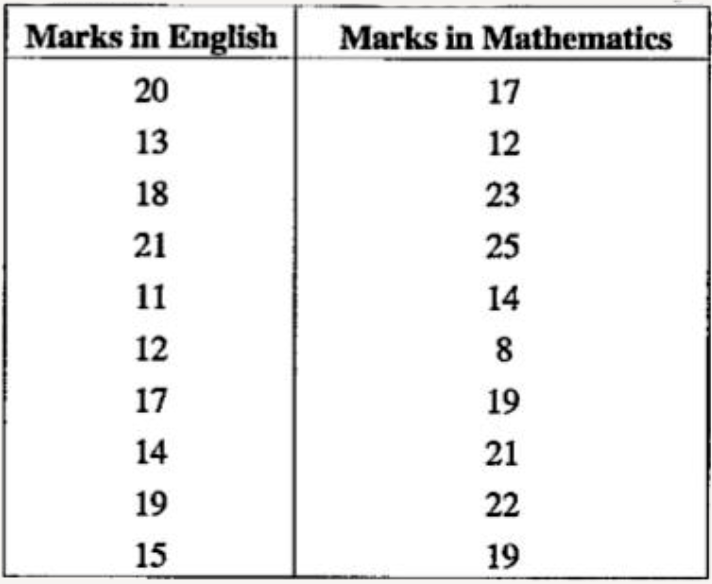
The marks of 8 students in an examination in Statistics and Mathematics are given below

Find Spearman's rank Correlation coefficient.
The correct Answer is:0.29
Step by step video & image solution for The marks of 8 students in an examination in Statistics and Mathematics are given below Find Spearman's rank Correlation coefficient. by Maths experts to help you in doubts & scoring excellent marks in Class 11 exams.
Updated on:21/07/2023Topper's Solved these Questions
Similar Questions
Heights (in cm) of a sample of 12 fathers and their oldest sons are given below :

Find Karl Pearson's correlation coefficient.
View SolutionThe final positions of twelve clubs in a football league and the average arttandeances at their home matches were as follows:

Find Spearman's rank correlation coefficient and comment on your result.
View SolutionIn a contest the competitors are awarded marks out of 20 by two judges .The scores of the 10 competitors are given below .Calculate Spearman 's rank correlation .

View SolutionCalculate Spearman 's rank correlation for the following data :

View SolutionThe following table shown the mean and standard deviation of the marks of Mathematics and Physics scored by the students in a school :

The correlation coefficient between the given marks is 0.86 . Estimate the likely marks in Physics if the marks in Mathematics are 92.
View SolutionFind out rank correlation form the following data:

View SolutionThe marks obtained by 10 candidates in English and Mathematics are given below:

Estimate the probable score for Mathematics if the marks obtained in English are 24.
View SolutionThe marks obtained by a student in his annual examination in various subjects are given below:
SubjectHindiMathematicsEnglishScienceS.StudiesMarks obtained6440528036
Represent the above data by a bar graph.
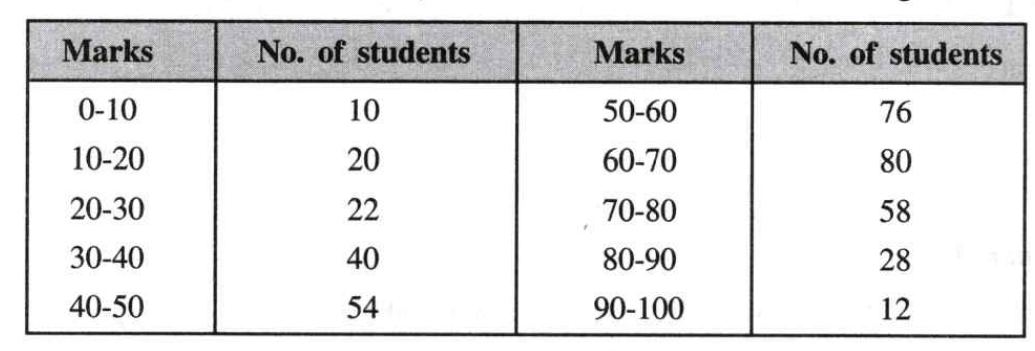
View SolutionThe marks obtained (out of 100) by 400 students in an examination are given below:

Using a graph paper, draw an ogive for the above distribution. Use ogive to estimate the following: estimate the number of students who obtained more than 80% marks in the examination.
View SolutionThe marks obtained (out of 100) by 400 students in an examination are given below:

Using a graph paper, draw an ogive for the above distribution. Use ogive to estimate:
the number of students who did not pass if the pass percentage was 35.
View Solution
