The marks obtained by a student in his annual examination in various subjects are given below:
SubjectHindiMathematicsEnglishScienceS.StudiesMarks obtained6440528036
Represent the above data by a bar graph.
To represent the marks obtained by a student in various subjects using a bar graph, we will follow these steps:
1. Identify the Data:
The marks obtained by the student in different subjects are:
- Hindi: 64
- Mathematics: 40
- English: 52
- Science: 80
- Social Studies: 36
2. Set Up the Axes:
- Draw two perpendicular lines to create the X-axis (horizontal) and Y-axis (vertical).
- Label the X-axis with the subjects: Hindi, Mathematics, English, Science, and Social Studies.
- Label the Y-axis with the marks obtained. Since the highest mark is 80, we can use a scale where 1 cm represents 10 marks.
3. Determine the Scale:
- Since the maximum marks are 80, we can mark the Y-axis from 0 to 80 in increments of 10. This means we will have marks at 0, 10, 20, 30, 40, 50, 60, 70, and 80.
4. Draw the Bars:
- For each subject, draw a bar that corresponds to the marks obtained:
- Hindi: Draw a bar that reaches up to 64 marks (6.4 cm).
- Mathematics: Draw a bar that reaches up to 40 marks (4 cm).
- English: Draw a bar that reaches up to 52 marks (5.2 cm).
- Science: Draw a bar that reaches up to 80 marks (8 cm).
- Social Studies: Draw a bar that reaches up to 36 marks (3.6 cm).
5. Label the Bars:
- At the top of each bar, write the respective marks obtained for clarity.
6. Final Review:
- Ensure that all bars are of equal width and properly aligned with their respective subjects on the X-axis.
- Check that the heights of the bars accurately represent the marks obtained.
The marks obtained by the student in different subjects are:
- Hindi: 64
- Mathematics: 40
- English: 52
- Science: 80
- Social Studies: 36
- Draw two perpendicular lines to create the X-axis (horizontal) and Y-axis (vertical).
- Label the X-axis with the subjects: Hindi, Mathematics, English, Science, and Social Studies.
- Label the Y-axis with the marks obtained. Since the highest mark is 80, we can use a scale where 1 cm represents 10 marks.
- Since the maximum marks are 80, we can mark the Y-axis from 0 to 80 in increments of 10. This means we will have marks at 0, 10, 20, 30, 40, 50, 60, 70, and 80.
- For each subject, draw a bar that corresponds to the marks obtained:
- Hindi: Draw a bar that reaches up to 64 marks (6.4 cm).
- Mathematics: Draw a bar that reaches up to 40 marks (4 cm).
- English: Draw a bar that reaches up to 52 marks (5.2 cm).
- Science: Draw a bar that reaches up to 80 marks (8 cm).
- Social Studies: Draw a bar that reaches up to 36 marks (3.6 cm).
- At the top of each bar, write the respective marks obtained for clarity.
- Ensure that all bars are of equal width and properly aligned with their respective subjects on the X-axis.
- Check that the heights of the bars accurately represent the marks obtained.
Topper's Solved these Questions
Similar Questions
The percentage of marks obtained by a student in different subjects are given below.
SubjectHindiScienceEnglishMathematicsSocial StudiesPercentage of3560157540marks obtained
Draw a bar graph representing the above data.
View SolutionThe marks obtained by 12 students in an examination (out of 50) are given below:
18, 35, 2, 27, 40, 0, 21, 33, 27, 8, 36, 23
Find the mean marks.
View SolutionThe marks obtained by 30 students in a class assessment of 5 subjects is given below :

Calculate the mean, median and mode of the above distribution.
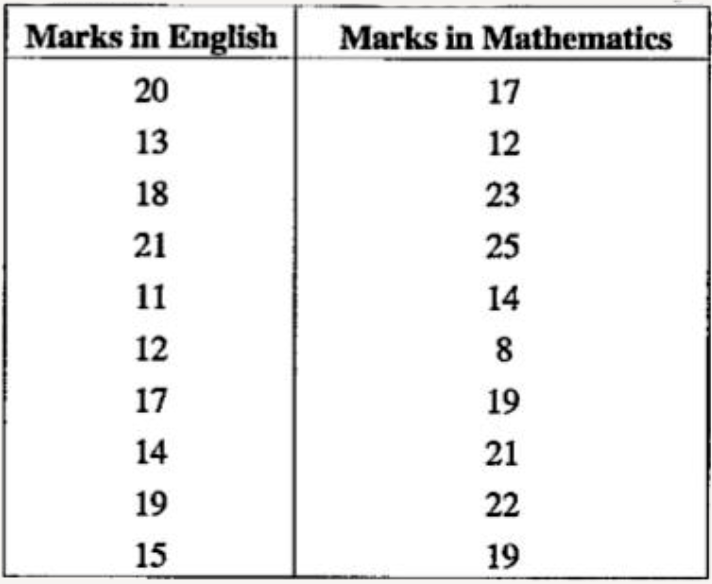
View SolutionThe marks obtained by 10 candidates in English and Mathematics are given below:

Estimate the probable score for Mathematics if the marks obtained in English are 24.
View SolutionThe marks obtained by 32 students of a class are given below. Prepare a frequency table with class intervals 31−40,41−50,….. etc.

View SolutionThe marks obtained (out of 100) by a class of 80 students are given below:

Construct a histogram to represent the data above
View SolutionObserve this bar graph which shows the marks obtained by Aziz in half-yearly examination in different subjects.
View SolutionThe percentage of marks obtained, in different subjects by Ashok Sharma (in an examination) are given below. Draw a bar graph to represent it.

View SolutionThe mean and standard deviation of marks obtained by 50 students of a class in there subjects, mathematics, physics and chemistry are given below: Subject Mathematics Physics Chemistry Mean 42 32 40.9 Standard Deviation 12 15 20 Which of the three subjects shows the highest variability in marks and which shows the lowest?
View SolutionThe frequency distribution of marks obtained by 28 students in a test carrying 40 marks is given below:
Marks:0−1010−2020−3030−40Number of students:6xy6
If the mean of the above data is 20, then the difference between x and y is
View Solution
