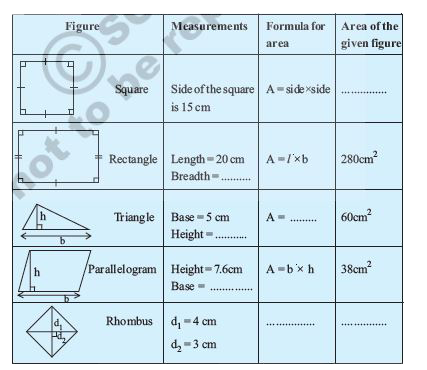
The measurements of some plane figures are given in the table below. However, they are incomplete. Find the missing information
 Solution in Telugu
Step by step video & image solution for The measurements of some plane figures are given in the table below. However, they are incomplete. Find the missing information by Maths experts to help you in doubts & scoring excellent marks in Class 8 exams.
Updated on:21/07/2023Topper's Solved these Questions
- AREA OF PLANE -FIGURES BOOK - VGS PUBLICATION-BRILLIANTCHAPTER - AREA OF PLANE -FIGURES EXERCISE - EXERCISE
112 Videos
- ALGEBRAIC EXPRESSIONSBOOK - VGS PUBLICATION-BRILLIANTCHAPTER - ALGEBRAIC EXPRESSIONSEXERCISE - EXERCISE
168 Videos
- COMPARING QUANTITIES USING PROPORTIONBOOK - VGS PUBLICATION-BRILLIANTCHAPTER - COMPARING QUANTITIES USING PROPORTIONEXERCISE - EXAMPLE
24 Videos
Similar Questions
We know that parallelogram is also a quadrilateral. Let us split such quadrilateral into two triangles. Find their areas and subsequently that of the parallelogram. Does this process in turn with the formula that you already know?
View SolutionFind the product of 5x, 6y and 7z.
View SolutionA cycle is marked at ₹3600 and sold for ₹3312. What is the discount and discount percentage?
View SolutionHow many lines of symmetry does the above figure have ?
View SolutionDetermine the point of symmetry of a regular hexagon.
View SolutionDtermine the images of the following figure about the given line :
View SolutionMatch the following Column A to Column B

View SolutionMatch the following Column A to Column B

View SolutionMatch the following Column A to Column B

View SolutionFind the area of figure given below.

View SolutionFind the perimeter of the figure given below.

View SolutionFind the area of the figure given below.

View SolutionThe area of the shaded part in the figure given below is ______.

View SolutionThe inequation represented by the graph given below is :
View SolutionThe inequation that best describes the graph given below is _________
View SolutionThe inequation that best describes the following graph is _________
View Solution