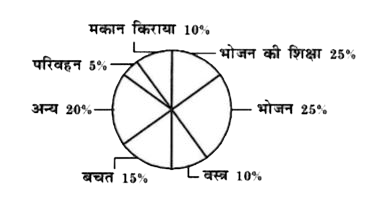
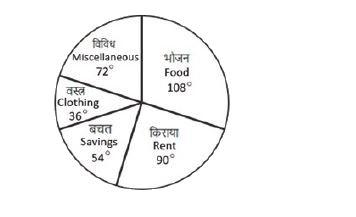
The monthly expenditure of a family on different items is given in the following table. Calculate the related central angles.
The correct Answer is:(##TRGMATX_P1C06E05007_A01##)
Topper's Solved these Questions
- BOOK - TARGET PUBLICATIONCHAPTER - STATISTICSEXERCISE - Practise Set 6.16videos
STATISTICS
- BOOK - TARGET PUBLICATIONCHAPTER - STATISTICSEXERCISE - Practise Set 6.24videos
STATISTICS
- BOOK - TARGET PUBLICATIONCHAPTER - STATISTICSEXERCISE - Apply your knowledge5videos
STATISTICS
- BOOK - TARGET PUBLICATIONCHAPTER - SIMILARITY EXERCISE - Chapter Assessment19videos
SIMILARITY
- BOOK - TARGET PUBLICATIONCHAPTER - TRIGONOMETRY EXERCISE - Chapter Assessment18videos
TRIGONOMETRY
Similar Questions
The following pie-chart shows the monthly expenditure of a family on food, clothing, rent, miscellaneous expenses and savings. What is the central angle for savings?
 View Solution
The following table shows the monthly expenditure of different families on different items :

Represent the data in the form of a sub-divided bar diagram.View Solution
Knowledge Check
- Question 1 - Select One
The following pie - chart shows the monthly expenditure of a family on food, clothing, rent, miscellaneous expenses and savings. What is the central angle for savings ?
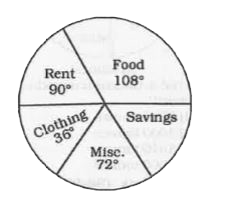 A54∘B56∘C50∘D52∘
 - Question 2 - Select One
The Gupta family spends their monthly income on different heads as shown in the following pie chart.
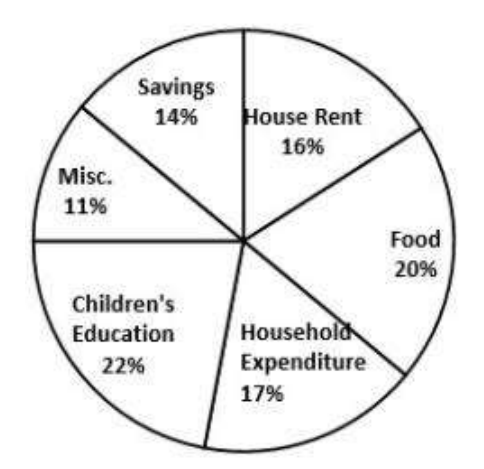
What is the central angle of the combined section for House Rent and Savings?A30∘B100∘C90∘D108∘ - Question 3 - Select One
The pie chart given here represents the domestic expenditure of a family in per cent. Study the chart and answer the following questions if the total monthly income of the family is Rs 33,650.
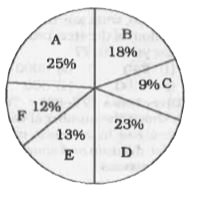
A : Expenditure on food
B : Expenditure on house-rent
C : Expenditure on entertainment
D : Expenditure on education and maintenance of children
E : Medical and miscellaneous expenditure
F : Deductions towards provident fund
After provident fund deductions and payement of house rent, the total monthly oncome of the family remainsARs 23,545BRs 24,435CRs 23,555DRs 25,355
The following pie-chart shows the monthly expenditure incurred by a family on various items , and their , and their savings . Study the chart and answer the question that follows.
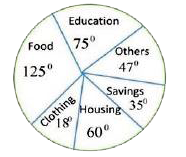
If the expenditure on education is ₹ 2,700 more than on housing , then the total expenditure on food and clothing is :View SolutionThe following pie-chart shows the monthly expenditure of a family on food, house rent clothing, education, fuel and miscellaneous Study the pie-chart
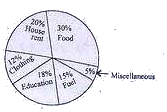
The central angle of the sector for the expenditure on fuel (in degrees) isView SolutionThe following pie-chart shows the monthly expenditure of a family on various items. If the family spends Rs. 825 on clothing, answer the question
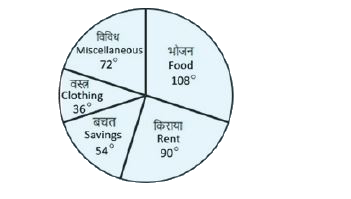
What is the total monthly income of the family?View SolutionThe following pie-chart shows the monthly expenditure of a family on various items. If the family spends Rs. 825 on clothing, answer the question
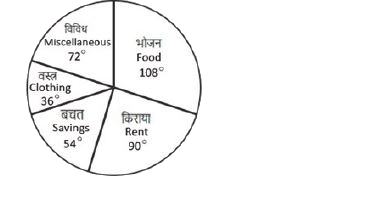
What percent of the total income does the family save ?View SolutionThe following pie-chart shows the monthly expenditure of a family on various items. If the family spends Rs. 825 on clothing, answer the question
What is the average of expenses on clothing and rent?View Solution

