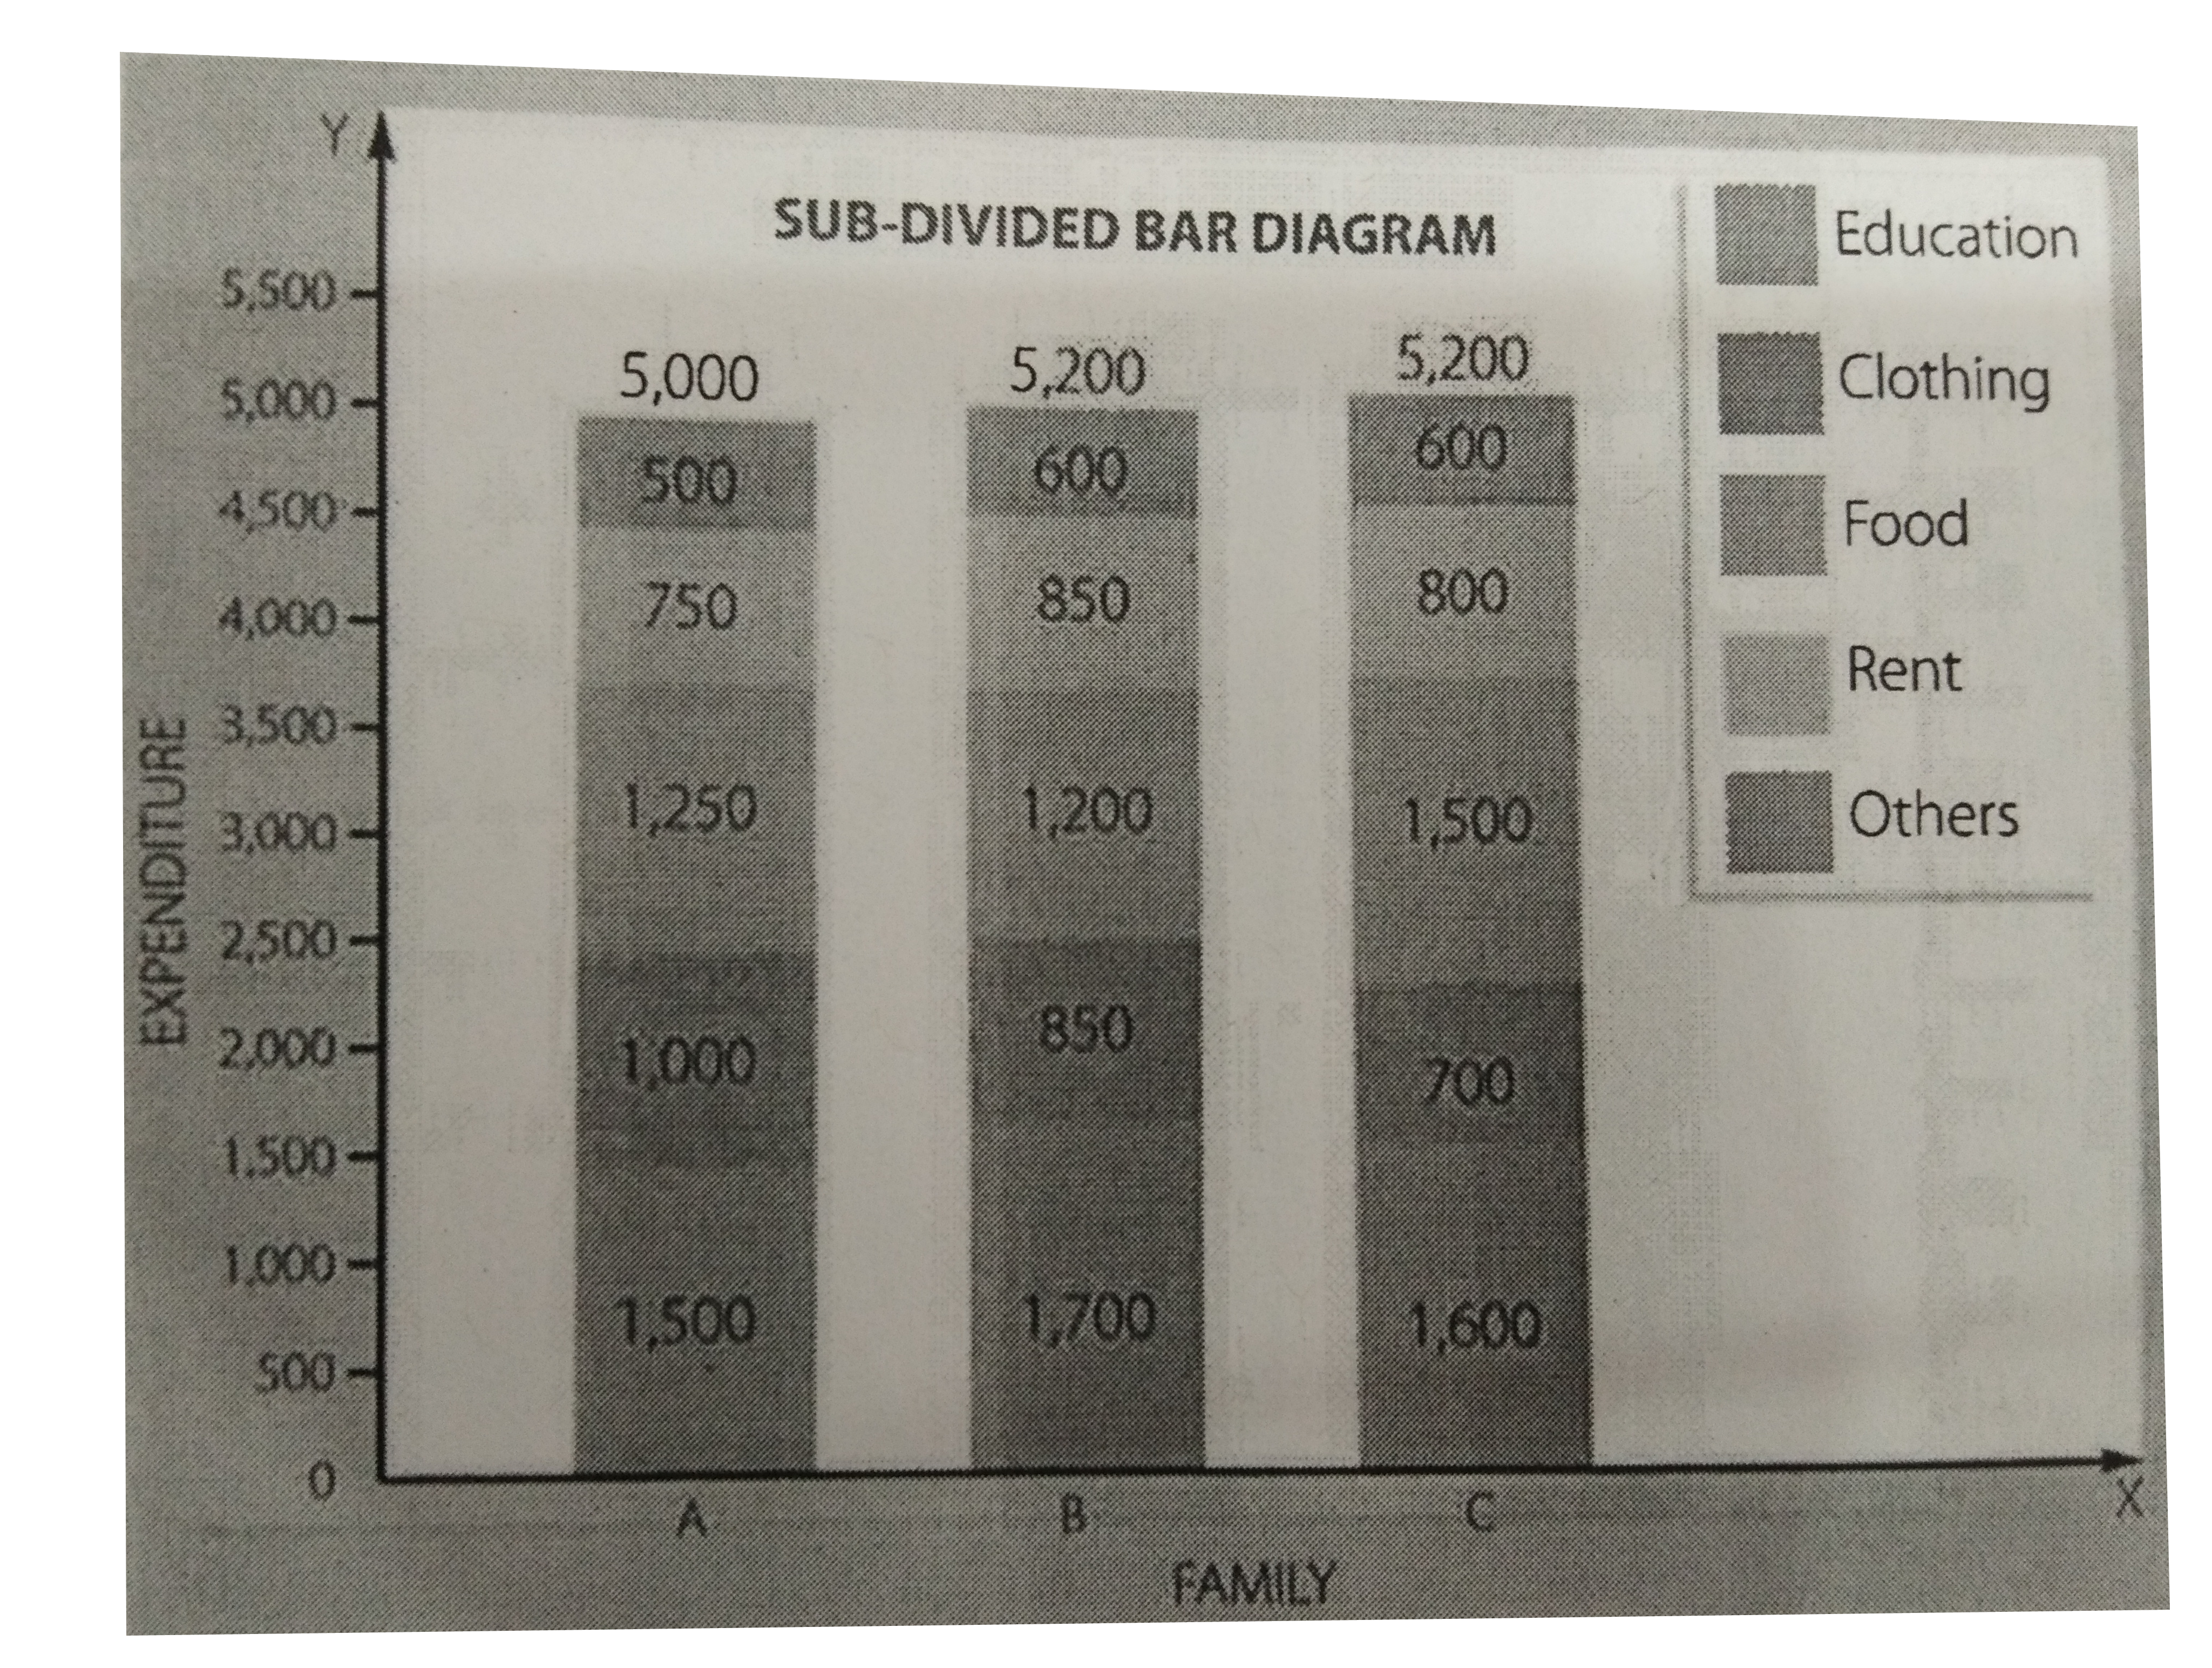
The following table shows the monthly expenditure of different families on different items :

Represent the data in the form of a sub-divided bar diagram.
Similar Questions
Following table shows the monthly expenditure of Imran’s familyon various items.
View SolutionWhat does sub-divided bar diagram show ?
View SolutionThe following table shows the interest of students of a school in different games :

Represent the data by using a simple bar diagram.
View SolutionThe following table shows the expenditure of a family whose monthly income is * 22,000.Represent the above data by a pie chart.
View SolutionPresent the following data in the form of horizontal bar diagram :

View SolutionThe following data shows the expenditure of a person on different items during a month. Represent the data by a pie-chart. Items of expenditure, Rent, Education, Food, Clothing, Others Amount (in Rs.), 2700, 1800, 2400, 1500, 2400
View SolutionFollowing tables shows estimates of cost of production of certain commodities. Present the data in the form of sub divided bar diagram:

View SolutionThe following table shows the household expenditure of family on different items. Draw a pie chart to represent the given data.
ItemRentFoodClotingEducationOthersExpenditure25%30%10%15%20%
View SolutionRepresent the following data, using a percentage bar diagram :

View SolutionThe following table shows the percentage of buyers of four different brands of bathing soaps.

Represent the above data by a pie chart.
View Solution

