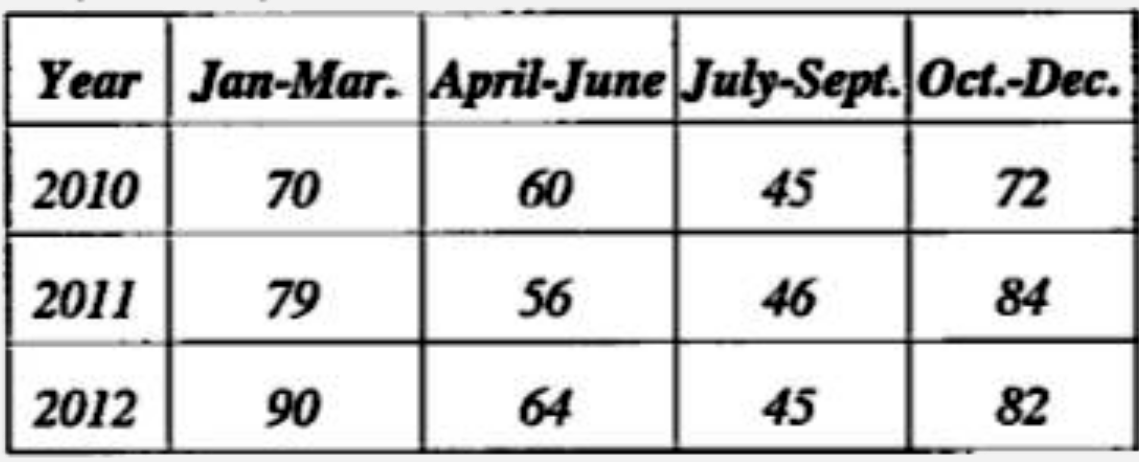
The number of road accidents in the city due to rash driving over a period of 3 years, is given in the following table :

Calculate four quarterly moving averages and illustrate them and original figures on one graph using the same axes for both.
Step by step video & image solution for The number of road accidents in the city due to rash driving over a period of 3 years, is given in the following table : Calculate four quarterly moving averages and illustrate them and original figures on one graph using the same axes for both. by Maths experts to help you in doubts & scoring excellent marks in Class 12 exams.
Updated on:21/07/2023Topper's Solved these Questions
Similar Questions
The quarterly profits of a small scale industry (in thousands of rupees) is as follows:

Calculate four quarterly moving averages. Display these and the original figures graphically on the same graphs sheet.
View SolutionThe table given below shows the number of visitors (in hundreds) to a certain exhibition over a period of two weeks:

Calculate 6-day moving averages and illustrate these and original information on the same graph using the some scales.
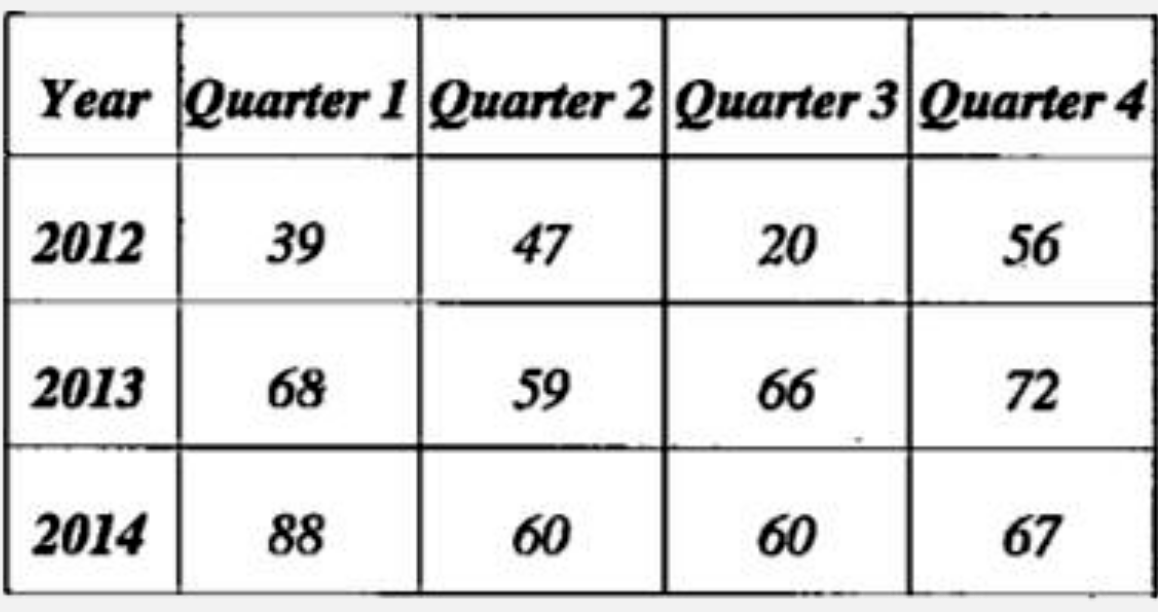
View SolutionThe table below gives details of the electricity generated in kilowatt hours in each quarter for the years 2012 to 2014

Calculate the four-quarterly moving averages and display these and the original figures on the same graph .
View SolutionIn a typhoid epidemic ,the number of cases diagnosed were as follows. Calculate 6 days moving average and display them and the original figures on the same graph.

View SolutionThe table given below shows the number of visitors ( in hundreds ) to a certain exhibition over a period of two weeks :

Calculate the 7 day moving averages and illustrate these and the original information on the same table.
View SolutionCalculate 4- yearly moving averages of the following time series of steel production :

Plot these and the original figures in the same graph.
View SolutionThe following table gives the number of failures of commercial industries in a country during the year 1975 to 1990

Draw a graph illustrating these figures. Calculate the 4 yearly moving averages and plot them on the same graph.
View SolutionThe table given below shows the daily attendance in thousands at a certain exhibition over a period of one week.
WeekSunMonTueWedThurFrisatAttendance52486468527072
Calculate three day moving average and illustrate these and original information of the same graph using the same scales.
View SolutionA manufacturer uses 4 raw materials A, B, C, D in the production of a certain commodity. Masses of raw materials used in manufacturing are in the ratio 2:3:4:1. The prices, in Rs, of the materials per kilogram in the years 1978, 1980 are given in the following table:

Calculate the index number for the total cost of the raw materials used for the manufacture of the commodity in, 1980, using 1978 as the base year.
If the commodity is sold for Rs. 5.75 in 1978, calculate the selling price in 1980, on the assumption that selling prices are directly proportional to the cost of raw material.
View SolutionThe following table gives the numbers of failures of commercial industries in a country during the years 2000 to 2015.

Draw a graph illustrating these figure.
Calculate the 4 yearly moving averages and plot them on the same graph.
View Solution
