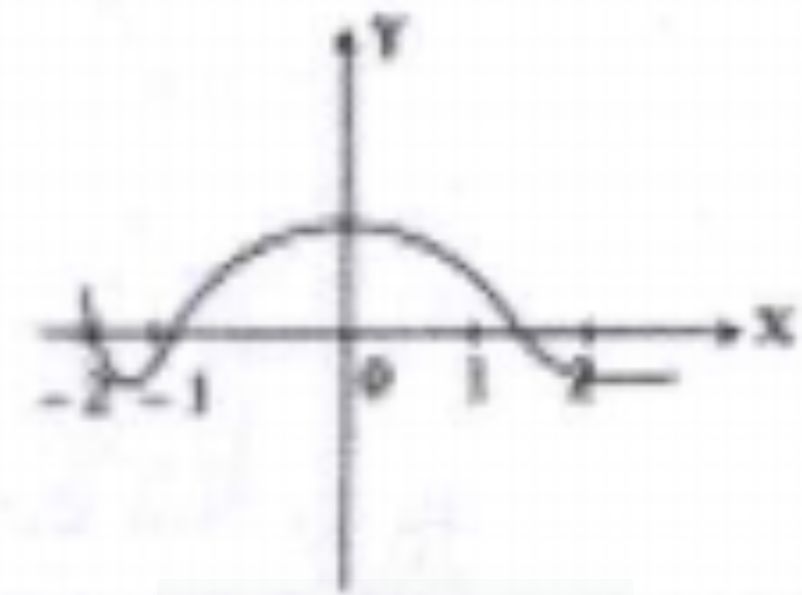
The number of zeroes of the polynomial function p(x) whose graph is given below is
 Solution in Telugu
2
2
0
3
Step by step video & image solution for The number of zeroes of the polynomial function p(x) whose graph is given below is by Maths experts to help you in doubts & scoring excellent marks in Class 10 exams.
Updated on:21/07/2023Topper's Solved these Questions
- POLYNOMIALSBOOK - BEYOND PUBLICATIONCHAPTER - POLYNOMIALSEXERCISE - EXERCISE
56 Videos
- PAIR OF LINEAR EQUATIONS IN TWO VARIABLESBOOK - BEYOND PUBLICATIONCHAPTER - PAIR OF LINEAR EQUATIONS IN TWO VARIABLESEXERCISE - EXERCISE
174 Videos
- PROBABILITYBOOK - BEYOND PUBLICATIONCHAPTER - PROBABILITYEXERCISE - EXERCISE
136 Videos
Similar Questions
If p(x) = 2x5−6x4+3x−8, find
coefficient of x
View SolutionBy comparing the ratios a1a2,b1b2,c1c2, find out whether the represented by the following pairs of linear equations intersect at a point, are parallel or are coincident. 6x-3y+10=0 , 2x-y+9=0.
View SolutionCards marked with numbers 13,14,15…………,60 are placed in a box and mixed throughly. One card is drawn at random from the box. Find the probability that number on the card drawn is
divisible by 5.
View SolutionName the enzymes 'P' and 'Q' that are involved in the processes given below.
ltimg src="https://d10lpgp6xz60nq.cloudfront.net/physics_images/BIO_044_SQP_XII_E01_005_Q01.png" width="80%"gt
View SolutionDetermine the point of symmetry of a regular hexagon.
View SolutionDtermine the images of the following figure about the given line :
View SolutionMatch the following Column A to Column B

View SolutionMatch the following Column A to Column B

View SolutionMatch the following Column A to Column B

View SolutionFind the area of figure given below.

View SolutionFind the perimeter of the figure given below.

View SolutionFind the area of the figure given below.

View SolutionThe area of the shaded part in the figure given below is ______.

View SolutionThe inequation represented by the graph given below is :
View SolutionThe inequation that best describes the graph given below is _________
View SolutionThe inequation that best describes the following graph is _________
View Solution
