The percentage of marks obtained by a student in various exams is given below. Represent the data by a line graph.
¯¯¯¯¯¯¯¯¯¯¯¯¯¯¯¯¯¯¯¯¯¯¯¯¯¯¯¯¯¯¯¯¯¯¯¯¯¯¯¯¯¯¯¯¯¯¯¯¯¯¯¯¯¯¯¯¯¯¯¯¯¯¯¯¯¯¯¯¯¯¯¯¯¯¯¯¯¯¯¯¯¯¯¯¯¯¯¯¯¯¯¯¯¯¯¯¯¯¯¯¯¯¯¯¯¯¯¯¯¯¯¯¯¯¯¯¯¯¯¯¯¯Name of UT-1 UT-1 Quartely UT-3 Half yearly UT-4 Annualthe examPercentage 50 85 60 80 68 75 70of marks ––––––––––––––––––––––––––––––––––––––––––––––––––––––––––––––––––––––––––––––––
To represent the percentage of marks obtained by a student in various exams using a line graph, we will follow these steps:
Step 1: Organize the Data
First, we need to organize the data in a clear format. The data provided is:
- UT-1: 50%
- UT-2: 85%
- Quarterly: 60%
- UT-3: 80%
- Half Yearly: 68%
- UT-4: 75%
- Annual: 70%
Step 2: Create the Axes
Next, we will create the axes for the line graph:
- The x-axis will represent the names of the exams (UT-1, UT-2, Quarterly, UT-3, Half Yearly, UT-4, Annual).
- The y-axis will represent the percentage of marks (ranging from 0% to 100%).
Step 3: Mark the Points on the Graph
Now, we will plot the points on the graph based on the percentages:
- For UT-1, plot a point at (UT-1, 50).
- For UT-2, plot a point at (UT-2, 85).
- For Quarterly, plot a point at (Quarterly, 60).
- For UT-3, plot a point at (UT-3, 80).
- For Half Yearly, plot a point at (Half Yearly, 68).
- For UT-4, plot a point at (UT-4, 75).
- For Annual, plot a point at (Annual, 70).
Step 4: Connect the Points
After plotting all the points, we will connect them with straight lines:
- Connect the point for UT-1 to UT-2.
- Connect UT-2 to Quarterly.
- Connect Quarterly to UT-3.
- Connect UT-3 to Half Yearly.
- Connect Half Yearly to UT-4.
- Finally, connect UT-4 to Annual.
Step 5: Label the Graph
Lastly, we will label the graph:
- Title the graph as "Percentage of Marks Obtained in Various Exams".
- Label the x-axis as "Exams".
- Label the y-axis as "Percentage of Marks".
Final Output
The final output will be a line graph that visually represents the percentage of marks obtained by the student in various exams.
---
First, we need to organize the data in a clear format. The data provided is:
- UT-2: 85%
- Quarterly: 60%
- UT-3: 80%
- Half Yearly: 68%
- UT-4: 75%
- Annual: 70%
Next, we will create the axes for the line graph:
- The x-axis will represent the names of the exams (UT-1, UT-2, Quarterly, UT-3, Half Yearly, UT-4, Annual).
- The y-axis will represent the percentage of marks (ranging from 0% to 100%).
Now, we will plot the points on the graph based on the percentages:
- For UT-1, plot a point at (UT-1, 50).
- For UT-2, plot a point at (UT-2, 85).
- For Quarterly, plot a point at (Quarterly, 60).
- For UT-3, plot a point at (UT-3, 80).
- For Half Yearly, plot a point at (Half Yearly, 68).
- For UT-4, plot a point at (UT-4, 75).
- For Annual, plot a point at (Annual, 70).
After plotting all the points, we will connect them with straight lines:
- Connect the point for UT-1 to UT-2.
- Connect UT-2 to Quarterly.
- Connect Quarterly to UT-3.
- Connect UT-3 to Half Yearly.
- Connect Half Yearly to UT-4.
- Finally, connect UT-4 to Annual.
Lastly, we will label the graph:
- Title the graph as "Percentage of Marks Obtained in Various Exams".
- Label the x-axis as "Exams".
- Label the y-axis as "Percentage of Marks".
The final output will be a line graph that visually represents the percentage of marks obtained by the student in various exams.
Topper's Solved these Questions
- STATISTICSBOOK - PEARSON IIT JEE FOUNDATIONCHAPTER - STATISTICSEXERCISE - CONCEPT APPLICATION Level - 1
14 Videos
- STATISTICSBOOK - PEARSON IIT JEE FOUNDATIONCHAPTER - STATISTICSEXERCISE - Level 2
22 Videos
- STATISTICSBOOK - PEARSON IIT JEE FOUNDATIONCHAPTER - STATISTICSEXERCISE - Short Answer Type
21 Videos
- SIMPLE INTEREST AND COMPOUND INTEREST BOOK - PEARSON IIT JEE FOUNDATIONCHAPTER - SIMPLE INTEREST AND COMPOUND INTEREST EXERCISE - Level 3
9 Videos
Similar Questions
The marks obtained by a student in various subjects in an examination are given below.

Represent the data using pie diagram.
View SolutionThe percentage of marks obtained by a student in the monthly unit tests are given below.Based on this data, find the probability that the student gets more
View Solution
Knowledge Check
The Table given below presents the marks obtained by three students in five examinations
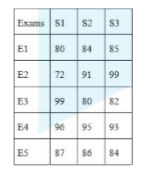
What is the sum of marks obtained by S1 in Exam E4 ,S2 in Exam E1,S3 in Exam E3 and E5 ?A346B326C366D306The Table given below presents the marks obtained by three students in five examinations .
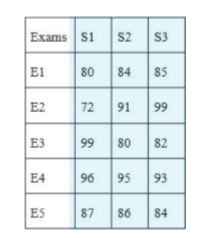
The marks obtained by S 1 in Exam E5 is how much percentage (correct up to two places of decimal) more than that obtained by S2 in Exam E3 ?A9.75B8.75C9.26D10.24
The Table given below presents the marks obtained by three students in five examinations .
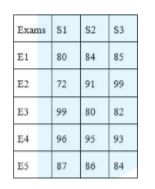
What is the average of marks obtained by S3 per exam ?
View SolutionThe marks (out of 100) obtained by a student in his quarterly examination in various subjects are given below :
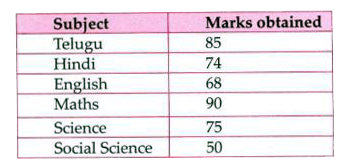
The total percentage of marks scored by the student is.
View SolutionIn a class of 40 students, the marks obtained (out of 50) are as given below:

Draw a histogram to represent the given data.
View SolutionThe percentage of marks obtained by 10 students in the monthly unit tests are given below:

Based on this data, a student is selected at random. Find the probability that the selected student obtains more than 70% marks in a unit test.
View SolutionThe marks obtained by a student in an examination are given below: The total marks out of 100 obtained in various subjects are as follows:
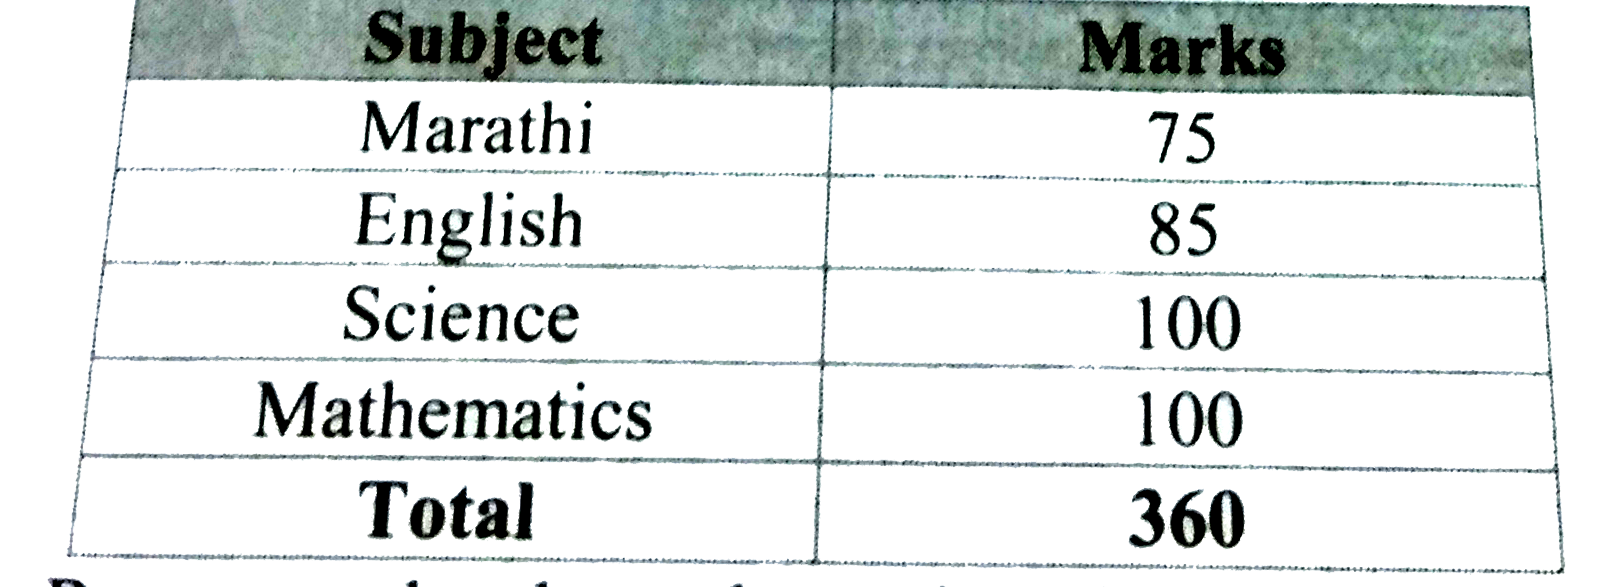
Represent the data using pie diagram.
View Solution1700 students took an exam 85% students passsed it. Find the number of students who failed in the exam.
View Solution
