For the information given in the above question, find the heights of the bars, when the data represente in a bar graph : Scale of the graph : 1 cm = Rs. 500.
The correct Answer is:7.2 cm, 4.8 cm, 4.2 cm, 2.4 cm, 3 cm
Topper's Solved these Questions
- STATISTICSBOOK - PEARSON IIT JEE FOUNDATIONCHAPTER - STATISTICSEXERCISE - CONCEPT APPLICATION Level - 1
14 Videos
- STATISTICSBOOK - PEARSON IIT JEE FOUNDATIONCHAPTER - STATISTICSEXERCISE - Level 2
22 Videos
- STATISTICSBOOK - PEARSON IIT JEE FOUNDATIONCHAPTER - STATISTICSEXERCISE - Short Answer Type
21 Videos
- SIMPLE INTEREST AND COMPOUND INTEREST BOOK - PEARSON IIT JEE FOUNDATIONCHAPTER - SIMPLE INTEREST AND COMPOUND INTEREST EXERCISE - Level 3
9 Videos
Similar Questions
For the information given in the above question, find the heights of the bars, when the data represented in a bar graph: Scale of the graph: 1 cm = Rs 500.
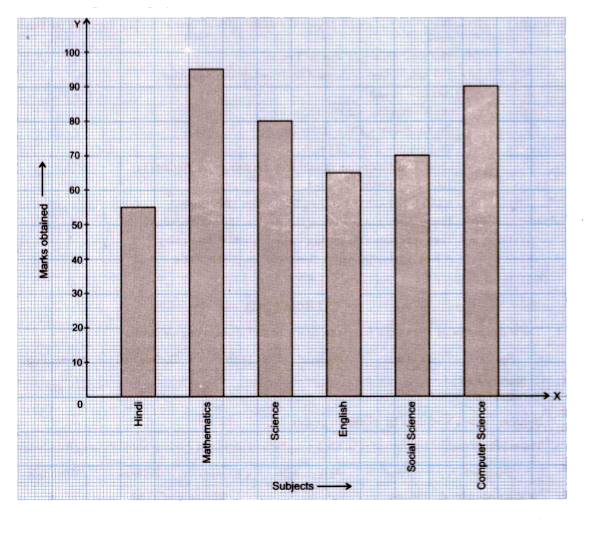
View SolutionRead the given bar graph and answer the question that follow :

What information is represented by the bar graph?
View SolutionThe following table gives the height of five trees in a garden.
<
If the given data has to be represented as a bar graph, then select the most appropriate scale from the given options that can be used to draw the bar graph.
1 unit = 1 trees
View SolutionThe following table gives the height of five trees in a garden.

If the given data has to be represented as a bar graph, then select the most appropriate scale from the given options that can be used to draw the bar graph.
1 unit = 20 trees
View SolutionThe following table gives the height of five trees in a garden.

If the given data has to be represented as a bar graph, then select the most appropriate scale from the given options that can be used to draw the bar graph.
1 unit = 8 trees
View SolutionThe following table gives the height of five trees in a garden.

If the given data has to be represented as a bar graph, then select the most appropriate scale from the given options that can be used to draw the bar graph.
1 unit = 5 trees
View SolutionDraw a bar graph from the following data:

View SolutionPrepare a bar graph of the data given in question 28.
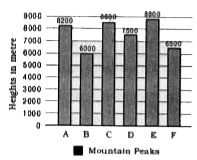
View SolutionA bar graph showing the heights of six mountain peaks is given below. Study the bar graph and answer the questions.

When the heights of the given peaks are written in ascending order, what is the average of the middle two peaks?
View SolutionIn a bar graph, a bar of length 3.2 cm represents 96 units, then the number of units represented by a bar graph of length 2.1 cm is _________ .
View Solution
