The pie chart describes the characteristics of India visiting UK from various states during given year. Answer the following question given below : Assume that the age wise distribution data applies to all states and that in the given year, 1,00,000 Indian visited UK:
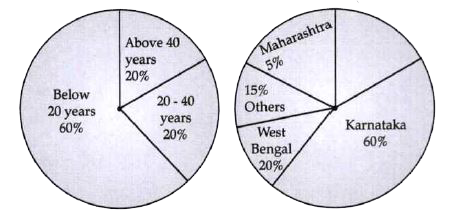
How many visitors were below 20 years of age but were neither from Karnataka, nor Maharashtra or West Bengal ?
7000
15000
9000
6000
The correct Answer is:C
Step by step video, text & image solution for The pie chart describes the characteristics of India visiting UK from various states during given year. Answer the following question given below : Assume that the age wise distribution data applies to all states and that in the given year, 1,00,000 Indian visited UK: How many visitors were below 20 years of age but were neither from Karnataka, nor Maharashtra or West Bengal ? by Maths experts to help you in doubts & scoring excellent marks in Class 10 exams.
Updated on:21/07/2023Topper's Solved these Questions
- MAT STAGE 2 (2019-20)Book:OSWAL PUBLICATIONChapter:MAT STAGE 2 (2019-20)Exercise:M.C.Q
Explore 97 Videos
- NEW TYPOLOGIES INTRODUCED BY CBSE FOR BOARD 2021-22 EXAM Book:OSWAL PUBLICATIONChapter:NEW TYPOLOGIES INTRODUCED BY CBSE FOR BOARD 2021-22 EXAM Exercise:UNIT-VII STATISTICS AND PROBABILITY (STATISTICS) (SELF ASSESSMENT)
Explore 2 Videos
Similar Questions
Look at the histogram given below answer the question that follow:
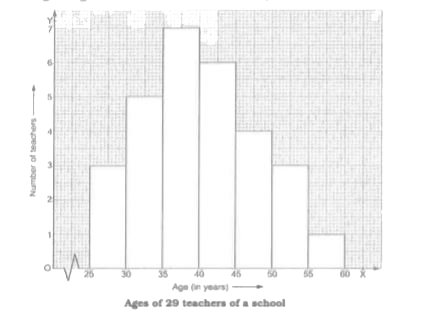
(i) What information in being given by the histogram?
(ii) How many teachers are of age less than 45 years?
(iii) How many teachers are of age 40 years or more but less than 55 years?
View SolutionThe pie chart describes the characteristics of India visiting UK from various states during given year. Answer the following question given below : Assume that the age wise distribution data applies to all states and that in the given year, 1,00,000 Indian visited UK:
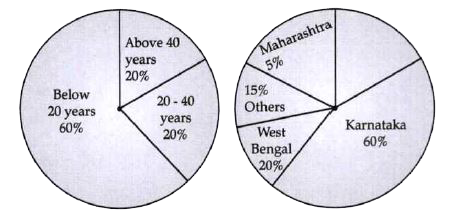
Find the difference between visitors from West Bengal and Maharashtra in the age group of 20 - 40 years.
View Solution
Knowledge Check
The pie chart describes the characteristics of India visiting UK from various states during given year. Answer the following question given below : Assume that the age wise distribution data applies to all states and that in the given year, 1,00,000 Indian visited UK:
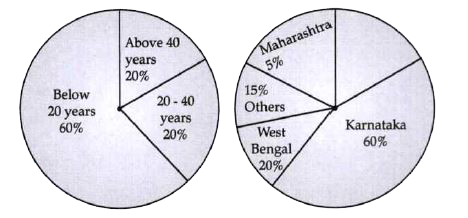
Number of visitors from Maharashtra below the age of 20 years.A3999B5000C6000D8000The pie chart describes the characteristics of India visiting UK from various states during given year. Answer the following question given below : Assume that the age wise distribution data applies to all states and that in the given year, 1,00,000 Indian visited UK:
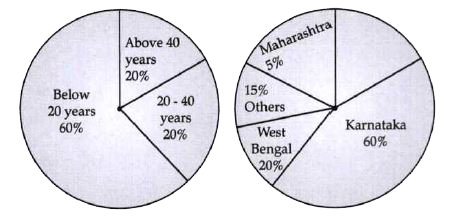
Number of visitor from Karnataka in the age group of 20-40 years.A20000B18000C12000DNone of theseThe pie chart describes the characteristics of India visiting UK from various states during given year. Answer the following question given below : Assume that the age wise distribution data applies to all states and that in the given year, 1,00,000 Indian visited UK:
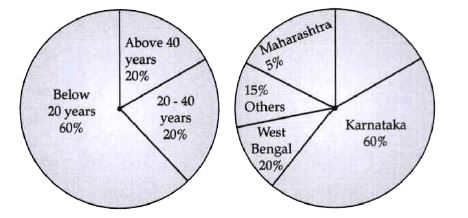
The ratio of visitor from West Bengal below 20 years to visitor from Maharashtra above 40 years in:A1:3B12:1C3:4D3:1
The pie chart given here shows the spendings of a country on various sports during a particular year. Study the chart carefully and answer the questions given below it.
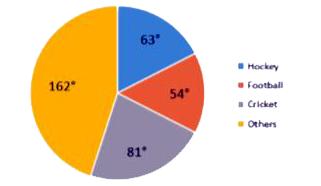
How much percent less is spent on Football than that on Cricket?
View SolutionThe pie-chart given here shows the country's expenditure on various sports during a particular year. Study the pie-chart and answer the question given below.
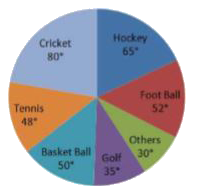
If the total amount spent on sports in the year was ₹1,80,00,000, then the amount spent on tennis is more than the expenditure on golf by:
View SolutionThe following questions depends on the table given below-
Distribution of malnutrition in children in percentage in various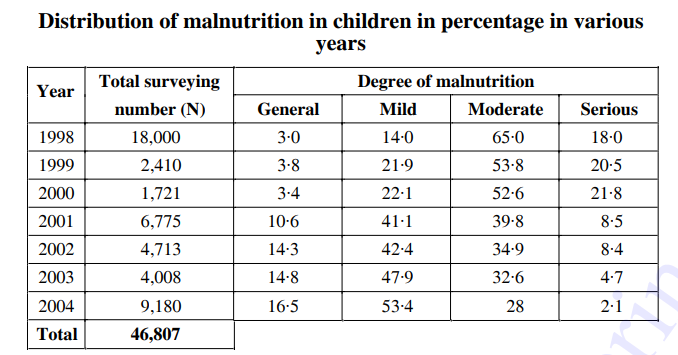
How many were normal in the number of the surveying in all the years?
View SolutionThe pie chart drawn below shows the spendings of a country on various sports during a particular year. Study the pie chart and answer the questions.
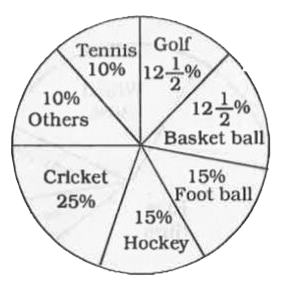
If, the total amount spent on sports during the year was Rs. 1,20,00,000, how much was spent on basketball ?
View SolutionThe following questions depends on the table given below-
Distribution of malnutrition in children in percentage in various
How many percent approximately was mild malnutrition in all the years together?
View Solution