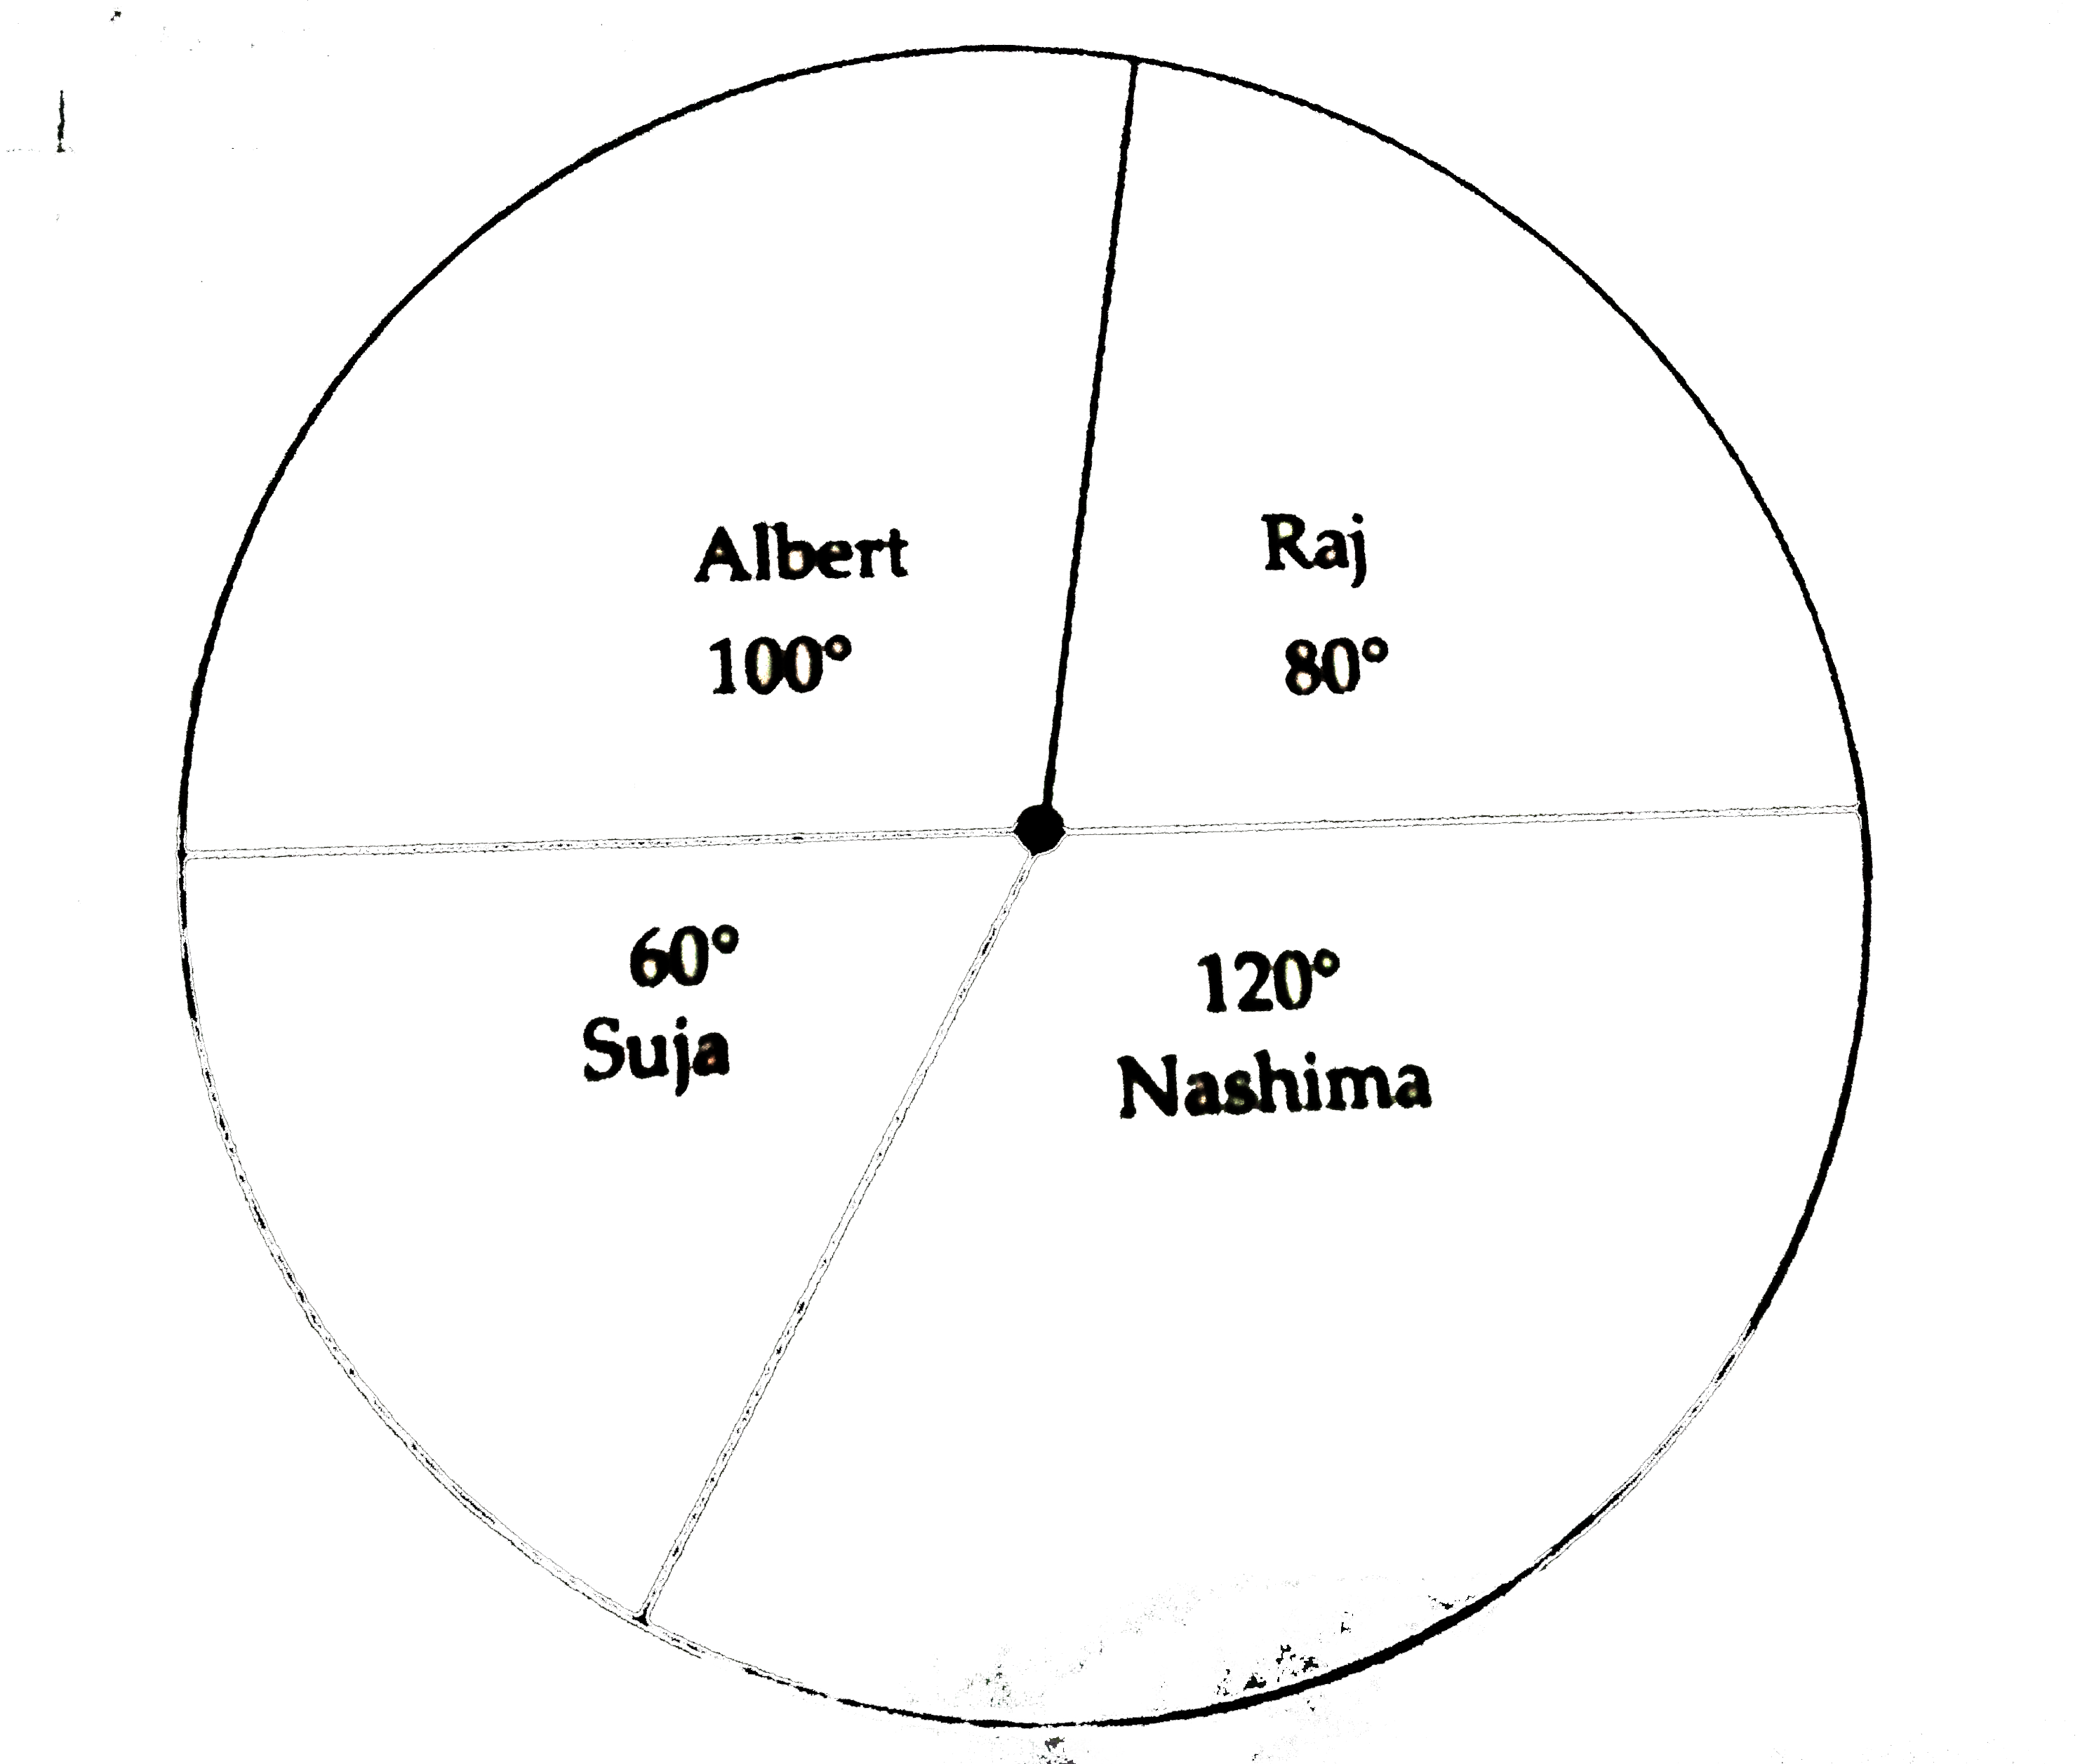
The pie chart gives the information of the number of votes obtained by five schools leaders, who contested for school elections. The total votes polled were 540.
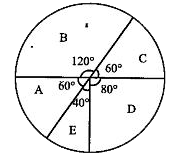
(a) Who won the elections?
(b) By how many votes did the winner defeat the nearest rival?
(c ) Who got the least number of votes?Solution in Punjabi
Step by step video & image solution for The pie chart gives the information of the number of votes obtained by five schools leaders, who contested for school elections. The total votes polled were 540. (a) Who won the elections? (b) By how many votes did the winner defeat the nearest rival? (c ) Who got the least number of votes? by Maths experts to help you in doubts & scoring excellent marks in Class 8 exams.
Updated on:21/07/2023Topper's Solved these Questions
- DATA HANDLING BOOK - NAND LAL PUBLICATIONCHAPTER - DATA HANDLING EXERCISE - ADDITIONAL QUESTIONS FOR PRACTICE (Long Answer Type Questions)
14 Videos
- DATA HANDLING BOOK - NAND LAL PUBLICATIONCHAPTER - DATA HANDLING EXERCISE - SAMPLE PAPER FOR PRACTICE (Answer the multiple choice question)
4 Videos
- DATA HANDLING BOOK - NAND LAL PUBLICATIONCHAPTER - DATA HANDLING EXERCISE - ADDITIONAL QUESTIONS FOR PRACTICE (Objective Type Questions)
21 Videos
- CUBES AND CUBE ROOTSBOOK - NAND LAL PUBLICATIONCHAPTER - CUBES AND CUBE ROOTSEXERCISE - Sample Paper For Practice
18 Videos
- DIRECT AND INVERSE PROPORTIONSBOOK - NAND LAL PUBLICATIONCHAPTER - DIRECT AND INVERSE PROPORTIONSEXERCISE - SAMPLE PAPER FOR PRACTICE ( Fill in the blanks )
17 Videos
Similar Questions
Draw a pie chart for the following data. Number of students studying languages in a school.

View SolutionProbability of choosing a prime number from 1 to 9 is
View SolutionFill in the blanks.
Data in unorganised form is called ______ data.
View SolutionCube of a natural number 5 will end with the digit
View SolutionSpeed of moving objects varies inversely to the ________ to cover a certain distance.
View SolutionFour candidates contested an election in which they got 231598,487642,591124 and 98729 votes respectively.How many people cast their votes? By how many votes did the winner defeat his nearest rival?
View SolutionP , Q and R contested in an election. All the votes polled were valid. P got 30% of the total votes. For every 40 total votes, Q got 18 votes.The winner got 6000 more votes than the person who received the least number of votes. Find the total number of votes polled.
View SolutionThe pie diagram represents the number of valid votes secured by four students who contested for school captain.The total number of valid votes polled was 720.
Answer the following questions :
(i) Who has won the election ?
(ii) How many votes died the winner secure ?
(iii) What is the minimum number of votes ?Who got it ?
(iv) By how many votes did the winner defeat the nearest contestant ?
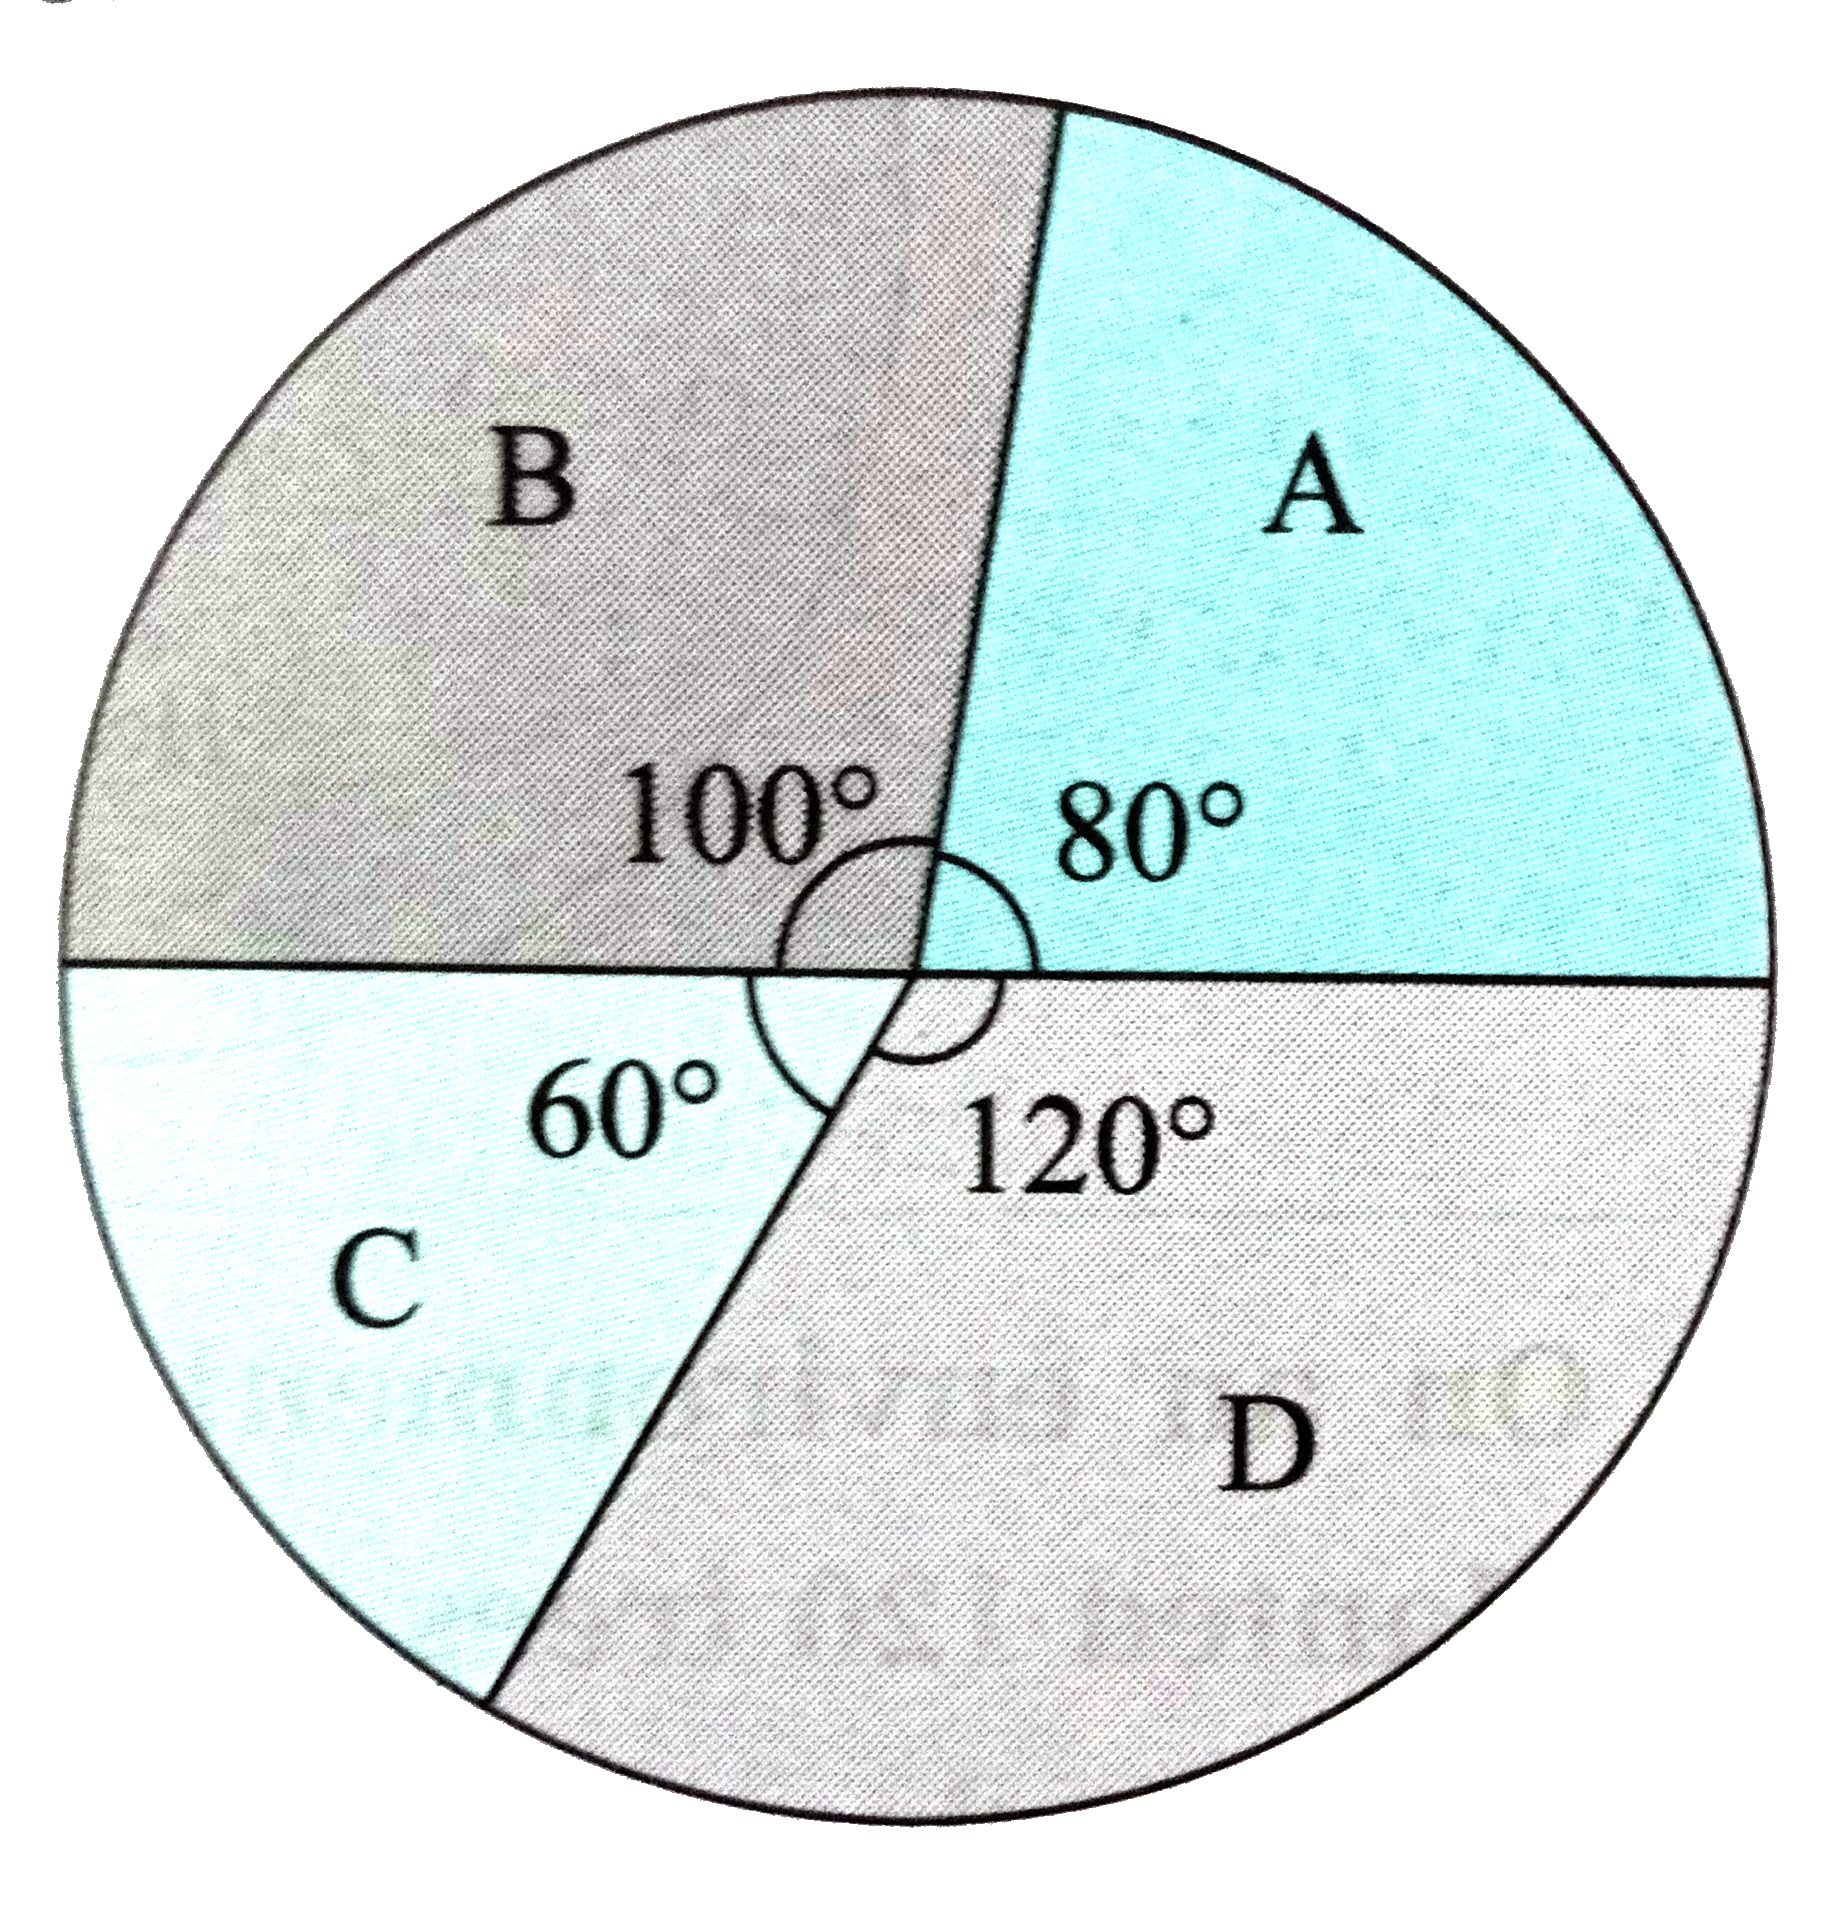
View SolutionThe following pie diagram represents the number of valid votes obtained by four students who contested for school captain . The total of valid votes polled was 720 . Answer the following questions.
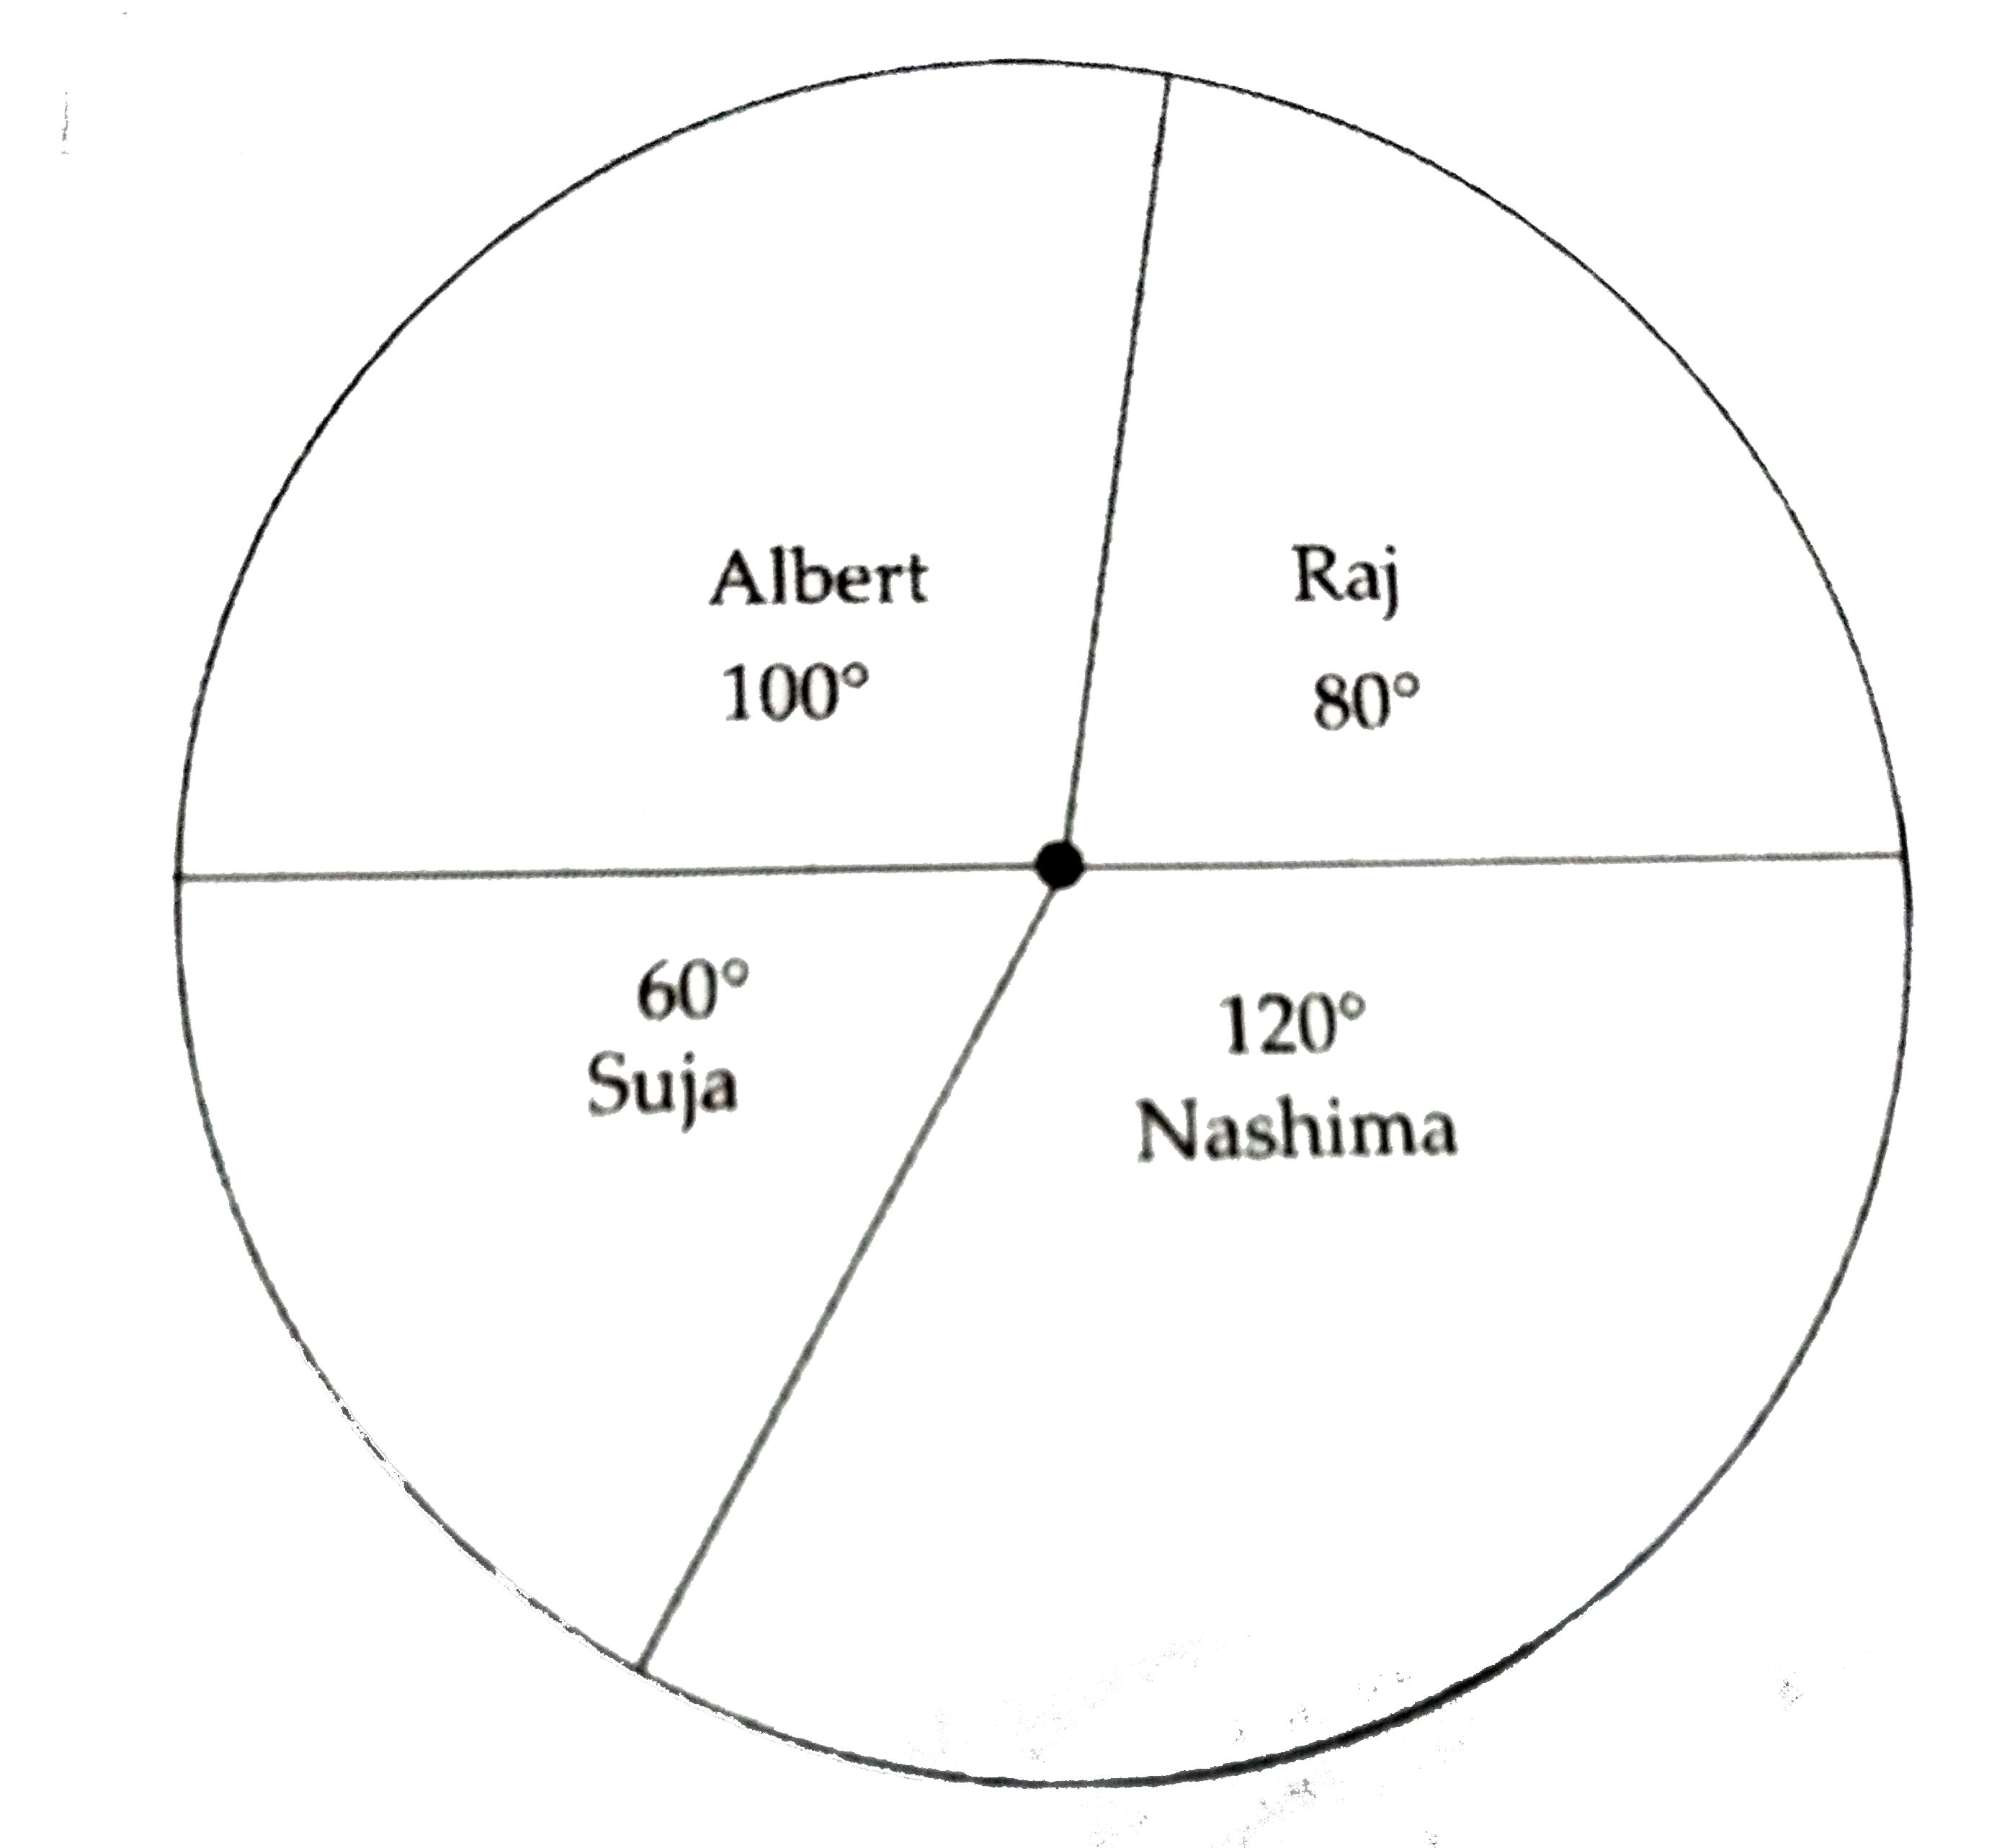
Who has won the election ?
View SolutionThe following pie diagram represents the number of valid votes obtained by four students who contested for school captain . The total of valid votes polled was 720 . Answer the following questions.
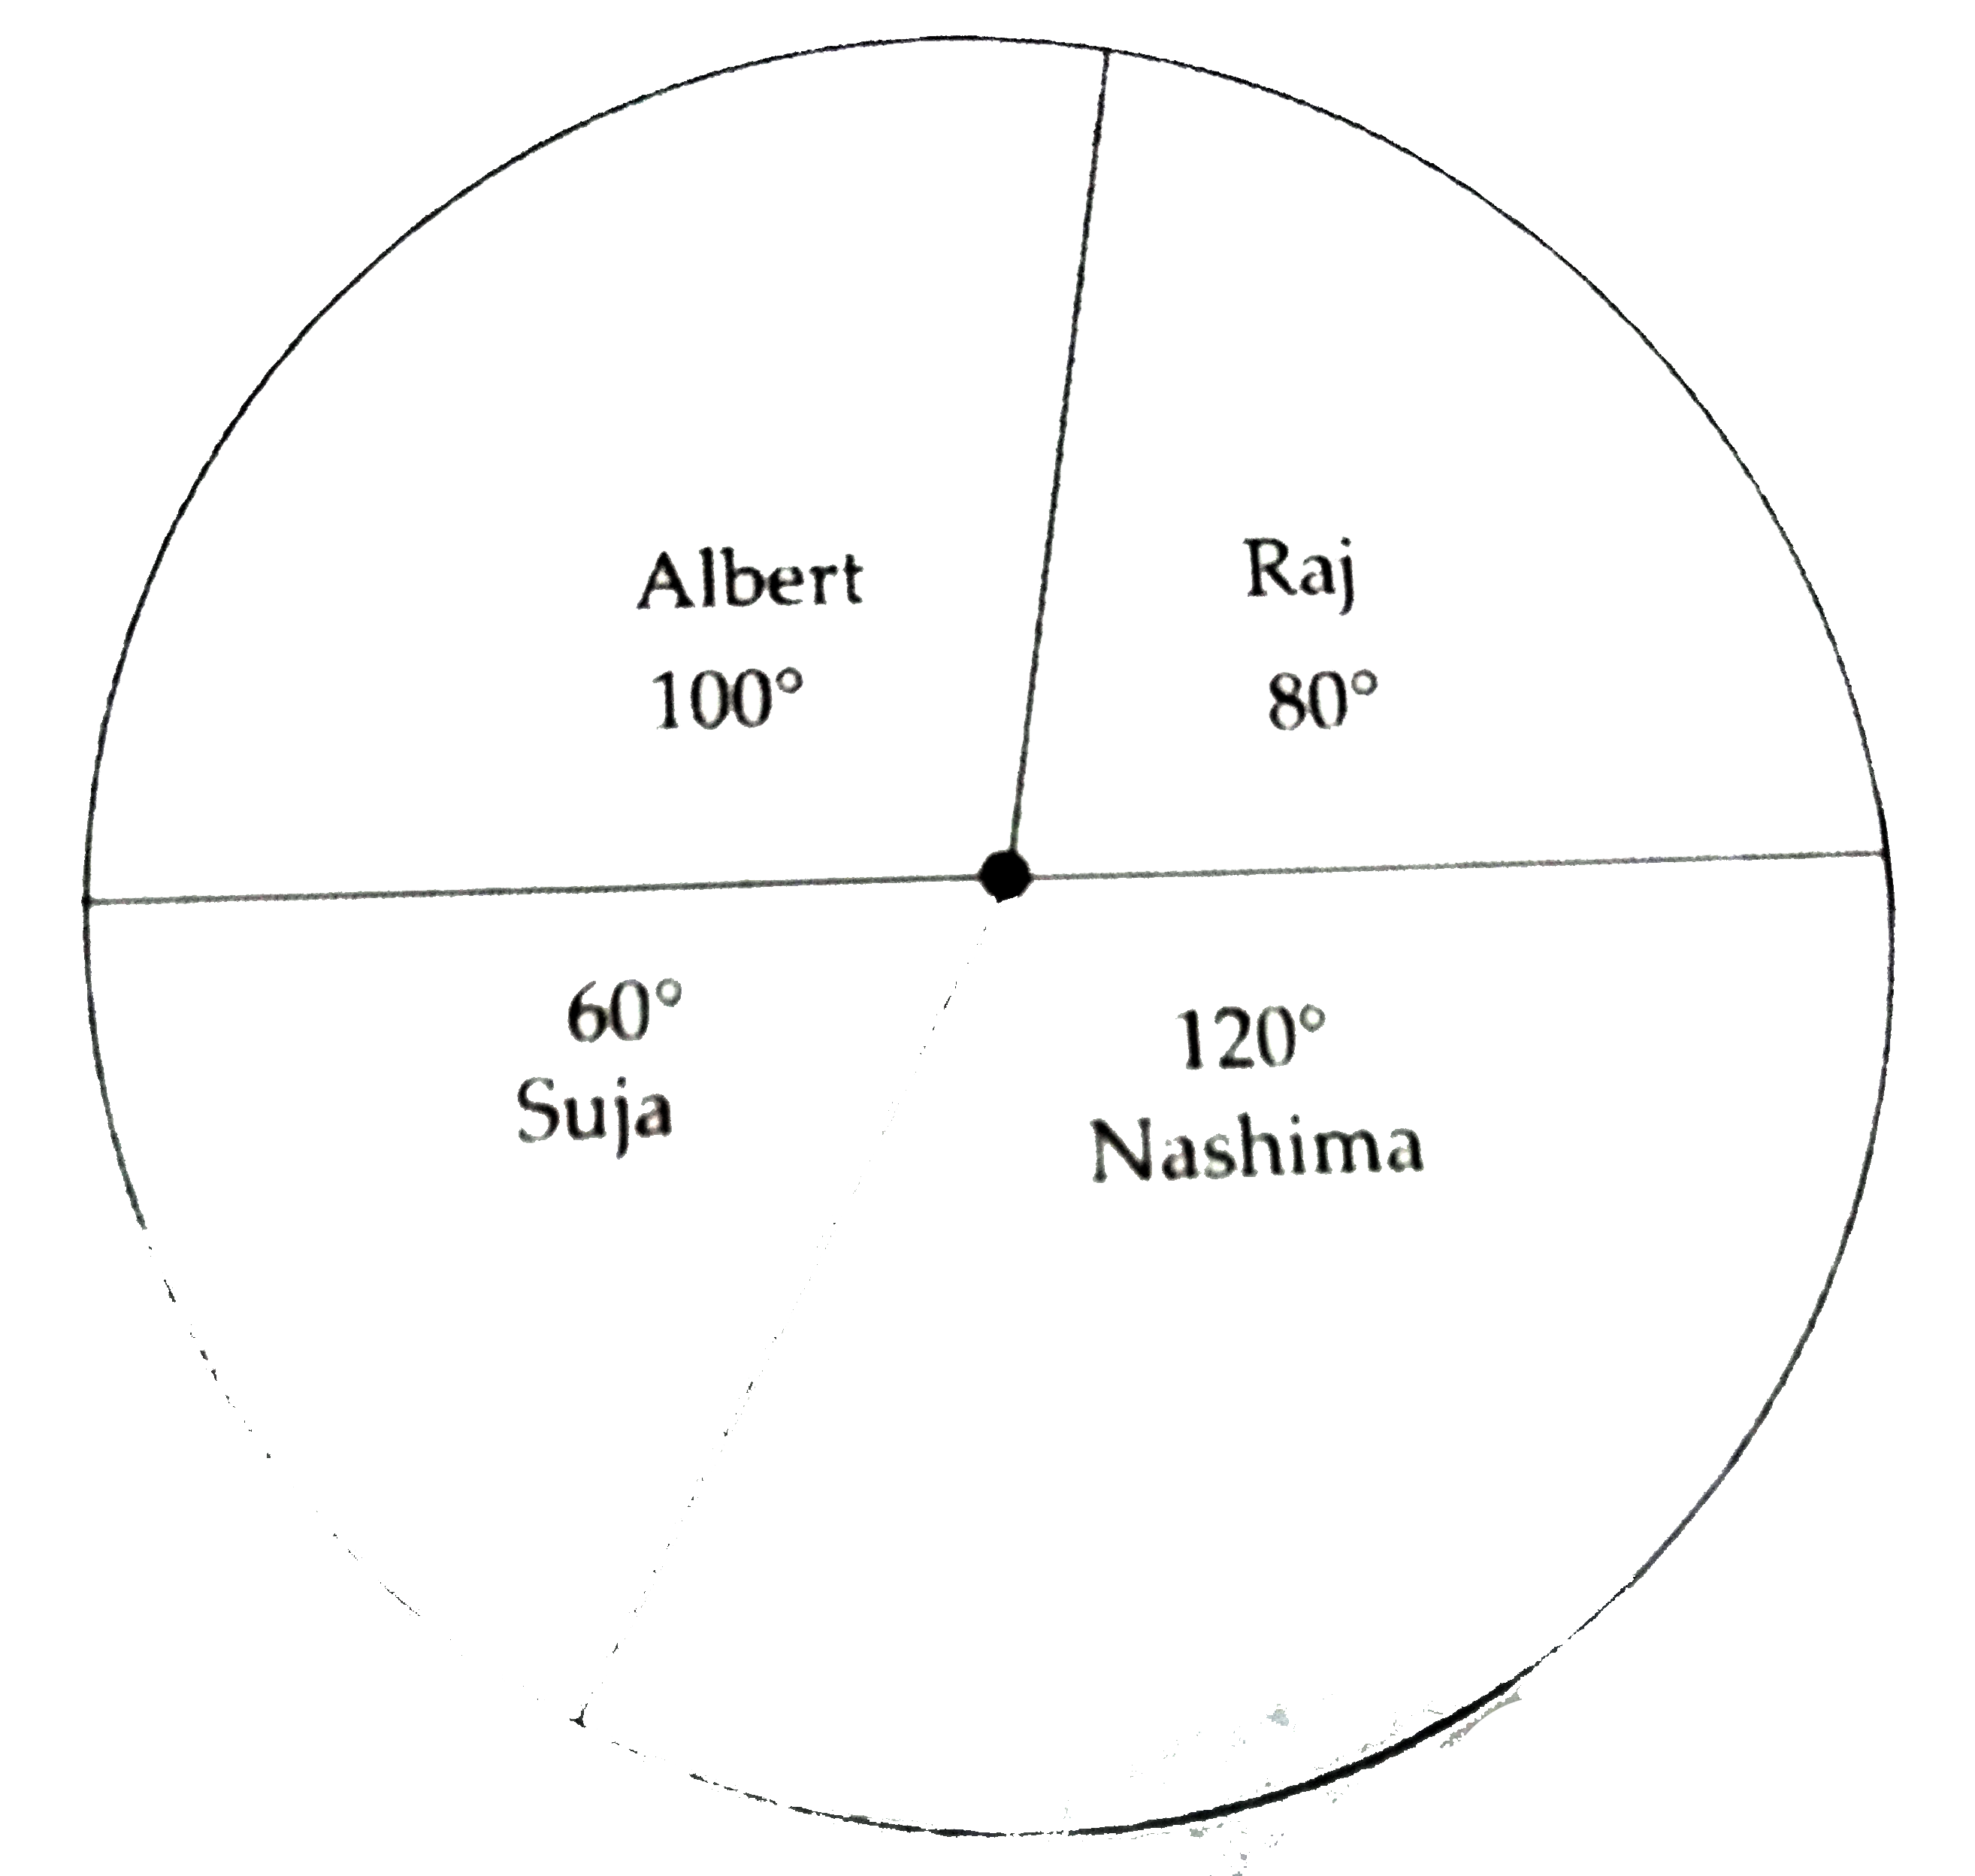
What is the minimum no. of votes ? Who got it ?
View SolutionThe following pie diagram represents the number of valid votes obtained by four students who contested for school captain . The total of valid votes polled was 720 . Answer the following questions.
By how many votes did the winner defeat the nearest contestant ?
View SolutionThree candidates A,B and C contested an election. Out of the total votes list 25% did not vote and 6.66% votes polled were invalid. C got 2450 valid votes, which were 40% more than that of B. If A Got only 40% of the total votes, then who is the winner?
View Solution8% of the voters in an election did not cast their votes. In this election, there were only two candidates. The winner by obtaining 48% of the total votes defeated his contestant by 1100 votes. The total number of voters in the election was:
View SolutionThe pie chart, given here, represents the number of valid votes obtained by four students who contested election for school leadership. The total number of valid votes polled was 720.
Observe the chart and answer the questions based on it.
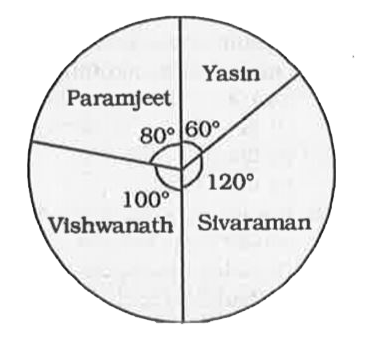
By how many votes did the winner defeat his nearest rival ?
View SolutionIn an election, a candidate who gets 84 % of the votes is elected by a majority of 476 votes. What is the total number of votes polled ?
View SolutionThe following pie-chart represents the total number of valid votes obtained by four students who contested for school leadership. The total number of valid votes polled was 720. Answer the following questions by reading the pie-chart.
View Solution
