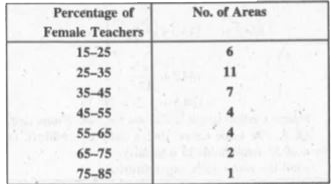
The table below gives the percentage distribution of female teachers in the primary schools of rural areas of various states and union territories (U.T.) of India. Find the mean percentage of female teachers by all the three methods discussed in this section.

⎧⎪
⎪
⎪
⎪
⎪
⎪
⎪
⎪
⎪
⎪
⎪
⎪
⎪
⎪
⎪
⎪
⎪
⎪⎨⎪
⎪
⎪
⎪
⎪
⎪
⎪
⎪
⎪
⎪
⎪
⎪
⎪
⎪
⎪
⎪
⎪
⎪⎩CIxifixifi15−2520612025−35301133035−4540728045−5550420055−6560424065−7570214075−8580180∑fi=35∑fi⋅xi=1390
xi=lower class + upper class2
(a.) Using Direct Method
¯x=∑fi⋅xi∑fi=139035=39.714
(b.)Using assumed mean method
Here a=50,di=xi−50
¯x=a+∑fi⋅di∑fi=50+−36035=39.714
(c.)Using step-deviation method
a=50,h=10,ui=xi−5010
¯x=a+∑fi⋅ui∑fi×h=50+−3635×10=39.714
Similar Questions
The table below gives the percentage distribution of female teachers in the schools of rural areas. Find the mean percentage of female teachers.
 View Solution
The following table given the percentage distribution of female students in various schools of rural areas of various State(s) and Union Territories (UT) of India who get scholarship.

Find the mean percentage of femal students getting scholarship.View Solution
Knowledge Check
- Question 1 - Select One
The following pie-chart and table show the percentage distribution of farmers in 5 states A, B, C, D & E of a country who claimed insurance due to drought in the year 2017 and ratio of males to females of the number of farmers in states, respectively. Study the pie-chart and the table carefully and answer the following questions.
Note: Some data are missing in the pie-chart and table, if required in any question, find the missing data first and then answer the question.
Total number of farmers who claimed insurance in the year 2017 = 2,64,000
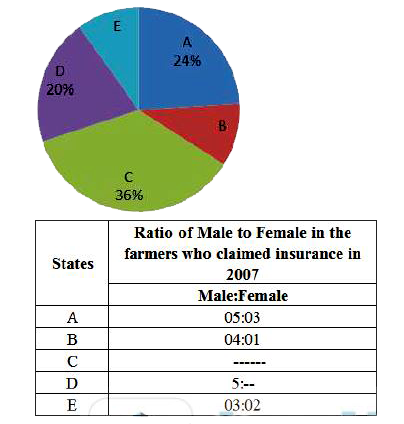
The number of farmers who claimed insurance in state C exceeds the total number of farmers (who claimed insurance)in state E and state A together by 5280. What is the percentage of farmers who claimed insurance in state E?A0.15B0.25C0.1D0.4 - Question 2 - Select One
A stated objective of economic policy planning is achievement of high rates of growth of the economy and sustained improvement in the standards ofliving of people. A rapid growth in employment opportunities for all sections of the society, associated with rising GDP growth is essential to realize this objective as also to achieve the goal of lnclusive Growth.
Since lndia became part of the global economy and underwent economic reforms in 1891, its economy grew at a faster rate ofnearly 9 per cent per annum till 20 I 0. In the process, India has becotne the fourth largest economy in the world. In the last two decades, a significant proportion of the population across the country has reaped the benefits of this economic growth. They have become the part of global economy and market, and their lives have transformed into one of global citizens with all the comforts and luxury in life.
Apart from this burgeoning middle class in the country, the .economic growth seemed to have touched the lives of the poor also. According to the National Sample Survey results, people livmg below poverty line have dramatically come down du.rmg the post economic reform era. Many economists question this dramatic change m poverty level. The fruits of economic
growth have not benefited everyone uniformly. Some are left behind and some others are not touched by the benefits of economic growth. It is proved globally that the so-called trickle down effect does not work in all the societies and India is no exception to this. There are various reasons for th is uneven development in the society.
Modern economy is technology driven and not labour- intensive. High volume of high quality goods and services are produced with fewer labour hands. In short, the modern economy is not generating much employment and sometimes it displaces and replaces labour with machines and tools . During this period, the unemployment rate remained almost same for rural males and decreased by just one percentage for urban male. On the other hand, unemployment among females increased by one percentage for urban and rural females. During this period, the unemployment rate remained almost same for rural males and decreased by just one percentage for urban male. On the other hand, unemployment among females increased by one percentage for urban and rural females economic development process. Such groups need government intervention to ensure that they are not left behind in the development process and deprived of the benefits because they do not have the capacity to be part of the global economy. The government needs to develop safety nets for such groups and try to mainstream them in the development process. They need welfare measures in the form of poverty alleviation programmes to ensure that they survive if not prosper in this era of economic reform. Further, the poor are not a homogeneous population and their capacity to survive the economic reform varied from one group of poor to another. Especially, those who are below the poverty line or the poorest among the poor need more government help.
Growing integration of our economy with the global economy has increased the susceptibility of the economy to the vagaries of global economic forces. Recent global recession adversely affected Indian economy and hence the employment scenario in the country as well.
Which of the following statement(s) is/are true in the context of the given passage ?
I. The stated objective of economic policy planning is achievement of high rates of economic growth.
II. the other objective is sustained improvement in the standards of living of people.
Ill. Economic policy planning emphasises on growth of marketing sector to compete with global trade.AOnly l and IllBOnly II and IIICOnly I and IIDOnly I
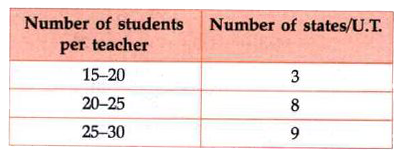
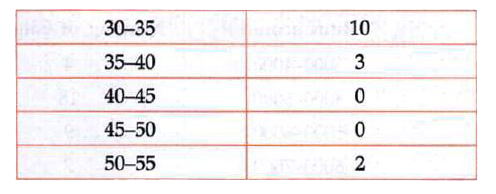
The following distribution gives the state-wise teacher-student ratio in higher secondary schools of India. Find the mode and mean of this data. Interprent the two measures.
 View Solution
Percentage of households having access to safe drinking water in 31 States/Union Territories of India during 1991 is given below. Calculate mean percentage and compare the results.
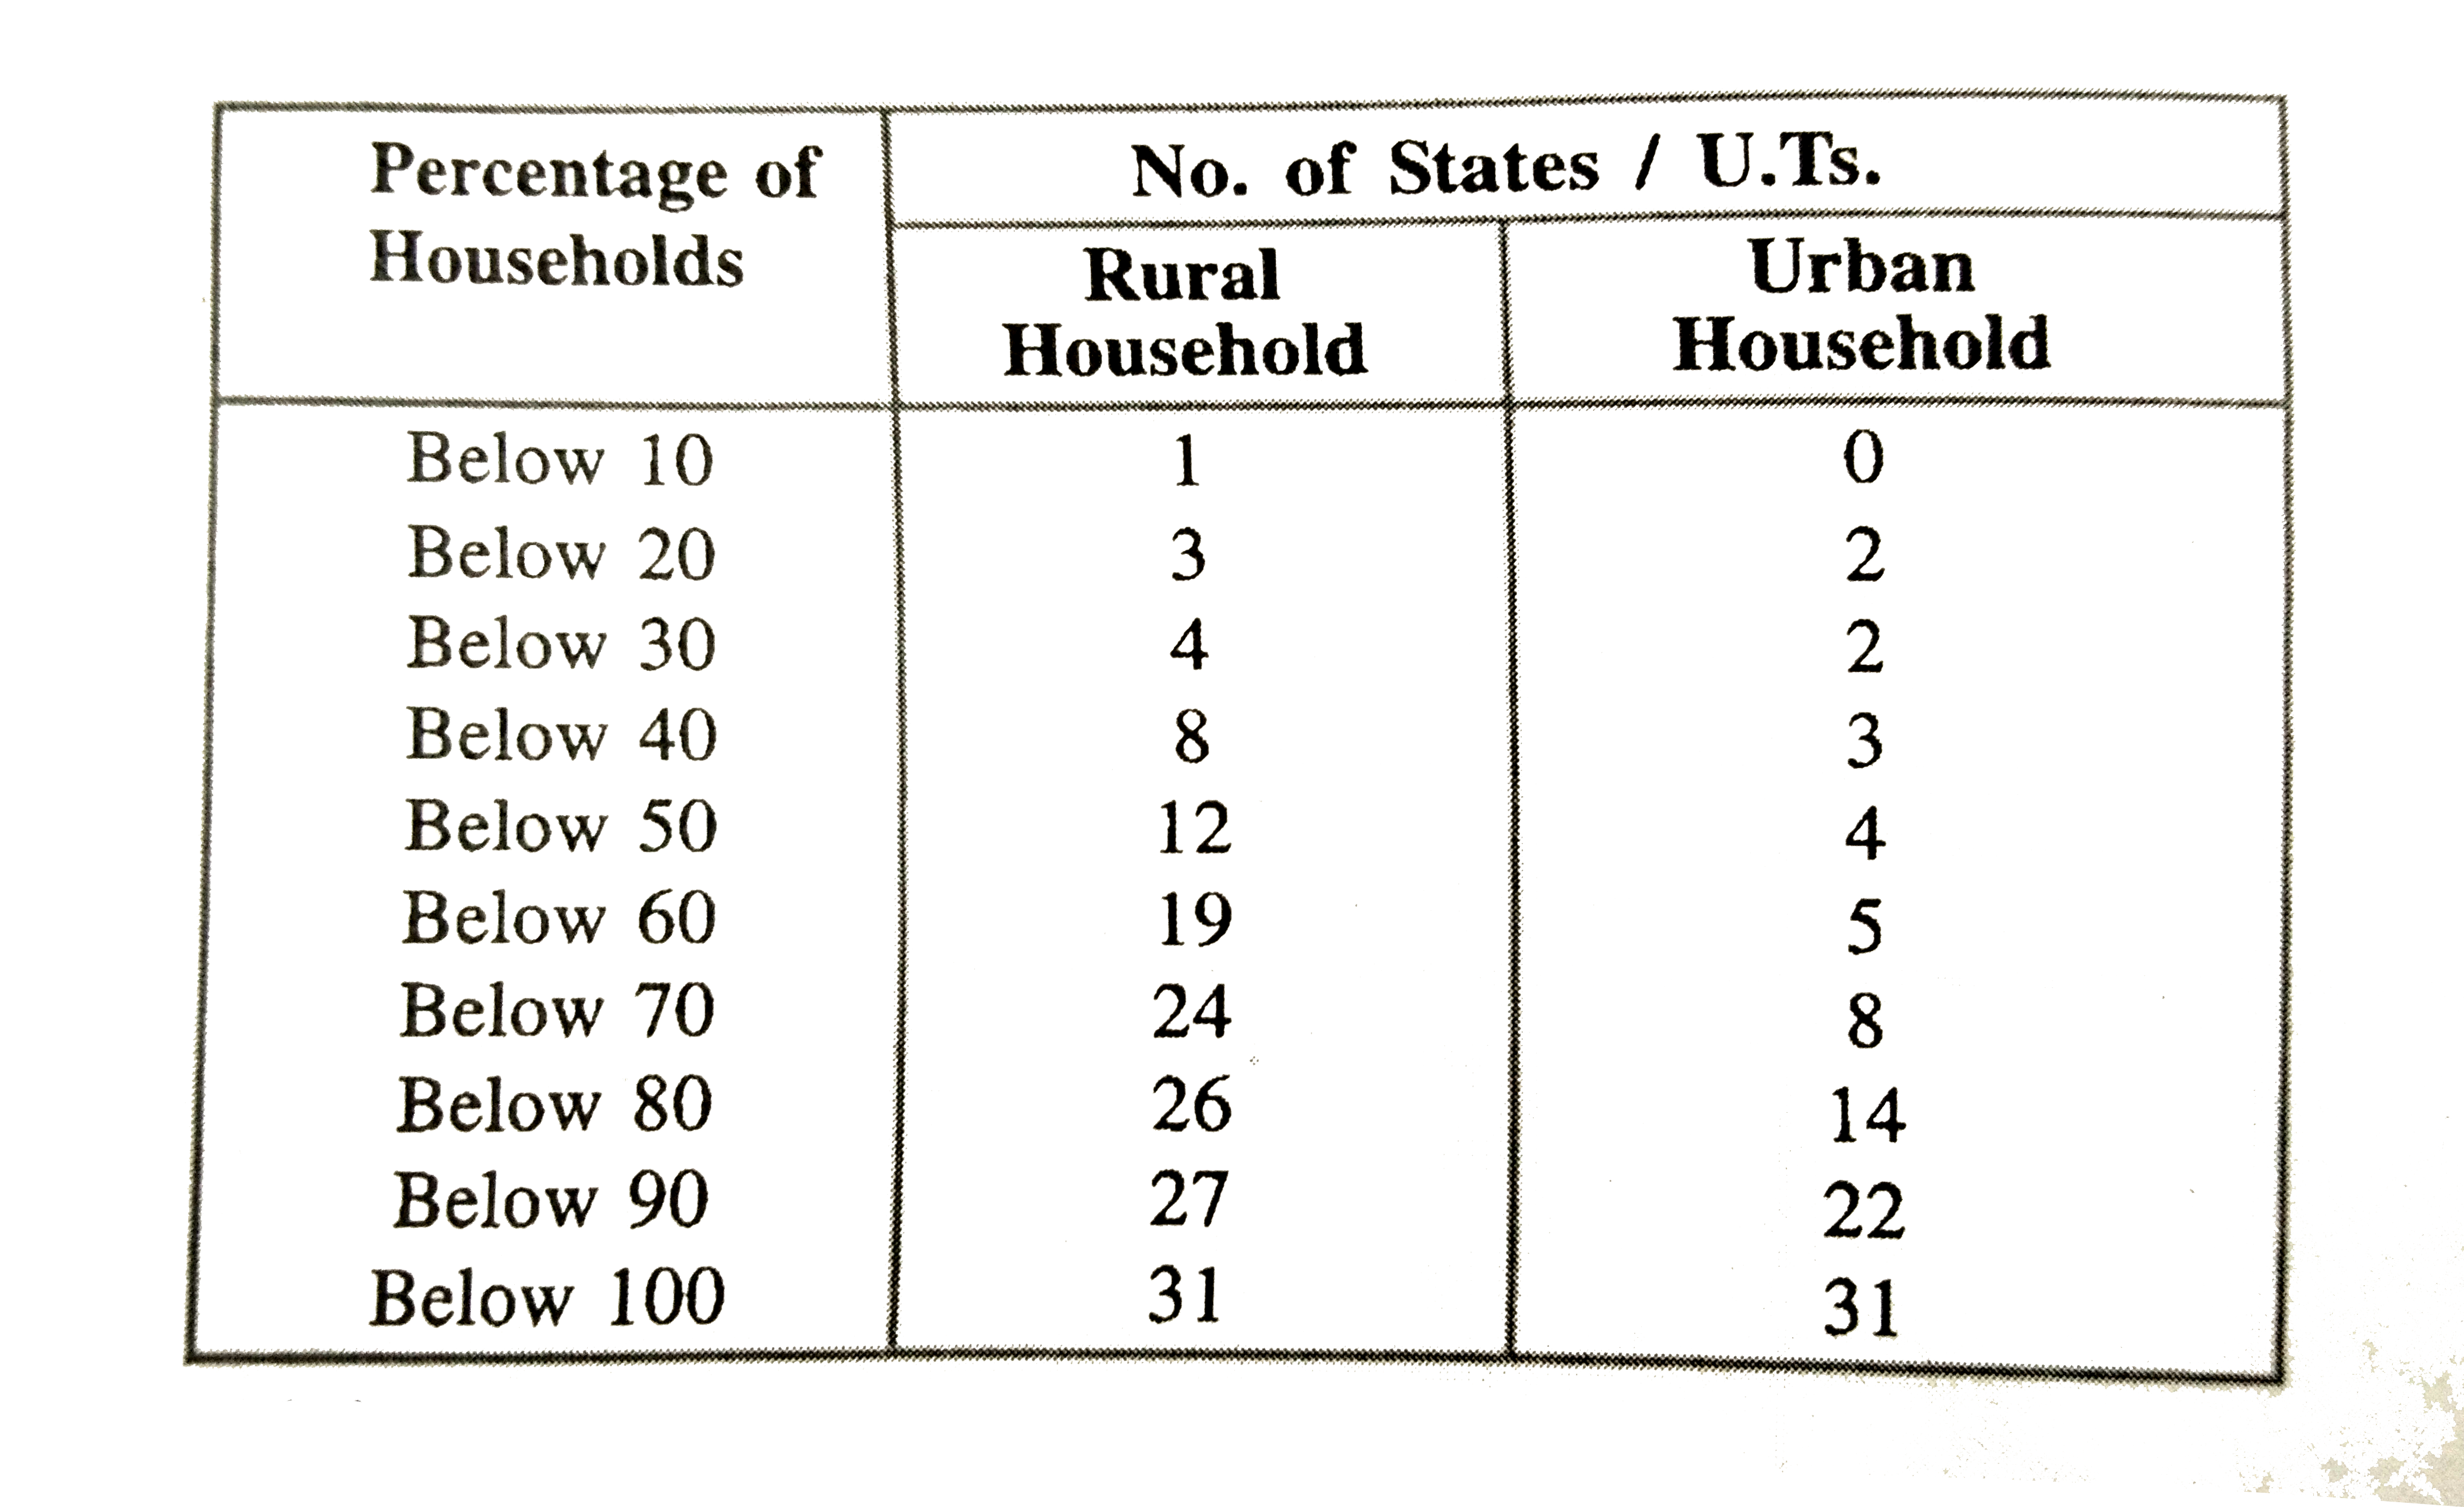 View Solution
The following distribution gives the state-wise teacher-student ratio in higher secondary schools of India. Find the mode and mean of this data. Interpret the two measures.
View SolutionDirections: In the question given below a statements is followed by three courses of action numbered I or (A), II or (B) and III or (C). A course of action is a step or administrative decision to be taken for improvement, follow-up for further action in regards to the problem, policy etc. on the basis of the information given in the statement. you have to assume everything in the statement to be true, then decide which of the three given/suggested courses of action logically follows for pursuing and decide the answer.
Statement : The school dropout rate in many districts in the state has increases sharply during the last few years as the parents of these children make them work in the fields owned by others to earn enough for them to get at least one meal a day.
Courses of action:
(A) The Govt should put up a mechanism to provide food grains to the poor people in these districts through public distribution system to encourage the parents to send their wards to school.
(B) The Govt should close down some of these schools in the district and deploy the teachers of these schools to nearby schools and also ask remaining students to join these schools.
(C) Govt should issue arrest warrants for all the parents who force their children to work in fields instead of attending classes.
1) Only (A)
2) Only (B)
3) Only (C)
4) Only (A) and (B)
5) None of theseView SolutionIn given question, below is given a statement followed by three courses of action marked (A), (B) and (C). A course of action is a step or administrative decision to be taken for improvement, follow up or further action in regard to problem, policy etc:
Statement: The school dropout rate in many districts in the state has increased sharply during the last few years as the parents of these children make them work in the fields owned by others to earn enough for them to get at least one meal a day.
Course of Action:
A. The government should put up a mechanism to provided food grains to the poor people in these districts through public distribution system to encourage the parents to send their wards to school.
B. The government should close down some of these schools in the district and deploy the teachers of these schools to nearby schools and also ask remaining students to join these schools.
C. The government should issue arrest warrants for all the parents who force their children to work in fields instead of attending classes.
(a) Only (A)
(b) Only (B)
(c) Only (C)
(d) Only (A) and (B)
(e) None of theseView Solutioniven below are two pie charts which show the percentage distribution of cricket players and football players in 6 sports club out of the total cricket and football players respectively in these six sports club.
Note : (I) If it is said but that number of players playing either football or circket then it means sum of players playing football and circket.
(2).Number of players plays both games
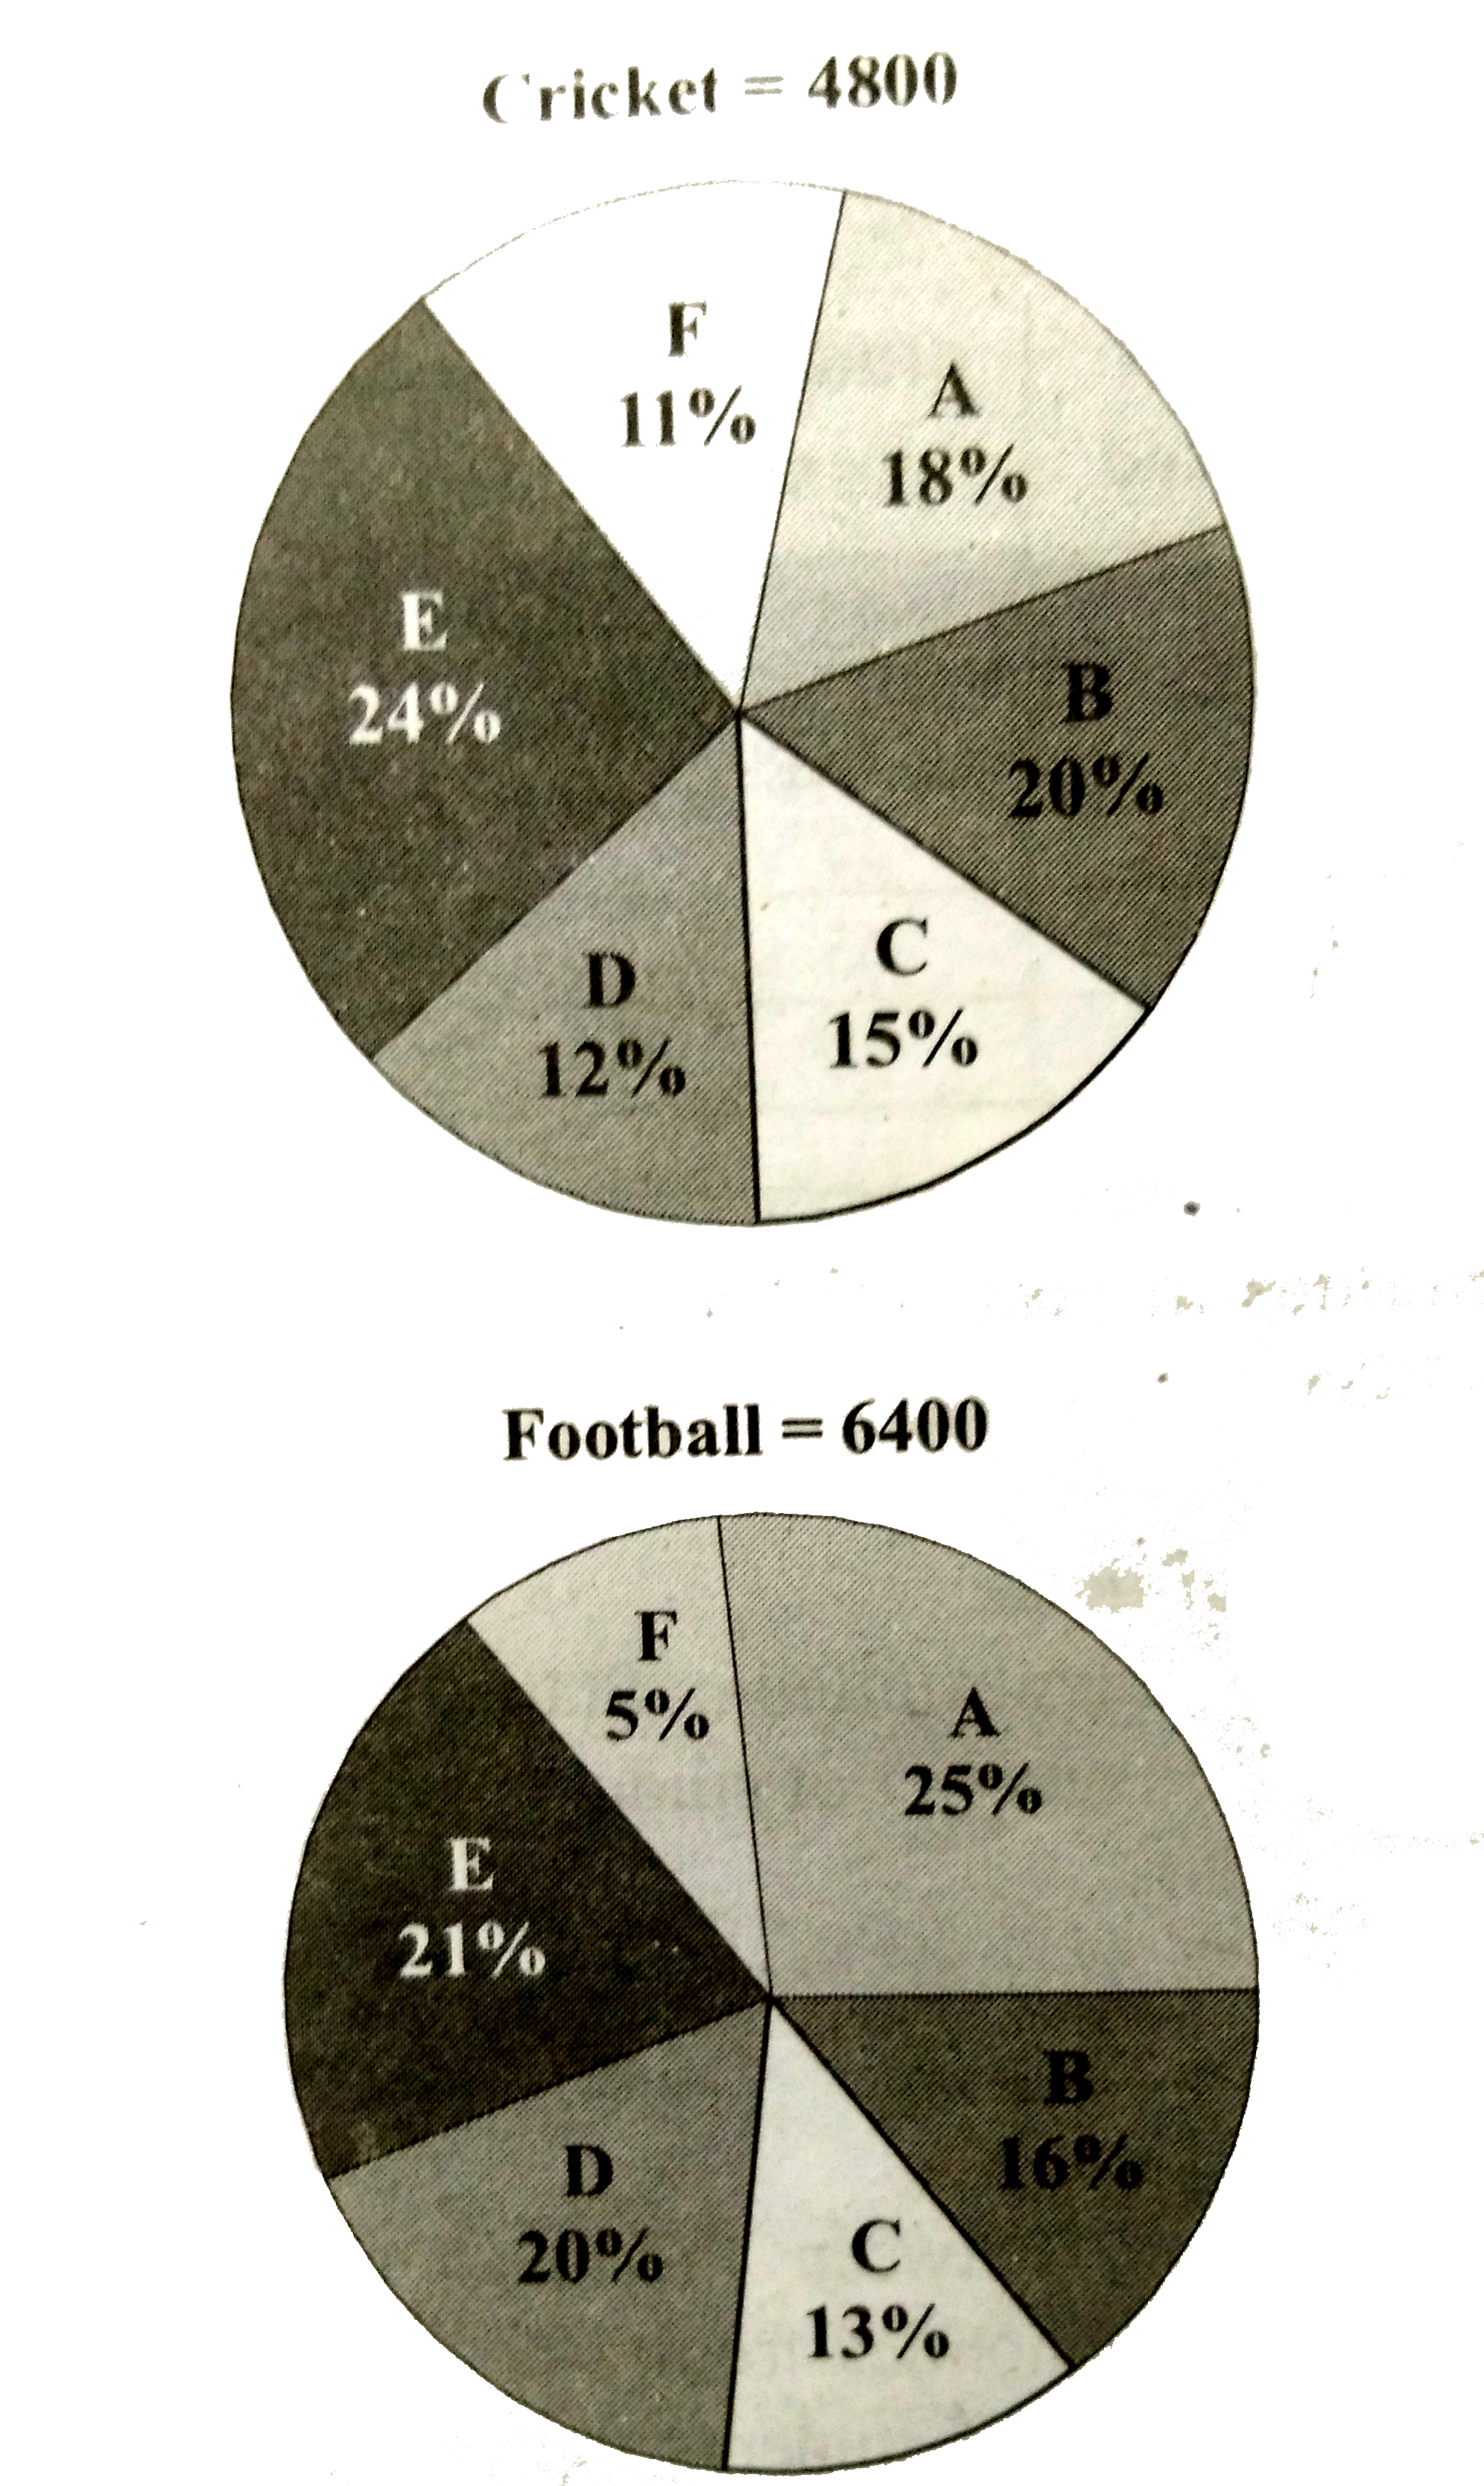
5/12th of club E players playing Cricket are male and 7/13th of club C players playing football are male. find the sum of total number of female players from club E playing Cricket and total females from club C playing Football.View Solution

