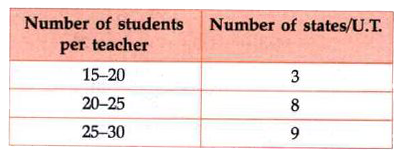
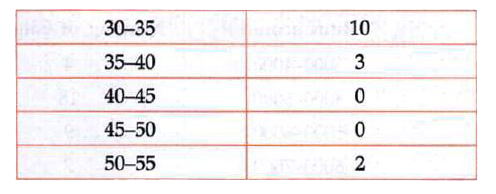
The following distribution gives the state-wise teacher-student ratio in higher secondary schools of India. Find the mode and mean of this data. Interpret the two measures.
To find the mode and mean of the given state-wise teacher-student ratio in higher secondary schools of India, we will follow these steps:
Step 1: Identify the Modal Class
The modal class is the class interval with the highest frequency. From the data provided, we can see that the class with the maximum frequency is 30-35, which has a frequency of 10.
Hint: Look for the frequency that appears most often in the data.
Step 2: Calculate the Mode
The formula for calculating the mode is:
Mode=L+F1−F02F1−F0−F2×H
Where:
- L = lower limit of the modal class
- F1 = frequency of the modal class
- F0 = frequency of the class preceding the modal class
- F2 = frequency of the class succeeding the modal class
- H = width of the class interval
From our data:
- L=30
- F1=10 (frequency of the modal class)
- F0=9 (frequency of the class before the modal class)
- F2=3 (frequency of the class after the modal class)
- H=5 (width of the class interval)
Substituting the values into the formula:
Mode=30+10−92×10−9−3×5
=30+120−9−3×5
=30+18×5
=30+0.625
=30.625
Step 3: Calculate the Mean
To calculate the mean, we first need to find the midpoints of each class interval and then multiply these midpoints by their corresponding frequencies.
1. Calculate Midpoints (xi):
- For class 15-20: x1=15+202=17.5
- For class 20-25: x2=20+252=22.5
- For class 25-30: x3=25+302=27.5
- For class 30-35: x4=30+352=32.5
- For class 35-40: x5=35+402=37.5
- For class 40-45: x6=40+452=42.5
- For class 45-50: x7=45+502=47.5
- For class 50-55: x8=50+552=52.5
2. Multiply Midpoints by Frequencies:
- f1×x1=3×17.5=52.5
- f2×x2=8×22.5=180
- f3×x3=9×27.5=247.5
- f4×x4=10×32.5=325
- f5×x5=3×37.5=112.5
- f6×x6=0×42.5=0
- f7×x7=2×47.5=95
- f8×x8=0×52.5=0
3. Sum of Frequencies and Weighted Frequencies:
- Total of fi×xi=52.5+180+247.5+325+112.5+0+95+0=1112.5
- Total frequency =3+8+9+10+3+0+2+0=35
4. Calculate the Mean:
Mean=∑fixi∑fi=1112.535≈31.7857
Step 4: Interpret the Results
- Mode: The mode of 30.625 indicates that the most common teacher-student ratio in higher secondary schools is approximately 30.625 students per teacher.
- Mean: The mean of approximately 31.79 suggests that, on average, there are about 31.79 students for every teacher across the data set.
The modal class is the class interval with the highest frequency. From the data provided, we can see that the class with the maximum frequency is 30-35, which has a frequency of 10.
The formula for calculating the mode is:
Mode=L+F1−F02F1−F0−F2×H
Where:
- L = lower limit of the modal class
- F1 = frequency of the modal class
- F0 = frequency of the class preceding the modal class
- F2 = frequency of the class succeeding the modal class
- H = width of the class interval
- L=30
- F1=10 (frequency of the modal class)
- F0=9 (frequency of the class before the modal class)
- F2=3 (frequency of the class after the modal class)
- H=5 (width of the class interval)
Mode=30+10−92×10−9−3×5
=30+120−9−3×5
=30+18×5
=30+0.625
=30.625
To calculate the mean, we first need to find the midpoints of each class interval and then multiply these midpoints by their corresponding frequencies.
- For class 15-20: x1=15+202=17.5
- For class 20-25: x2=20+252=22.5
- For class 25-30: x3=25+302=27.5
- For class 30-35: x4=30+352=32.5
- For class 35-40: x5=35+402=37.5
- For class 40-45: x6=40+452=42.5
- For class 45-50: x7=45+502=47.5
- For class 50-55: x8=50+552=52.5
- f1×x1=3×17.5=52.5
- f2×x2=8×22.5=180
- f3×x3=9×27.5=247.5
- f4×x4=10×32.5=325
- f5×x5=3×37.5=112.5
- f6×x6=0×42.5=0
- f7×x7=2×47.5=95
- f8×x8=0×52.5=0
- Total of fi×xi=52.5+180+247.5+325+112.5+0+95+0=1112.5
- Total frequency =3+8+9+10+3+0+2+0=35
Mean=∑fixi∑fi=1112.535≈31.7857
- Mode: The mode of 30.625 indicates that the most common teacher-student ratio in higher secondary schools is approximately 30.625 students per teacher.
- Mean: The mean of approximately 31.79 suggests that, on average, there are about 31.79 students for every teacher across the data set.
Similar Questions
The following distribution gives the state-wise teacher-student ratio in higher secondary schools of India. Find the mode and mean of this data. Interprent the two measures.

 View Solution
Find the mean, mode and median of the following data:
 View Solution
The following table shows the ages of the patients admitted in a hospital during a year:Find the mode and the mean of the data given above. Compare and interpret the two measures of central tendency.
View SolutionThe following frequency distribution table gives the ages of 200 patients treated in a hospital in a week. Find the mode of ages of the patients.
 View Solution
The following frequency distribution table gives the ages of 200 patients treated in a hospital in a weak. Find the mode of ages of the patients.
 View Solution
The following frequency distribution gives the monthly consumption of electricity of 68 consumers of a locality. Find the median, mean and mode of the data and compare them.
 View Solution
Following data gives the marks obtained by 100 students in a test. Find the median
 View Solution
The following frequency distribution gives the monthly consumption of electricity of 68 consumers of a locality. Find the median, mean and mode of the data and compare them.
 View Solution
Find the mean, median and mode of the following data.
 View Solution
Find the mean, median and mode of the following data
 View Solution

