The table below shows the yield of jowar per acre. Show the data by histogram.

Step by step video & image solution for The table below shows the yield of jowar per acre. Show the data by histogram. by Maths experts to help you in doubts & scoring excellent marks in Class 10 exams.
Topper's Solved these Questions
- BOOK - TARGET PUBLICATIONCHAPTER - STATISTICSEXERCISE - Practise Set 6.52videos
STATISTICS
- BOOK - TARGET PUBLICATIONCHAPTER - STATISTICSEXERCISE - Practise Set 6.66videos
STATISTICS
- BOOK - TARGET PUBLICATIONCHAPTER - STATISTICSEXERCISE - Practise Set 6.34videos
STATISTICS
- BOOK - TARGET PUBLICATIONCHAPTER - SIMILARITY EXERCISE - Chapter Assessment19videos
SIMILARITY
- BOOK - TARGET PUBLICATIONCHAPTER - TRIGONOMETRY EXERCISE - Chapter Assessment18videos
TRIGONOMETRY
Similar Questions
Knowledge Check
- Question 1 - Select One
Question Stimulus :-
The table shows the scores of 20 students on a history test. .....histogram is the exact representation of the data.A B
B C
C D
D
- Question 2 - Select One
A survey asked a group of 1000 people what type of bread they like best. The table below shows their preferences.
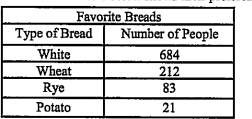
Which one of the following graphs best represents the data in this table?A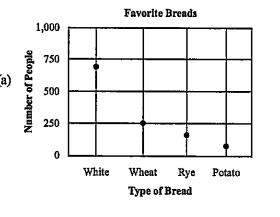 B
B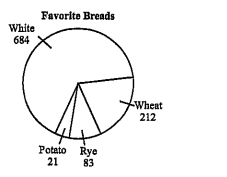 C
C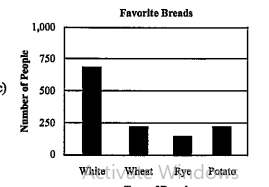 DNONE OF THESE
The table below shows the saleries of 280 persons.
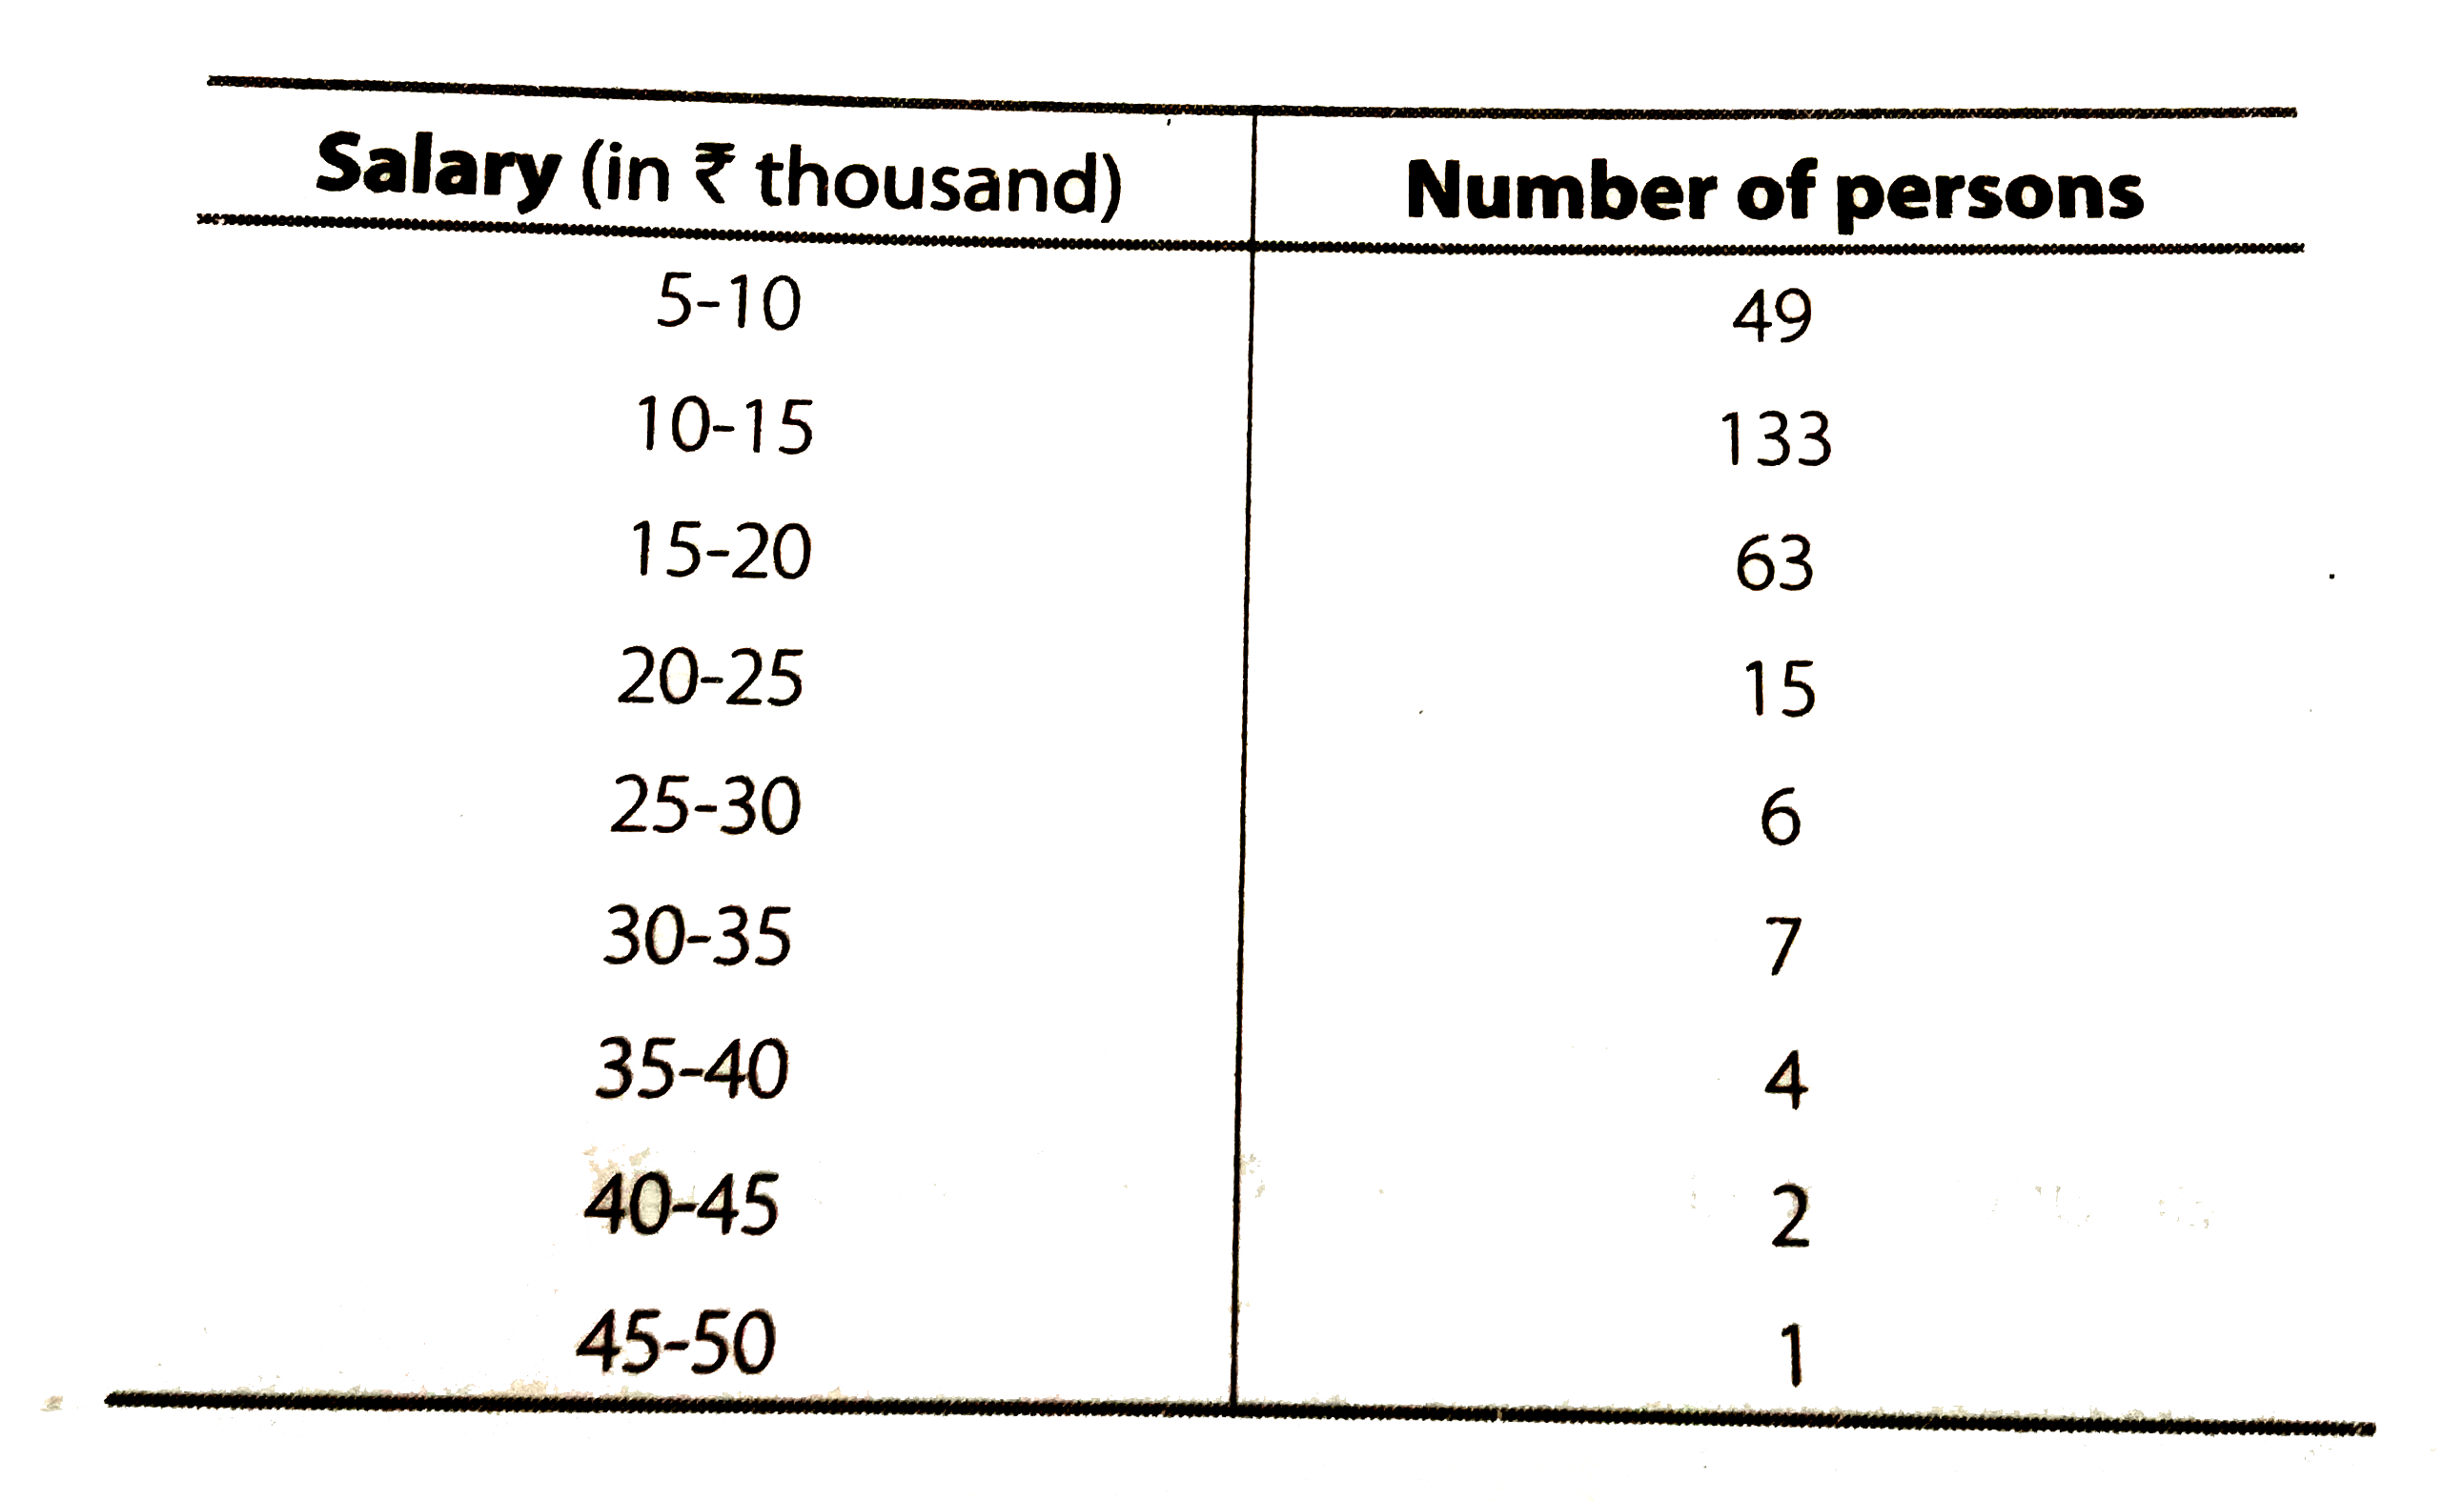 View Solution
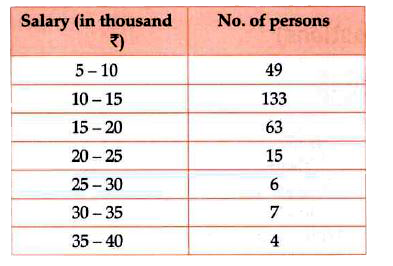
The table below shows the salaries of 280 persons:
View SolutionThe table below show the salaries of 280 persons:
Calculate the median salary of the data.
 View Solution
The table below shows the salaries of 280 persons.
Calculate the median and mode of the data.
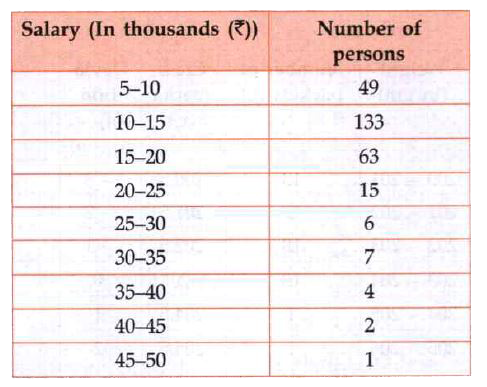 View Solution
The table below shows Salary of 280 persons. Calculate the median salary of the data.
View SolutionThe table below shows the data on likely heights of boys and girls as they grow in age. Draw graphs of height and age for both boys and girls on the same graph paper. What conclusions can be drawn from these graphs?
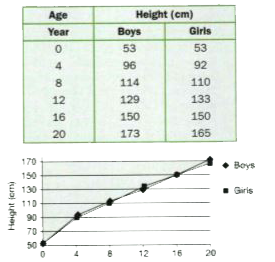 View Solution


