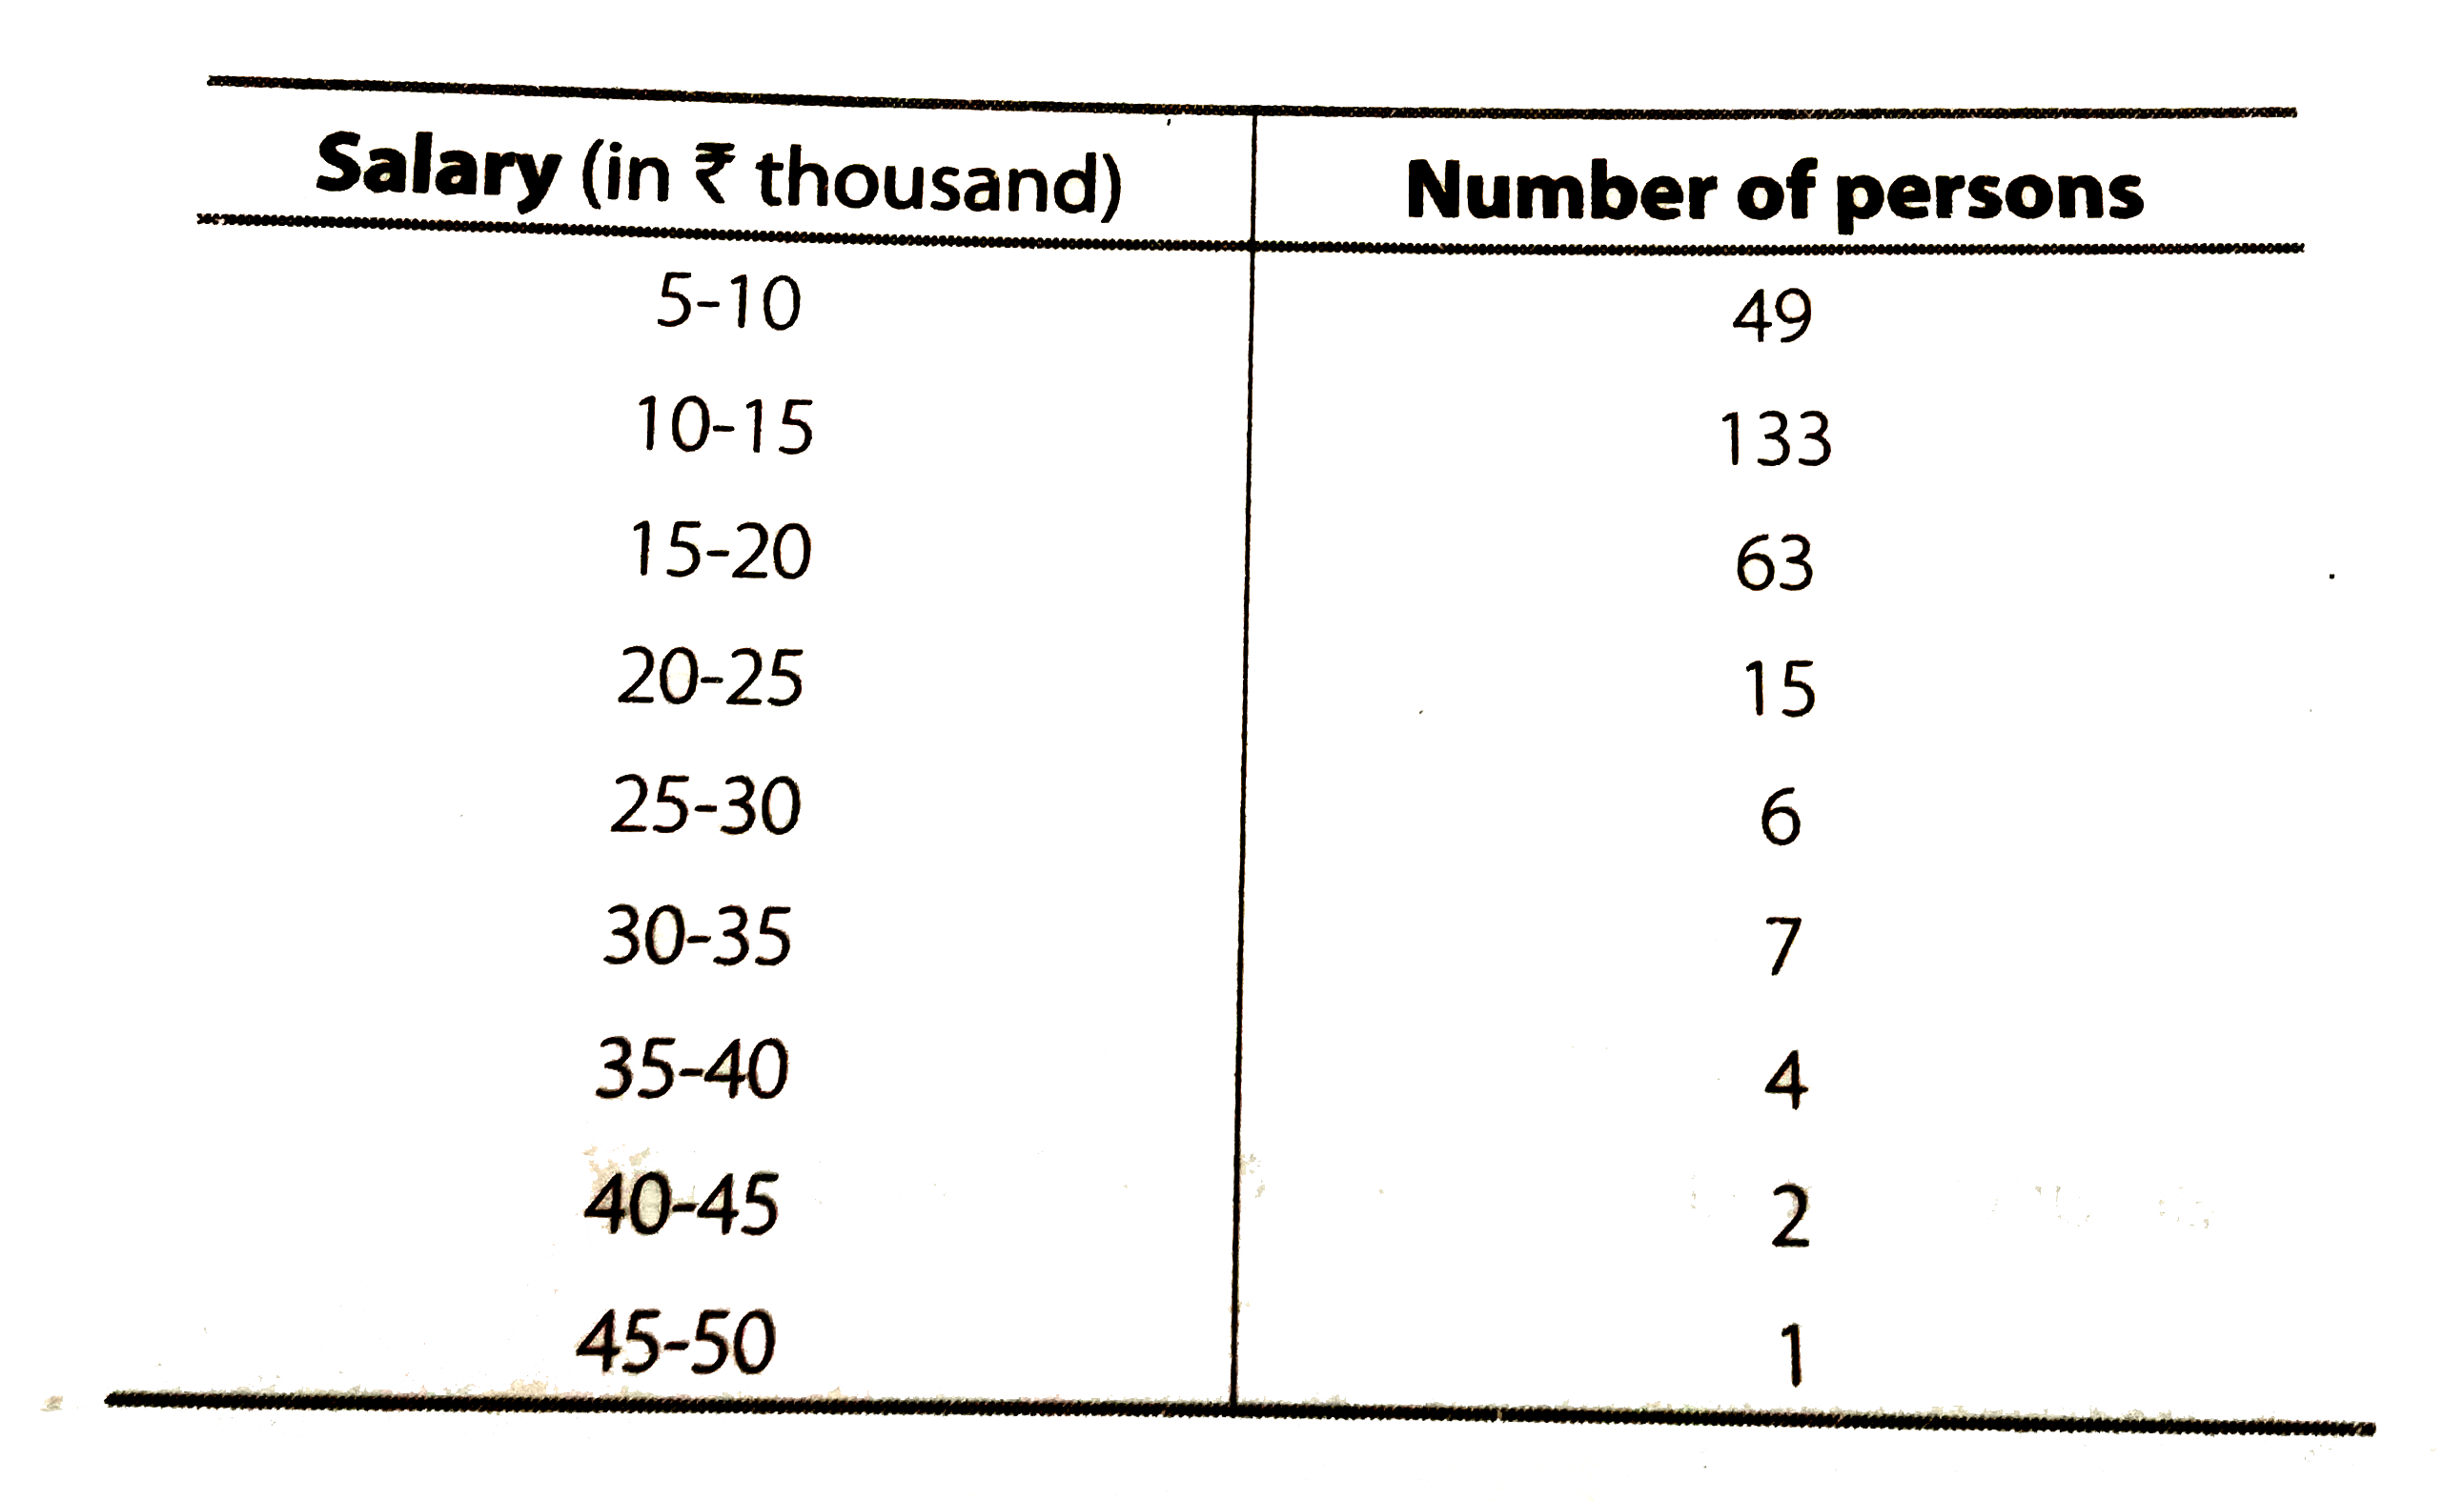
The table given below shows the expenditures on different component of a person. What was the total expenditure of the person?
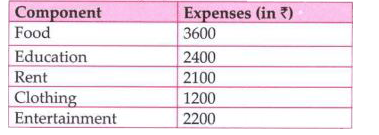
Step by step video & image solution for The table given below shows the expenditures on different component of a person. What was the total expenditure of the person? by Maths experts to help you in doubts & scoring excellent marks in Class 7 exams.
Topper's Solved these Questions
- BOOK - MTG IIT JEE FOUNDATIONCHAPTER - DATA HANDLINGEXERCISE - Exercise (Level - 2) ( Long Answer Type )2videos
DATA HANDLING
- BOOK - MTG IIT JEE FOUNDATIONCHAPTER - DATA HANDLINGEXERCISE - Exercise (Level - 2) Subjective Problems10videos
DATA HANDLING
- BOOK - MTG IIT JEE FOUNDATIONCHAPTER - DATA HANDLINGEXERCISE - Exercise (Level - 2) Subjective Problems ( Shor Answer Type )9videos
DATA HANDLING
- BOOK - MTG IIT JEE FOUNDATIONCHAPTER - CONGRUENCE OF TRIANGLES EXERCISE - Olympiad/HOTS Corner10videos
CONGRUENCE OF TRIANGLES
- BOOK - MTG IIT JEE FOUNDATIONCHAPTER - EXPONENTS AND POWERSEXERCISE - OLYMPIAD/HOTS CORNER15videos
EXPONENTS AND POWERS
Similar Questions
Knowledge Check
- Question 1 - Select One
The given pie chart shows the distribution of expenditure of a company (in percentage) . The total expenditure of the company is Rs. 136000.
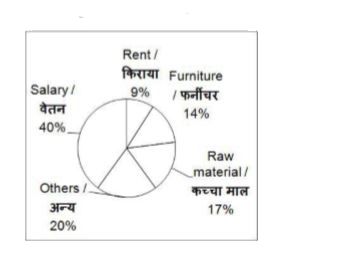
What is the difference (in degrees) in the central angles formed by the total expenditure incurred on Furniture and Rent and expenditure incurred on Others?A10.8B11.2C39.6D27.4 - Question 2 - Select One
The given pie chart shows the distribution of expenditure of a company (in percenatge). The total expenditure of the company is Rs. 136000.
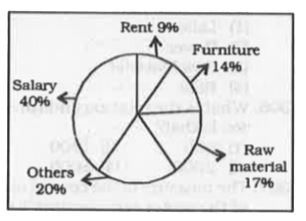
What is the difference (in degrees) in the central angles formed by the total expenditure incurred on Furniture and Rent and expenditure incurred on Others?A10.8B11.2C39.6D27.4 - Question 3 - Select One
The given pie chart shows the distribution of expenditure of a company (in percentage) . The total expenditure of the company is Rs. 136000.
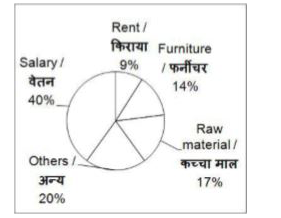
What will be the ratio of the expenditure incurred on Salary to the expenditure incurred on Rent?A10:9B31:5C40:9D5:31
The table below shows the saleries of 280 persons.
 View Solution
The given pie chart shows the distribution of expenditure of a company (in percenatge). The total expenditure of the company is Rs. 136000.
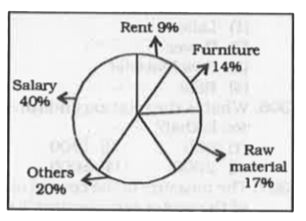
By what amount (in Rs.) expenditure on Raw Material is more than the expenditure on Rent?View SolutionThe given pie chart shows the distribution of expenditure of a company (in percenatge). The total expenditure of the company is Rs. 136000.
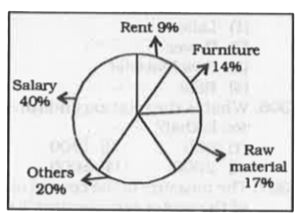
What will be the ratio of the expenditure incurrd on Salary to the expenditure incurred on Rent?View SolutionThe given pie chart shows the distribution of expenditure of a company (in percentage) . The total expenditure of the company is Rs. 136000.
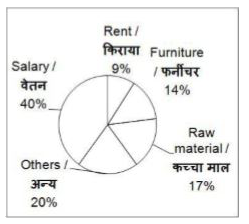
What is the total expenditure (in Rs) incurred on Furniture and Others by the company?View SolutionThe given pie chart shows the distribution of expenditure of a company (in percenatge). The total expenditure of the company is Rs. 136000.
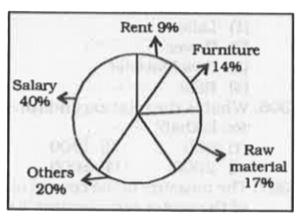
What is the total expenditure (in Rs.) incurred on Furniture and Others by the company?View Solution


