The total expenditure incurred by an industry under different heads is best presented as a
pie diagram
histogram
frequency polygon
bar graph
The correct Answer is:A
Step by step video, text & image solution for The total expenditure incurred by an industry under different heads is best presented as a by Maths experts to help you in doubts & scoring excellent marks in Class 12 exams.
Updated on:21/07/2023Topper's Solved these Questions
- STATISTICS BOOK - ARIHANT PUBLICATION JHARKHANDCHAPTER - STATISTICS EXERCISE - Exam Booster for Cracking Exam
25 Videos
- SOLVED PAPER 2019BOOK - ARIHANT PUBLICATION JHARKHANDCHAPTER - SOLVED PAPER 2019EXERCISE - SECTION I: MATHEMATICS
48 Videos
- TAXATION BOOK - ARIHANT PUBLICATION JHARKHANDCHAPTER - TAXATION EXERCISE - EXAM BOOSTER
14 Videos
Similar Questions
The total expenditure to be incurred by a family on a good is bound to increase when price of such good rises. Comment.
View SolutionThe Pie-chart given below shows the figures of various heads of expenditure incurred by Anurag in a year. In how many heads is his expenditure less than the expenditure he incurred on tax?
नीचे दिया गया वृत्त आरेख अनुराग द्वारा किसी वर्ष में किए गए व्यय के विभिन्न शीर्षों के आंकड़ों को दर्शाता है | उसके द्वारा टैक्स पर किए गए व्यय की तुलना में कितने शीर्षों में उसके व्यय कम हैं ?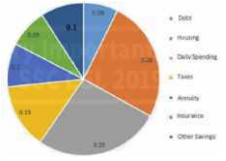
View Solution
Knowledge Check
The pie chart given here shows the breakup of the cost of construction of a house on various heads. Study the chart and answer the questions.
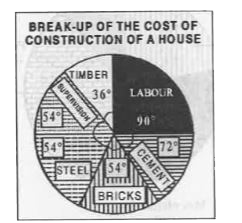
The total expenditure incurred on bricks, steel and cement is what per cent of the total cost of construction ?A50%B54%C72%D75%The given pie chart shows the distribution of expenditure of a company (in percenatge). The total expenditure of the company is Rs. 136000.
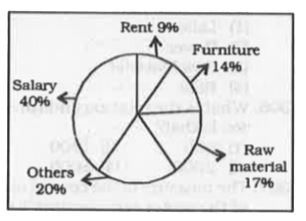
What is the difference (in degrees) in the central angles formed by the total expenditure incurred on Furniture and Rent and expenditure incurred on Others?A10.8B11.2C39.6D27.4The given pie chart shows the distribution of expenditure of a company (in percentage) . The total expenditure of the company is Rs. 136000.
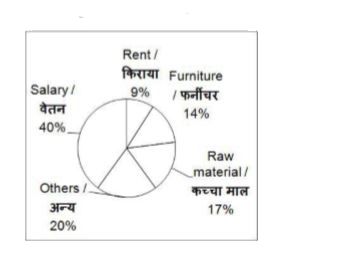
What is the difference (in degrees) in the central angles formed by the total expenditure incurred on Furniture and Rent and expenditure incurred on Others?A10.8B11.2C39.6D27.4
The following pie chart depicts the expenditure of a state government under different heads,
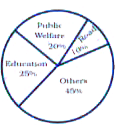
If the total spending is 10 crores, how much 20% do money was spent on roads?
View SolutionThe pie-diagram shows the expenditure incurred on the printing of a book by a publisher, under various heads. Study the pie-digram and answer the questions.
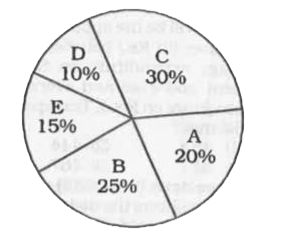
If the expenditure incurred on the printing under head A is Rs. 5000, then the sum of expenditure incurred under heads B and D is:
View SolutionThe following pie chart shows percentage expenditure of a country on different heads .The total expenditure is Rs. 1,680 (in billions).Study the chart and answer the question.
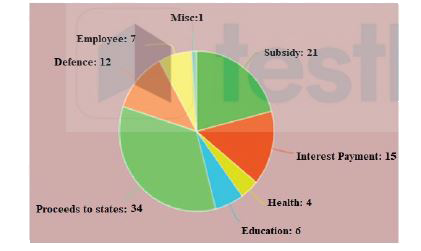
The total amount of expenditure for education and Health (in billions Rs. )is:
View SolutionThe following pie chart shows percentage expenditure of a country on different heads .The total expenditure is Rs. 1.680 (in billions ). Study chart and answer the question .
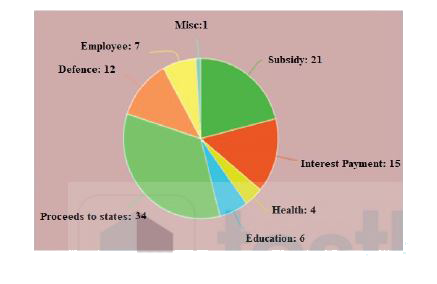
The amount of expenditure on Defence is what percentage more than the expenditure on Education ?
View SolutionThe following pie chart shows percentage expenditure of a country on different heads .The total expenditure is Rs. 1,680 (in billions).Study the chart and answer the question.
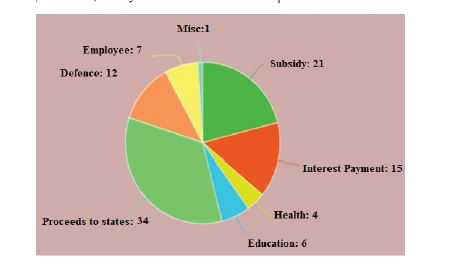
The central angle of the sector representing expenditure on Subsidy is :
View Solution
