The Pie-chart given below shows the figures of various heads of expenditure incurred by Anurag in a year. In how many heads is his expenditure less than the expenditure he incurred on tax?
नीचे दिया गया वृत्त आरेख अनुराग द्वारा किसी वर्ष में किए गए व्यय के विभिन्न शीर्षों के आंकड़ों को दर्शाता है | उसके द्वारा टैक्स पर किए गए व्यय की तुलना में कितने शीर्षों में
उसके व्यय कम हैं ?
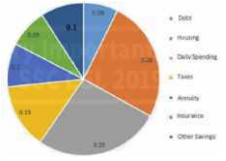
2
1
4
3
The correct Answer is:C
Step by step video & image solution for The Pie-chart given below shows the figures of various heads of expenditure incurred by Anurag in a year. In how many heads is his expenditure less than the expenditure he incurred on tax? नीचे दिया गया वृत्त आरेख अनुराग द्वारा किसी वर्ष में किए गए व्यय के विभिन्न शीर्षों के आंकड़ों को दर्शाता है | उसके द्वारा टैक्स पर किए गए व्यय की तुलना में कितने शीर्षों में उसके व्यय कम हैं ? by Maths experts to help you in doubts & scoring excellent marks in Class 14 exams.
Updated on:21/07/2023Topper's Solved these Questions
Similar Questions
The Pie chart given below presents the figures of different heads of expenditure made in a year by Anurag. If his total annual income is Rs1,20,000, then how much did he spend on Housing?
नीचे दिया गया वृत्त आरेख एक वर्ष में अनुराग के द्वारा किये गए विभिन्न प्रकार के व्ययों को दर्शाता है | यदि उसकी कुल वार्षिक आय 1,20,000 है, तो उसने आवास पर कितना खर्च किया ?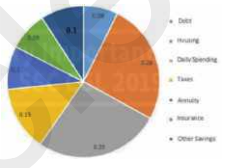
View SolutionThe given pie chart depicts the expenditure incurred in crores towards each sport.
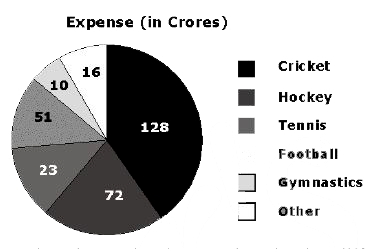
In the given pie chart what is the difference between the expenditure incurred on cricket on football
View Solution
Knowledge Check
The given pie-chart shows the expenditure incurred in making a book.
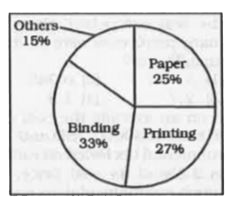
The expenditure on Binding is how much per cent more than the expenditure on Paper?A32B24.24C28.18D34The given pie-chart shows the breakup (in percentage) of monthly expenditure of a person.
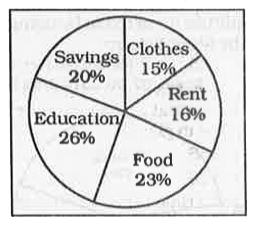
If the expenditure incurred on Clothes is Rs. 3000, what is the expenditure (in Rs.) incurred on Education?A4300B5050C5200D5600
The pie-chart given below shows the expenses incurred by various departments of a company. Each expense is shown as a percentage of the company.s total expenditure. The central angles shown in the pie-chart are not according to any selected scale.
नीचे दिया गया वृत्त आरेख किसी कंपनी के विभिन्न विभागों द्वारा किए खर्चों को दर्शाता है | प्रत्येक खर्च को कंपनी के कुल व्यय के प्रतिशत के रूप में दर्शाया गया है | वृत्त आरेख में दर्शाए गए केंद्रीय कोण किसी चयनित पैमाने के अनुसार नहीं हैं |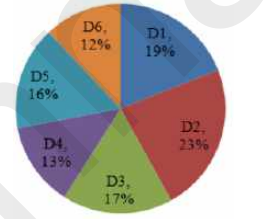 What is the difference ( nearest to 0.1 degrees ) between the central angles subtended by the sectors D2 and D3 ?
वृत्तखंड D2 तथा D3 द्वारा बनाये गए केंद्रीय कोणों के बीच क्या अंतर (0.1 डिग्री के लगभग) है?
View SolutionThe pie-chart given below shows the expenses incurred by various departments of a company. Each expense is shown as a percentage of the company.s total expenditure. The central angles shown in the pie-chart are not according to any selected scale.
नीचे दिया गया वृत्त आरेख किसी कंपनी के विभिन्न विभागों द्वारा किए खर्चों को दर्शाता है | प्रत्येक खर्च को कंपनी के कुल व्यय के प्रतिशत के रूप में दर्शाया गया है | वृत्त आरेख में दर्शाए गए केंद्रीय कोण किसी चयनित पैमाने के अनुसार नहीं हैं |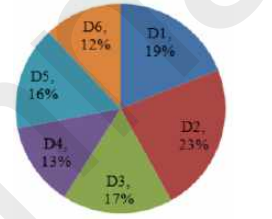 If the total expenses of the company is 20 lacs, then find the total expenses incurred on the
departments D2, D4 and D5.
यदि कंपनी के कुल खर्चे रु 20 लाख हैं, तो D2, D4 तथा D5 विभागों पर किया गया कुल खर्चा कितना है ?
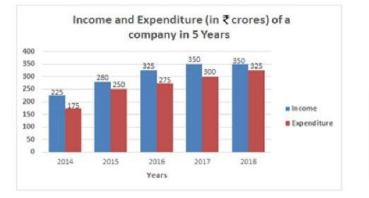
View SolutionThe given Bar Graph presents Income and Expenditure (in crores of Rupees) of a company for five years, 2014 to 2018. In which year is the Expenditure more than 40% as compared to the Expenditure in the previous year? दिया गया दंड आरेख (बार ग्राफ) 5 वर्षो, 2014 से 2018 के दौरान किसी कंपनी की आय और व्यय (करोड़ रुपए में) को दर्शाता है| पिछले वर्ष के व्यय की तुलना में किस वर्ष में वह 40% अधिक है?
View SolutionThe bar graph given below shows the wheat production (in tonnes) of a large farm during the year 2011-2018. In how many years was wheat production higher than the average production of the period?
नीचे दिए गए दंड आरेख में वर्ष 2011-2018 के दौरान किसी बड़े फार्म के गेहूं उत्पादन (टन में) को दर्शाया गया है | अवधि के औसत उत्पादन की तुलना में दिए गए कितने वर्षो में गेहूं उत्पादन अधिक था ?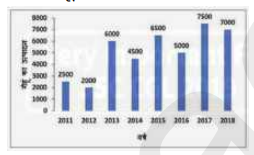
View SolutionThe pie-chart below shows the percentage figures of eggs consumed in terms of total consumption of eggs by nine different countries. What is the central angle (nearest to 0.1 degree) of the sector for Lithuania?
नीचे दिया गया वृत्त आरेख नौ भिन्न देशों द्वारा किए गए अंडों के कुल उपभोग के संदर्भ में, अंडों के उपभोग के प्रतिशत आंकड़ों को दर्शाता है | लिथुआनिया के लिए वृत्तखंड का केंद्रीय कोण (0.1 डिग्री के निकटतम) क्या है ?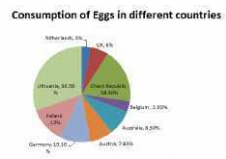
View SolutionThe pie-chart given below shows the number of laptops in an office provided by six different companies in the percentage of total number of laptops. The central angles given in the pie chart are not accurate to any scale.
नीचे दिया गया वृत्त-आरेख, छह अलग-अलग कम्पनियों द्वारा किसी कार्यालय में प्रदत्त लैपटॉप की संख्या को, लेपटॉपों की कुल संख्या के प्रतिशत के रूप में दर्शाता है | वृत्त-आरेख में प्रदर्शित केंद्रीय कोण किसी चयनित पैमाने के अनुसार नहीं है |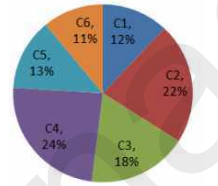 If the total number of laptops in office is 3800, then find the difference between the laptops of
company C2 and C5 ?
कार्यालय में यदि लैपटॉपों की कुल संख्या 3800 है तो कंपनी C2 तथा C5 के लैपटॉपों की संख्या में अंतर कितना है ?
View Solution
