Time taken is seconds by 25 students in an examination to solve certain question is given below.
20,16,20,27,28,30,33,57,50,40,42,46,28,43,46,46,48,49,52,58,59,60,64,52.
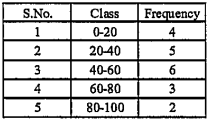
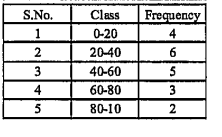
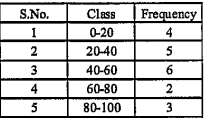
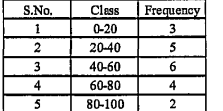
By taking class interval of size 10, make a frequency distribution table.
The correct Answer is:(##DBTSMMATIXC14E03002_A01##)
To create a frequency distribution table for the given time taken by 25 students, we will follow these steps:
Step 1: Determine the Class Intervals
We need to create class intervals of size 10. The smallest value in the data is 16 and the largest value is 64. Therefore, we can create the following class intervals:
- 10 to 20
- 20 to 30
- 30 to 40
- 40 to 50
- 50 to 60
- 60 to 70
Step 2: Count the Frequencies
Now, we will count how many values fall into each class interval.
- Class Interval 10 to 20: Values are 16 (1 value)
- Class Interval 20 to 30: Values are 20, 20, 27, 28 (4 values)
- Class Interval 30 to 40: Values are 30, 33 (2 values)
- Class Interval 40 to 50: Values are 40, 42, 46, 46, 46 (5 values)
- Class Interval 50 to 60: Values are 50, 52, 52, 58, 59, 60 (6 values)
- Class Interval 60 to 70: Values are 64 (1 value)
Step 3: Create the Frequency Distribution Table
Now, we can compile the class intervals and their corresponding frequencies into a table.
| Class Interval | Frequency |
|----------------|-----------|
| 10 - 20 | 1 |
| 20 - 30 | 4 |
| 30 - 40 | 2 |
| 40 - 50 | 5 |
| 50 - 60 | 6 |
| 60 - 70 | 1 |
Final Frequency Distribution Table
The final frequency distribution table is as follows:
| Class Interval | Frequency |
|----------------|-----------|
| 10 - 20 | 1 |
| 20 - 30 | 4 |
| 30 - 40 | 2 |
| 40 - 50 | 5 |
| 50 - 60 | 6 |
| 60 - 70 | 1 |
We need to create class intervals of size 10. The smallest value in the data is 16 and the largest value is 64. Therefore, we can create the following class intervals:
- 10 to 20
- 20 to 30
- 30 to 40
- 40 to 50
- 50 to 60
- 60 to 70
Now, we will count how many values fall into each class interval.
- Class Interval 20 to 30: Values are 20, 20, 27, 28 (4 values)
- Class Interval 30 to 40: Values are 30, 33 (2 values)
- Class Interval 40 to 50: Values are 40, 42, 46, 46, 46 (5 values)
- Class Interval 50 to 60: Values are 50, 52, 52, 58, 59, 60 (6 values)
- Class Interval 60 to 70: Values are 64 (1 value)
Now, we can compile the class intervals and their corresponding frequencies into a table.
|----------------|-----------|
| 10 - 20 | 1 |
| 20 - 30 | 4 |
| 30 - 40 | 2 |
| 40 - 50 | 5 |
| 50 - 60 | 6 |
| 60 - 70 | 1 |
The final frequency distribution table is as follows:
|----------------|-----------|
| 10 - 20 | 1 |
| 20 - 30 | 4 |
| 30 - 40 | 2 |
| 40 - 50 | 5 |
| 50 - 60 | 6 |
| 60 - 70 | 1 |
Topper's Solved these Questions
- BOOK - CBSE COMPLEMENTARY MATERIALCHAPTER - STATISTICSEXERCISE - PART D3videos
STATISTICS
- BOOK - CBSE COMPLEMENTARY MATERIALCHAPTER - STATISTICSEXERCISE - PRACTICE TEST5videos
STATISTICS
- BOOK - CBSE COMPLEMENTARY MATERIALCHAPTER - STATISTICSEXERCISE - PART B9videos
STATISTICS
- BOOK - CBSE COMPLEMENTARY MATERIALCHAPTER - QUARILATERAL EXERCISE - Part - D5videos
QUARILATERAL
- BOOK - CBSE COMPLEMENTARY MATERIALCHAPTER - SURFACE AREAS AND VOLUMESEXERCISE - Practice Test8videos
SURFACE AREAS AND VOLUMES
Similar Questions
We are given the following marks secured by 25 students in an examination .
23,28,30,32,35,36,36,40,41,43,44,44,45,48,49,52,53,54,56,56,58,61,62,65,68.
(i)Arrange this data in the form of a frequency distribution taking the following class intervals.
20-29,30-39,40-49,50-59, and 60-69
(ii) Draw the frequency polygon and ogive for the above data.View SolutionThe marks obtained by 40 students of a class in an examination are given below,
8,47,22,31,17,13,38,26,3,34,29,11,22,7,15,24,38,31,21,35,42,24,45,23,21,27,29,49,25,48,21,15,18,27,19,45,14,34,37,34.
Prepare a frequency distribution table with equal class intervals starting from 0-10 (where 10 is not included).View Solution
Knowledge Check
- Question 1 - Select One
20 students of a class obtained following respective marks out of 100 marks in subject Mathematics:54,46,24,36,84,70,16,58,6,82,44,54.32,64.8,66,52,28,16 and 30 Grouped frequency distribution table of above will be
A B
B C
C D
D
- Question 2 - Select One
The marks obtained by 20 students of a class in a test (out of 50) are given below : 40, 44, 45, 46, 50, 42, 41, 8, 26, 28, 9, 32, 24, 6, 42, 36, 39.
The range of the data isA44B54C90D10
The marks obtained by 40 students of class IX in an examination are given below 18, 8, 12,6, 8, 16, 12,5, 23, 2, 16, 23, 2, 10, 20, 12,9,7,6,5,3,5, 13,21, 13, 15,20, 24, 1,7,21, 16, 13, 18, 23,7,3, 18, 17, 16. Present the data in the form of a frequency distribution using the same class size, one such cliess being 15-20 (where 20 is not included)
View SolutionThe marks obtained by 40 students of class IX in an examination are given below:
23,5,12,16,8,6,12,8,18,2,16,10,2,23,7,9,12,20,0,3,5,16,18,3,17,7,23,18,13,10,21,7,1,24,20,15,13,21,13,5.
Present the data in the form of a frequency distribution using the same class size, starting with class 0-5 (where 5 is not included.)View SolutionThe marks obtained by 40 students of class VIII in an examination are given below: 18,8,12,0,8,16,12,5,23,2,16,23,2,10,20,12,9,7,6,5,3,5, 13,21,13,15,20,24,1,7,21,16,13,18,23,7,3,18,17,16 Present the data in the form of a frequency distribution using the same class size, one such class being 15-20 (where 20 is not included).
View SolutionThe marks scored by 40 students of class VIII in mathematics are given below: 81,55,68,79,85,43,29,68,54,73,47,35,72,64,95,44,50,77,64, 35,79,52,45,54,70,83,62,64,72,92,84,76,63,43,54,38,73,68,52,54. Prepare a frequency distribution with class size of 10 marks.
View SolutionThe marks scored by 20 students in a test are given below: 54,42,68,56,62,71,78,51,72,53,44,58,47,64,41,57,89,53,87,57. Complete the following frequency table: Marks in class intervals, Tally marks, Frequency (No. of children 40-50 50-60 60-70 70-80 80-90, , What is the class interval in which the greatest frequency occurs?
View SolutionThe weights (in kg) of 35 persons are given below :43,51,47,62,48,40,50,62,53,56,40,48,56,53,50,42,55,52,48,46,45,54,52,50,47,44,54,55,60,63,58,55,60,58,53. Prepare a frequency distribution table taking equal class size. One such class is 40 - 45 (where 45 is not included).
View Solution

