We are given the following marks secured by 25 students in an examination .
23,28,30,32,35,36,36,40,41,43,44,44,45,48,49,52,53,54,56,56,58,61,62,65,68.
(i)Arrange this data in the form of a frequency distribution taking the following class intervals.
20-29,30-39,40-49,50-59, and 60-69
(ii) Draw the frequency polygon and ogive for the above data.
Step by step video, text & image solution for We are given the following marks secured by 25 students in an examination . 23,28,30,32,35,36,36,40,41,43,44,44,45,48,49,52,53,54,56,56,58,61,62,65,68. (i)Arrange this data in the form of a frequency distribution taking the following class intervals. 20-29,30-39,40-49,50-59, and 60-69 (ii) Draw the frequency polygon and ogive for the above data. by Economics experts to help you in doubts & scoring excellent marks in Class 11 exams.
Topper's Solved these Questions
- BOOK - TARUN JAIN & VK OHRICHAPTER - FREQUENCY DIAGRAMS - HISTOGRAM, POLYGON AND OGIVEEXERCISE - EXERCISE NCERT7videos
FREQUENCY DIAGRAMS - HISTOGRAM, POLYGON AND OGIVE
- BOOK - TARUN JAIN & VK OHRICHAPTER - FREQUENCY DIAGRAMS - HISTOGRAM, POLYGON AND OGIVEEXERCISE - EXERCISE CONCEPT BASED OBJECTIVE5videos
FREQUENCY DIAGRAMS - HISTOGRAM, POLYGON AND OGIVE
- BOOK - TARUN JAIN & VK OHRICHAPTER - DIAGRAMMATIC PRESENTATION OF DATA BAR DIAGRAMS AND PIE DIAGRAMSEXERCISE - NCERT Question (With Hints to Answers)3videos
DIAGRAMMATIC PRESENTATION OF DATA BAR DIAGRAMS AND PIE DIAGRAMS
- BOOK - TARUN JAIN & VK OHRICHAPTER - INDEX NUMBERSEXERCISE - NCERT Questions (With Hints to Answers)12videos
INDEX NUMBERS
Similar Questions
Time taken is seconds by 25 students in an examination to solve certain question is given below.
20,16,20,27,28,30,33,57,50,40,42,46,28,43,46,46,48,49,52,58,59,60,64,52.
By taking class interval of size 10, make a frequency distribution table.View SolutionAn economic survey revealed that 30 families in a town incur following expenditure in a day (rupees)

(i)Convert these data in the form of a frequency distribution, using the following class intervals.
10-14,15-19,20-24,25-29,30-34 and 35-39 .
(ii)How many families spend more than 29 rupees a day ?View Solution
Knowledge Check
- Question 1 - Select One
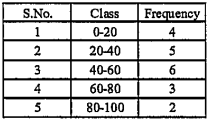
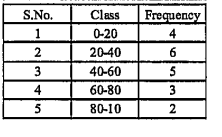
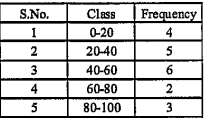
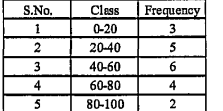
20 students of a class obtained following respective marks out of 100 marks in subject Mathematics:54,46,24,36,84,70,16,58,6,82,44,54.32,64.8,66,52,28,16 and 30 Grouped frequency distribution table of above will be
A B
B C
C D
D
The marks scored by 40 students of class VIII in mathematics are given below: 81,55,68,79,85,43,29,68,54,73,47,35,72,64,95,44,50,77,64, 35,79,52,45,54,70,83,62,64,72,92,84,76,63,43,54,38,73,68,52,54. Prepare a frequency distribution with class size of 10 marks.
View SolutionThe marks obtained by 40 students of a class in an examination are given below,
8,47,22,31,17,13,38,26,3,34,29,11,22,7,15,24,38,31,21,35,42,24,45,23,21,27,29,49,25,48,21,15,18,27,19,45,14,34,37,34.
Prepare a frequency distribution table with equal class intervals starting from 0-10 (where 10 is not included).View SolutionThe weights (in kg) of 35 persons are given below :43,51,47,62,48,40,50,62,53,56,40,48,56,53,50,42,55,52,48,46,45,54,52,50,47,44,54,55,60,63,58,55,60,58,53. Prepare a frequency distribution table taking equal class size. One such class is 40 - 45 (where 45 is not included).
View SolutionCalculate mode of the following sercies:
Class Interval10−1920−2930−3940−4950−5960−6970−79Frequency 10 12 18 30 16 6 8View SolutionThe weights (in kg) of 30 students of a class are
39,43,32,37,29,26,31,45, 46,31,37,38,30,39,36,41,35,34,41,46,39,38,36,38,40,42,33,43,44,33.
Prepare a frequency distribution table using one class interval as 30-35 in which 30 is included and 35 excluded. using the above data, draw a histogram.View SolutionGiven below are the marks (out of 100) in mathematics obtained by 20 students of a calss in an annual examination.
23,75,56,42,70,84,92,51,40,63,87,58,35,80,14,63,49,72,66,61.
Arrange the above data in ascending order and find
(i) The lowest marks obtained.
(ii) The highest marks obtained.
(iii) The range of the given data.View SolutionThe marks scored by 20 students in a test are given below: 54,42,68,56,62,71,78,51,72,53,44,58,47,64,41,57,89,53,87,57. Complete the following frequency table: Marks in class intervals, Tally marks, Frequency (No. of children 40-50 50-60 60-70 70-80 80-90, , What is the class interval in which the greatest frequency occurs?
View Solution

