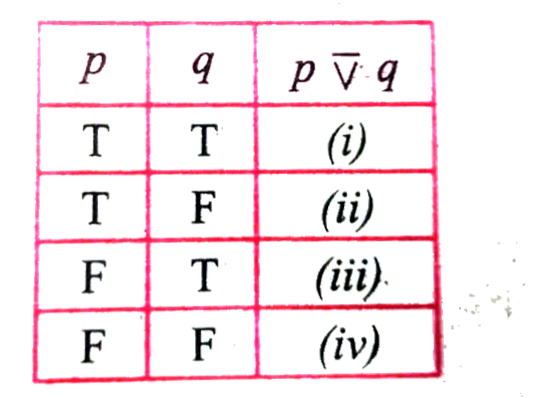
Truth table for p−∪q is given below

Which of the following is true? Solution in Tamil
iiiiiiivaFTTF
iiiiiiivbFFTT
iiiiiiivcTFTF
iiiiiiivdFFFF
The correct Answer is:A
Step by step video, text & image solution for Truth table for p overset(-)(cup) q is given below Which of the following is true? by Maths experts to help you in doubts & scoring excellent marks in Class 12 exams.
Updated on:21/07/2023Topper's Solved these Questions
- DISCRETE MATHEMATICSBOOK - PREMIERS PUBLISHERSCHAPTER - DISCRETE MATHEMATICSEXERCISE - Solution To Exercise 12.3
20 Videos
- DIFFERENTIALS AND PARTIAL DERIVATIVESBOOK - PREMIERS PUBLISHERSCHAPTER - DIFFERENTIALS AND PARTIAL DERIVATIVESEXERCISE - PROBLEMS FOR PRACTICE
40 Videos
- INVERSE TRIGONOMETRIC FUNCTIONS BOOK - PREMIERS PUBLISHERSCHAPTER - INVERSE TRIGONOMETRIC FUNCTIONS EXERCISE - PROBLEMS FOR PRACTICE ( ANSWER THE FOLLOWING QUESTIONS ):
24 Videos
Similar Questions
A binary operation on a set S is a function from
View SolutionThe percentage error of the seventh root of 700 is approximate how many times the percentage of 700:
View SolutionFind the principal value of
sin−11√2
View SolutionName the enzymes 'P' and 'Q' that are involved in the processes given below.
ltimg src="https://d10lpgp6xz60nq.cloudfront.net/physics_images/BIO_044_SQP_XII_E01_005_Q01.png" width="80%"gt
View SolutionWhich of the following are correct chain isomers of butane ? (i)
View SolutionDetermine the point of symmetry of a regular hexagon.
View SolutionDtermine the images of the following figure about the given line :
View SolutionMatch the following Column A to Column B

View SolutionMatch the following Column A to Column B

View SolutionMatch the following Column A to Column B

View SolutionFind the area of figure given below.

View SolutionFind the perimeter of the figure given below.

View SolutionFind the area of the figure given below.

View SolutionThe area of the shaded part in the figure given below is ______.

View SolutionThe inequation represented by the graph given below is :
View SolutionThe inequation that best describes the graph given below is _________
View Solution
