Which of the following could be the equation of the graph shown ?
A
y=2x+10
B
y=−x2+32+10
C
y=−(x−2)(x+5)
D
y=−(x+2)(x−5)
Text Solution
The correct Answer is:D
The graph is a parabola, so you can eliminate (A) because its equation is linear. The x-intercepts of the graph are -2 and 5, so the factors of the quadratic are (x+2)and(x−5). These factors make y=0 when x=−2andx=5. Eliminate (B) and (C ). Only (D) is left, so it must be correct. On test day, you would move on. For the record, the parabola opens downward, so there should be a negative sign in front of the factors. (D) is correct.
|
Topper's Solved these Questions
- QUADRATICSBOOK - KAPLANCHAPTER - QUADRATICSEXERCISE - TRY ON YOUR OWN
43 Videos
- QUADRATICSBOOK - KAPLANCHAPTER - QUADRATICSEXERCISE - SOLVING QUADRATICS BY FACTORING
1 Videos
- PAIRED PASSAGES AND PRIMARY SOURCE PASSAGES BOOK - KAPLANCHAPTER - PAIRED PASSAGES AND PRIMARY SOURCE PASSAGES EXERCISE - HOW MUCH HAVE YOU LEARNED
11 Videos
- SAT MATH: TIMING ANS SECTION MANAGEMENT STRATEGIESBOOK - KAPLANCHAPTER - SAT MATH: TIMING ANS SECTION MANAGEMENT STRATEGIESEXERCISE - TRY ON YOU OWN
5 Videos
Similar Questions
Knowledge Check
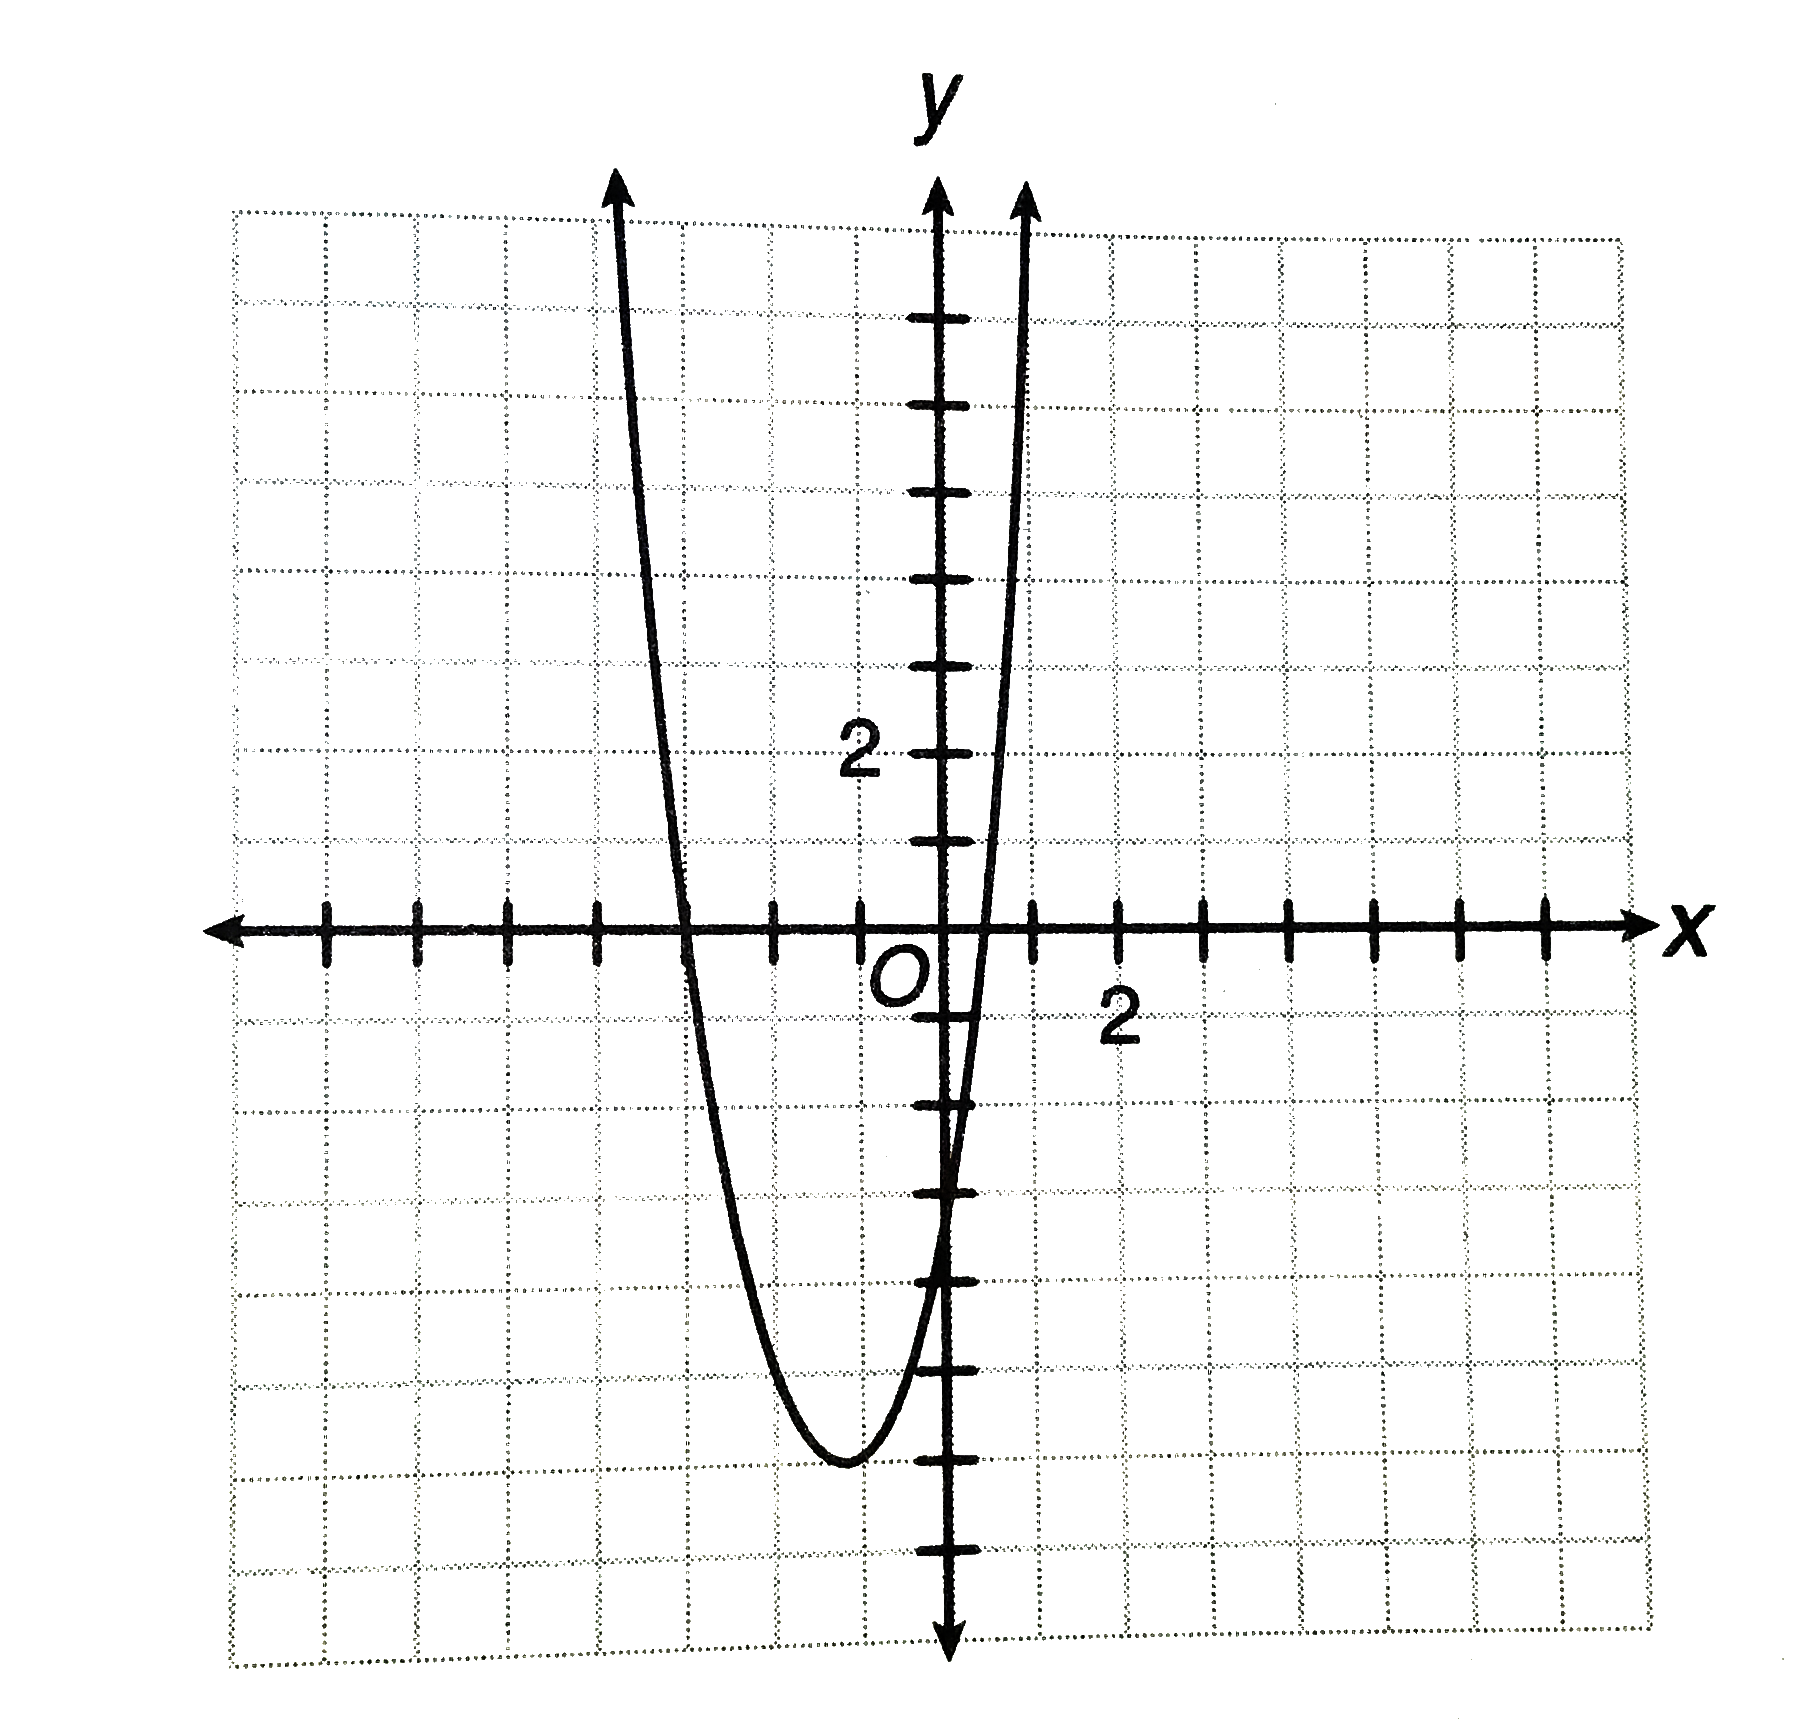
Which of the following could be the equation of the graph above?Ay=(x−3)(2x+1)By=(x+3)(2x−1)Cy=−(x−3)(1+2x)Dy=12(x+3)(x−1)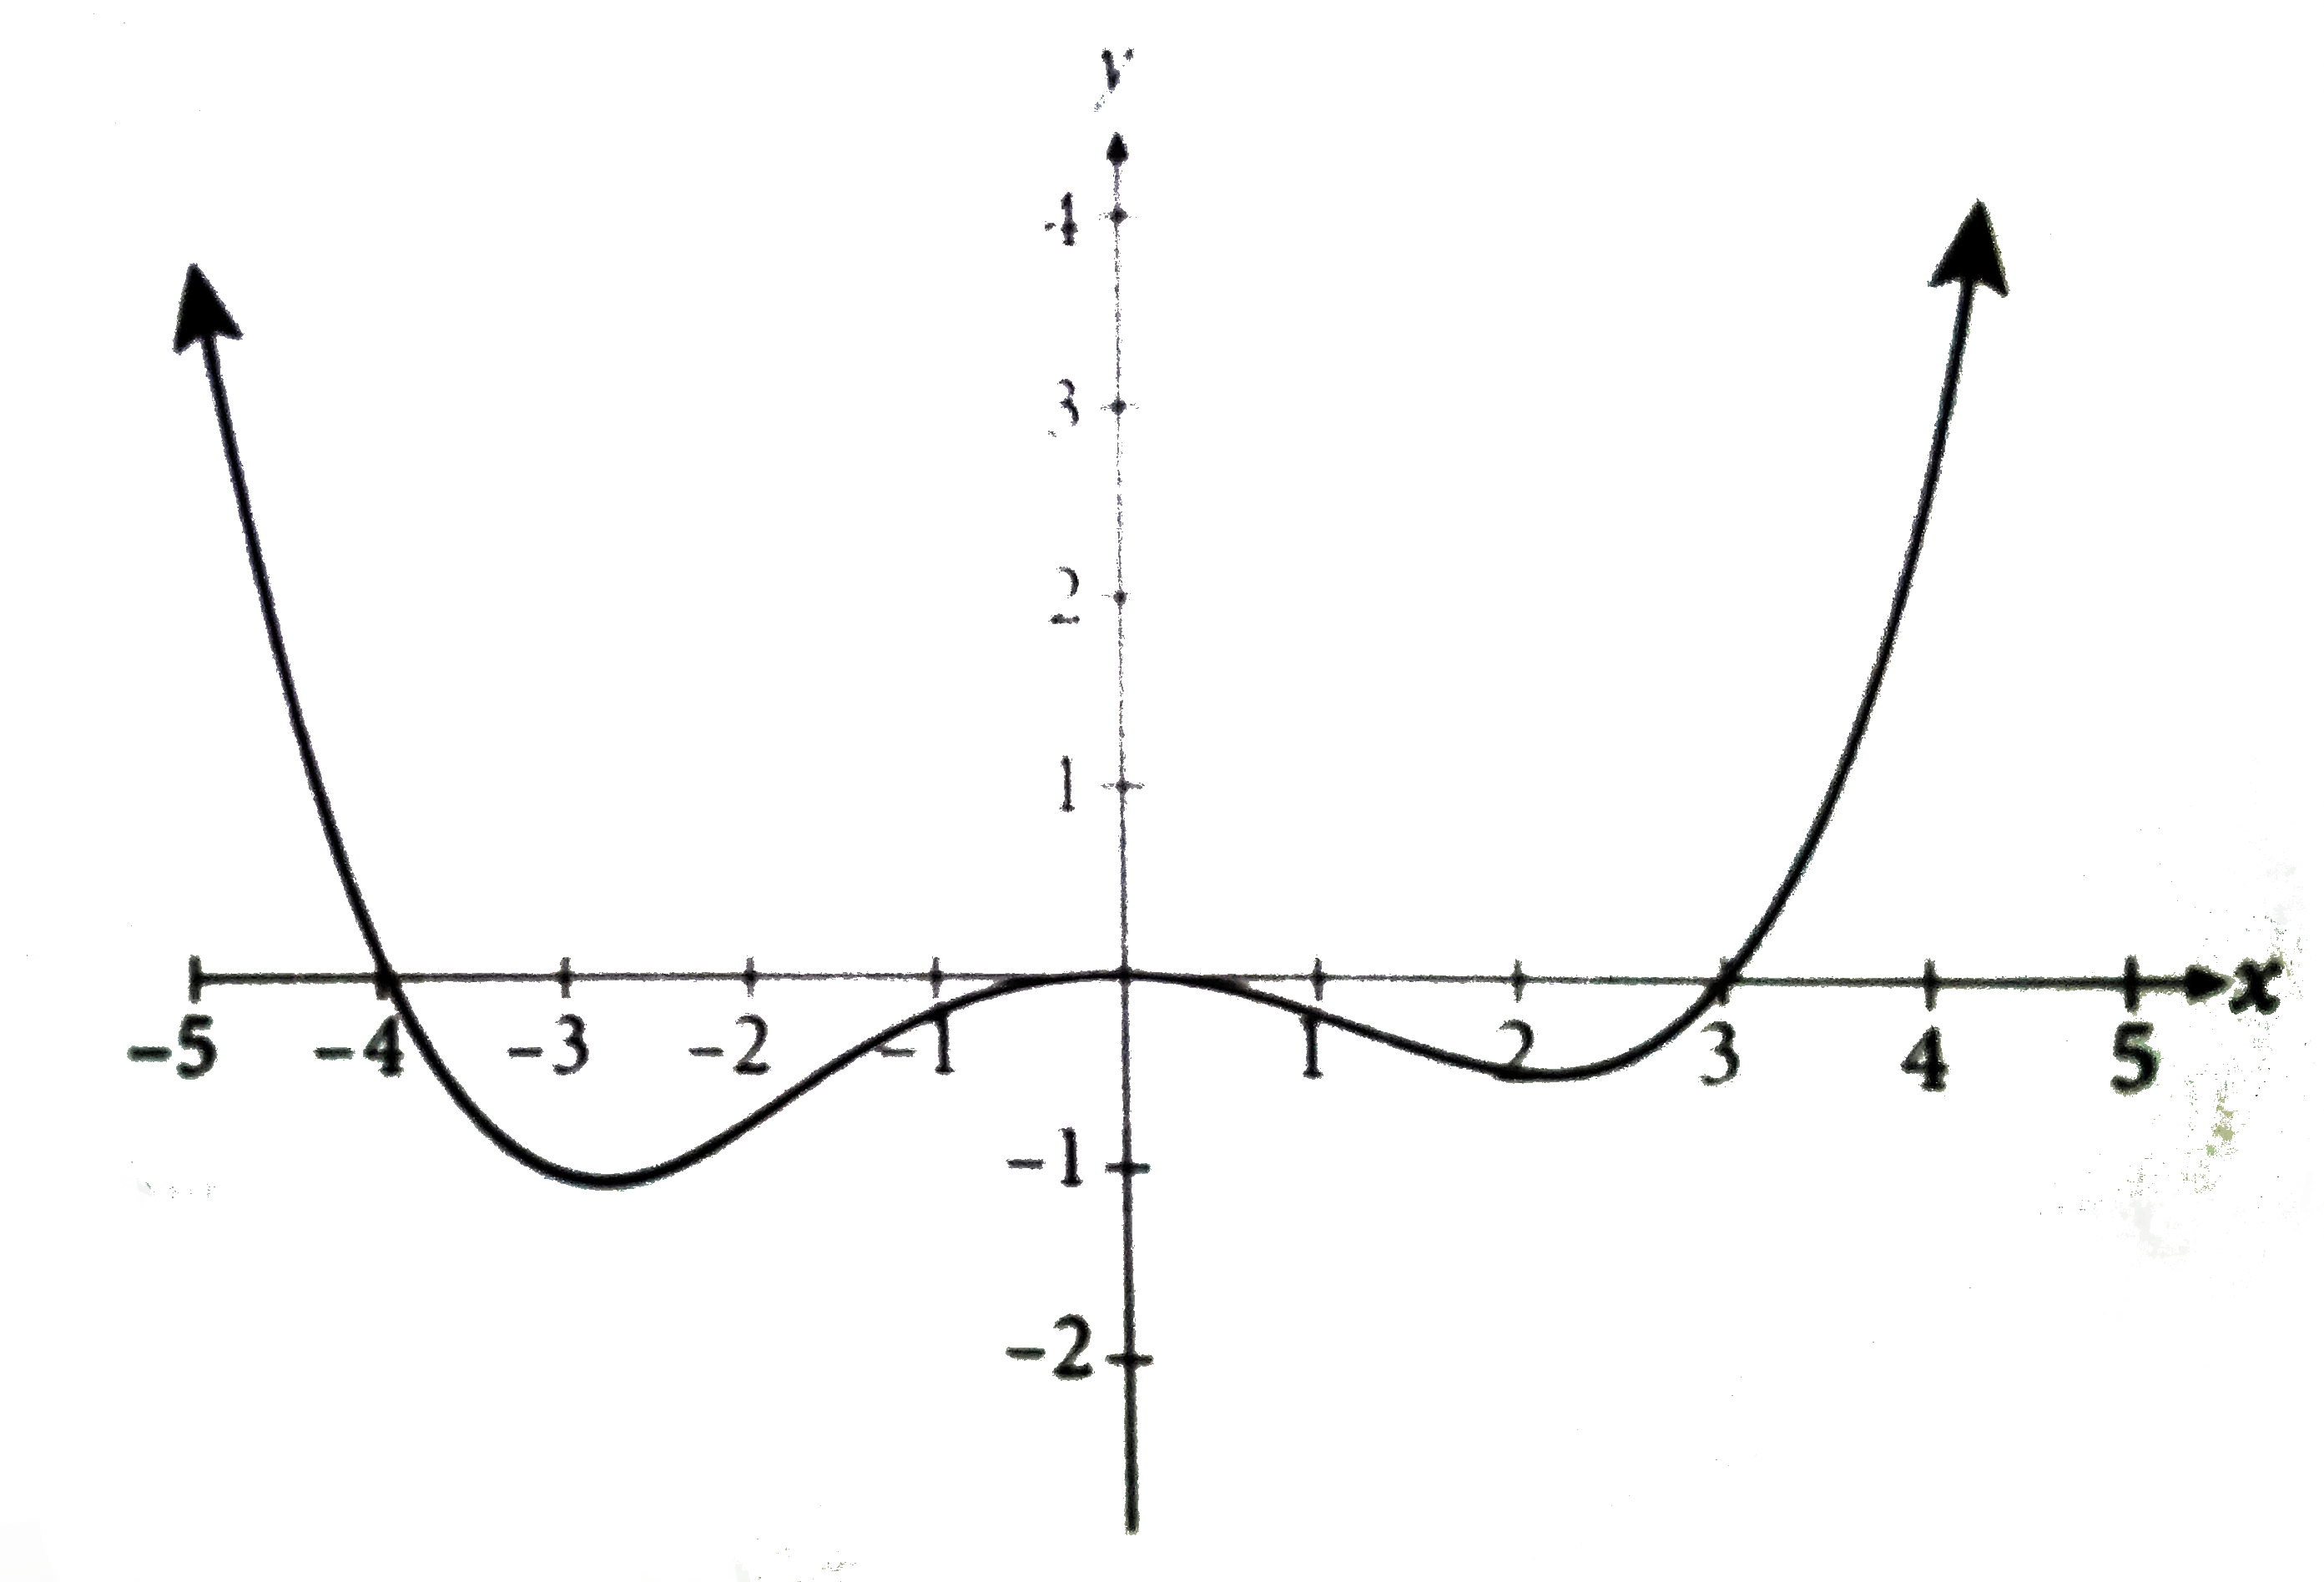
Which of the following could be the equation of the graph in the xy-plane shown above?Af(x)=x(x+3)(x−4)Bf(x)=x(x+4)(x−3)Cf(x)=x2(x+3)(x−4)Df(x)=x2(x+4)(x−3)The graph shows a parabola that is symmetric about the x-axis. Which one of the following could be the equation of the graph?
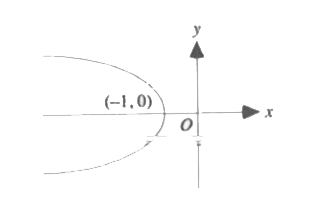 Ax=−y2−1Bx=−y2Cx=−y2+1Dx=y2−1
The equation of the graph shown here is
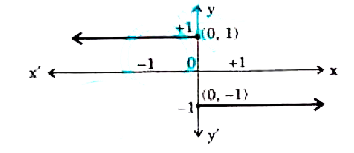
View SolutionThe graph of a function f, and a second graph, are shown below. 2 -1 1 2 3 4 Which of the following could be the equation of the second graph? C f(r 2) 1 2) 1 y t2. 2 I
View SolutionWhich of the following could be the equation of the parabola in Figure ?
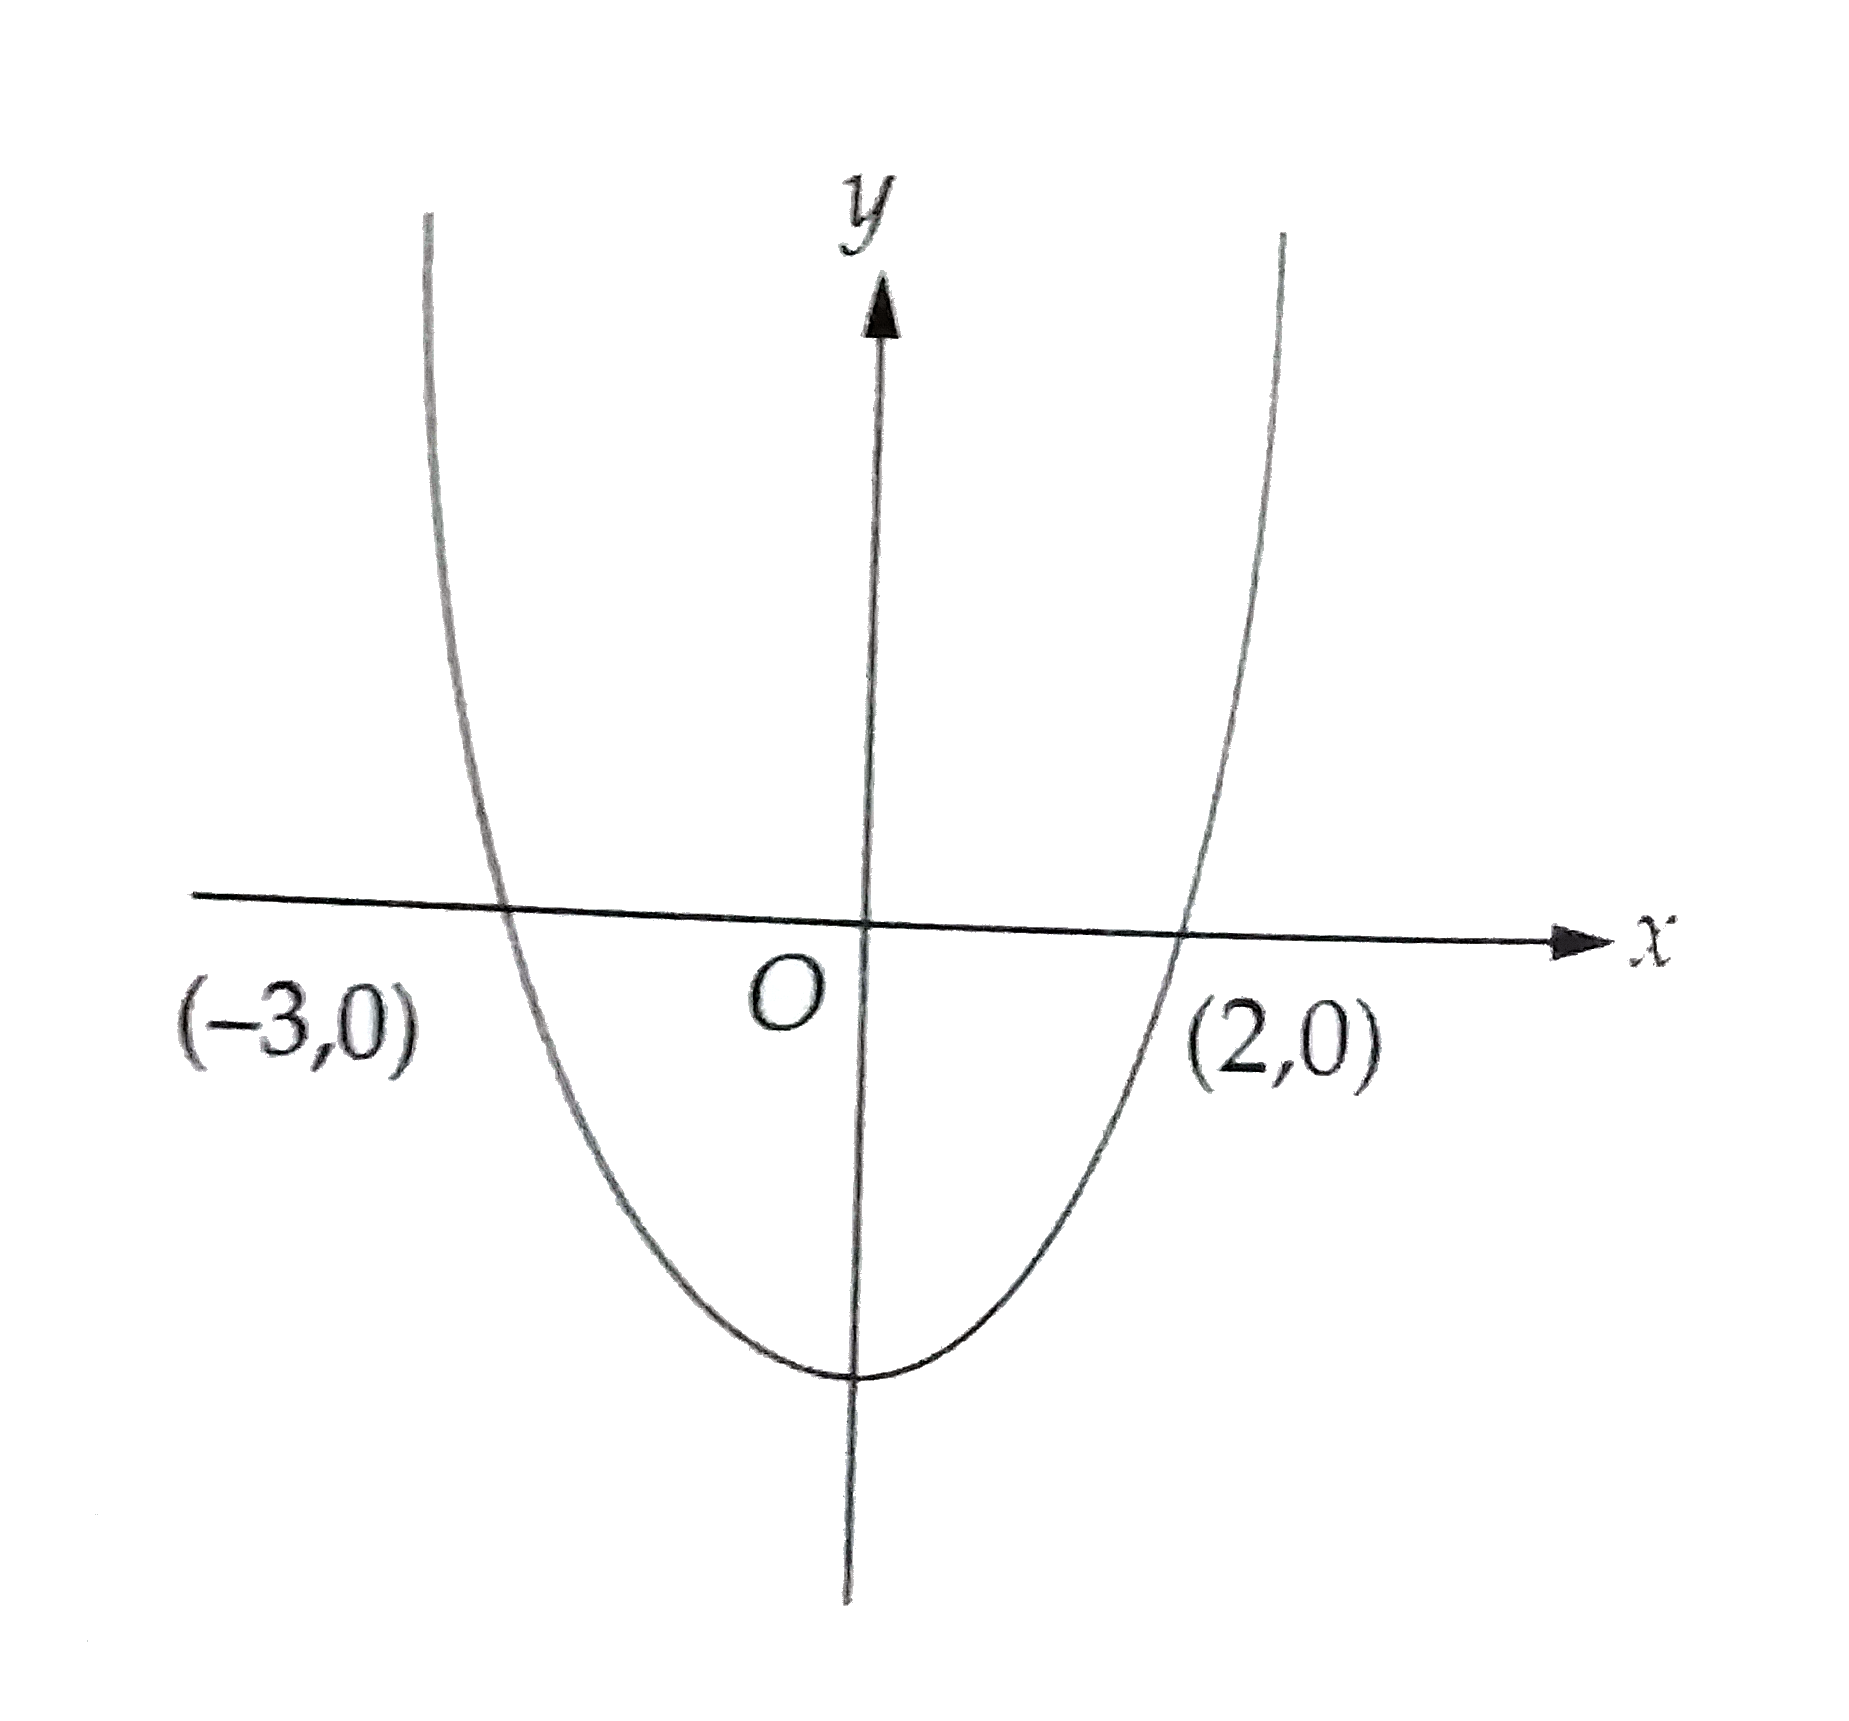
View SolutionWhich of the following is an equation of the graph shown in Figure
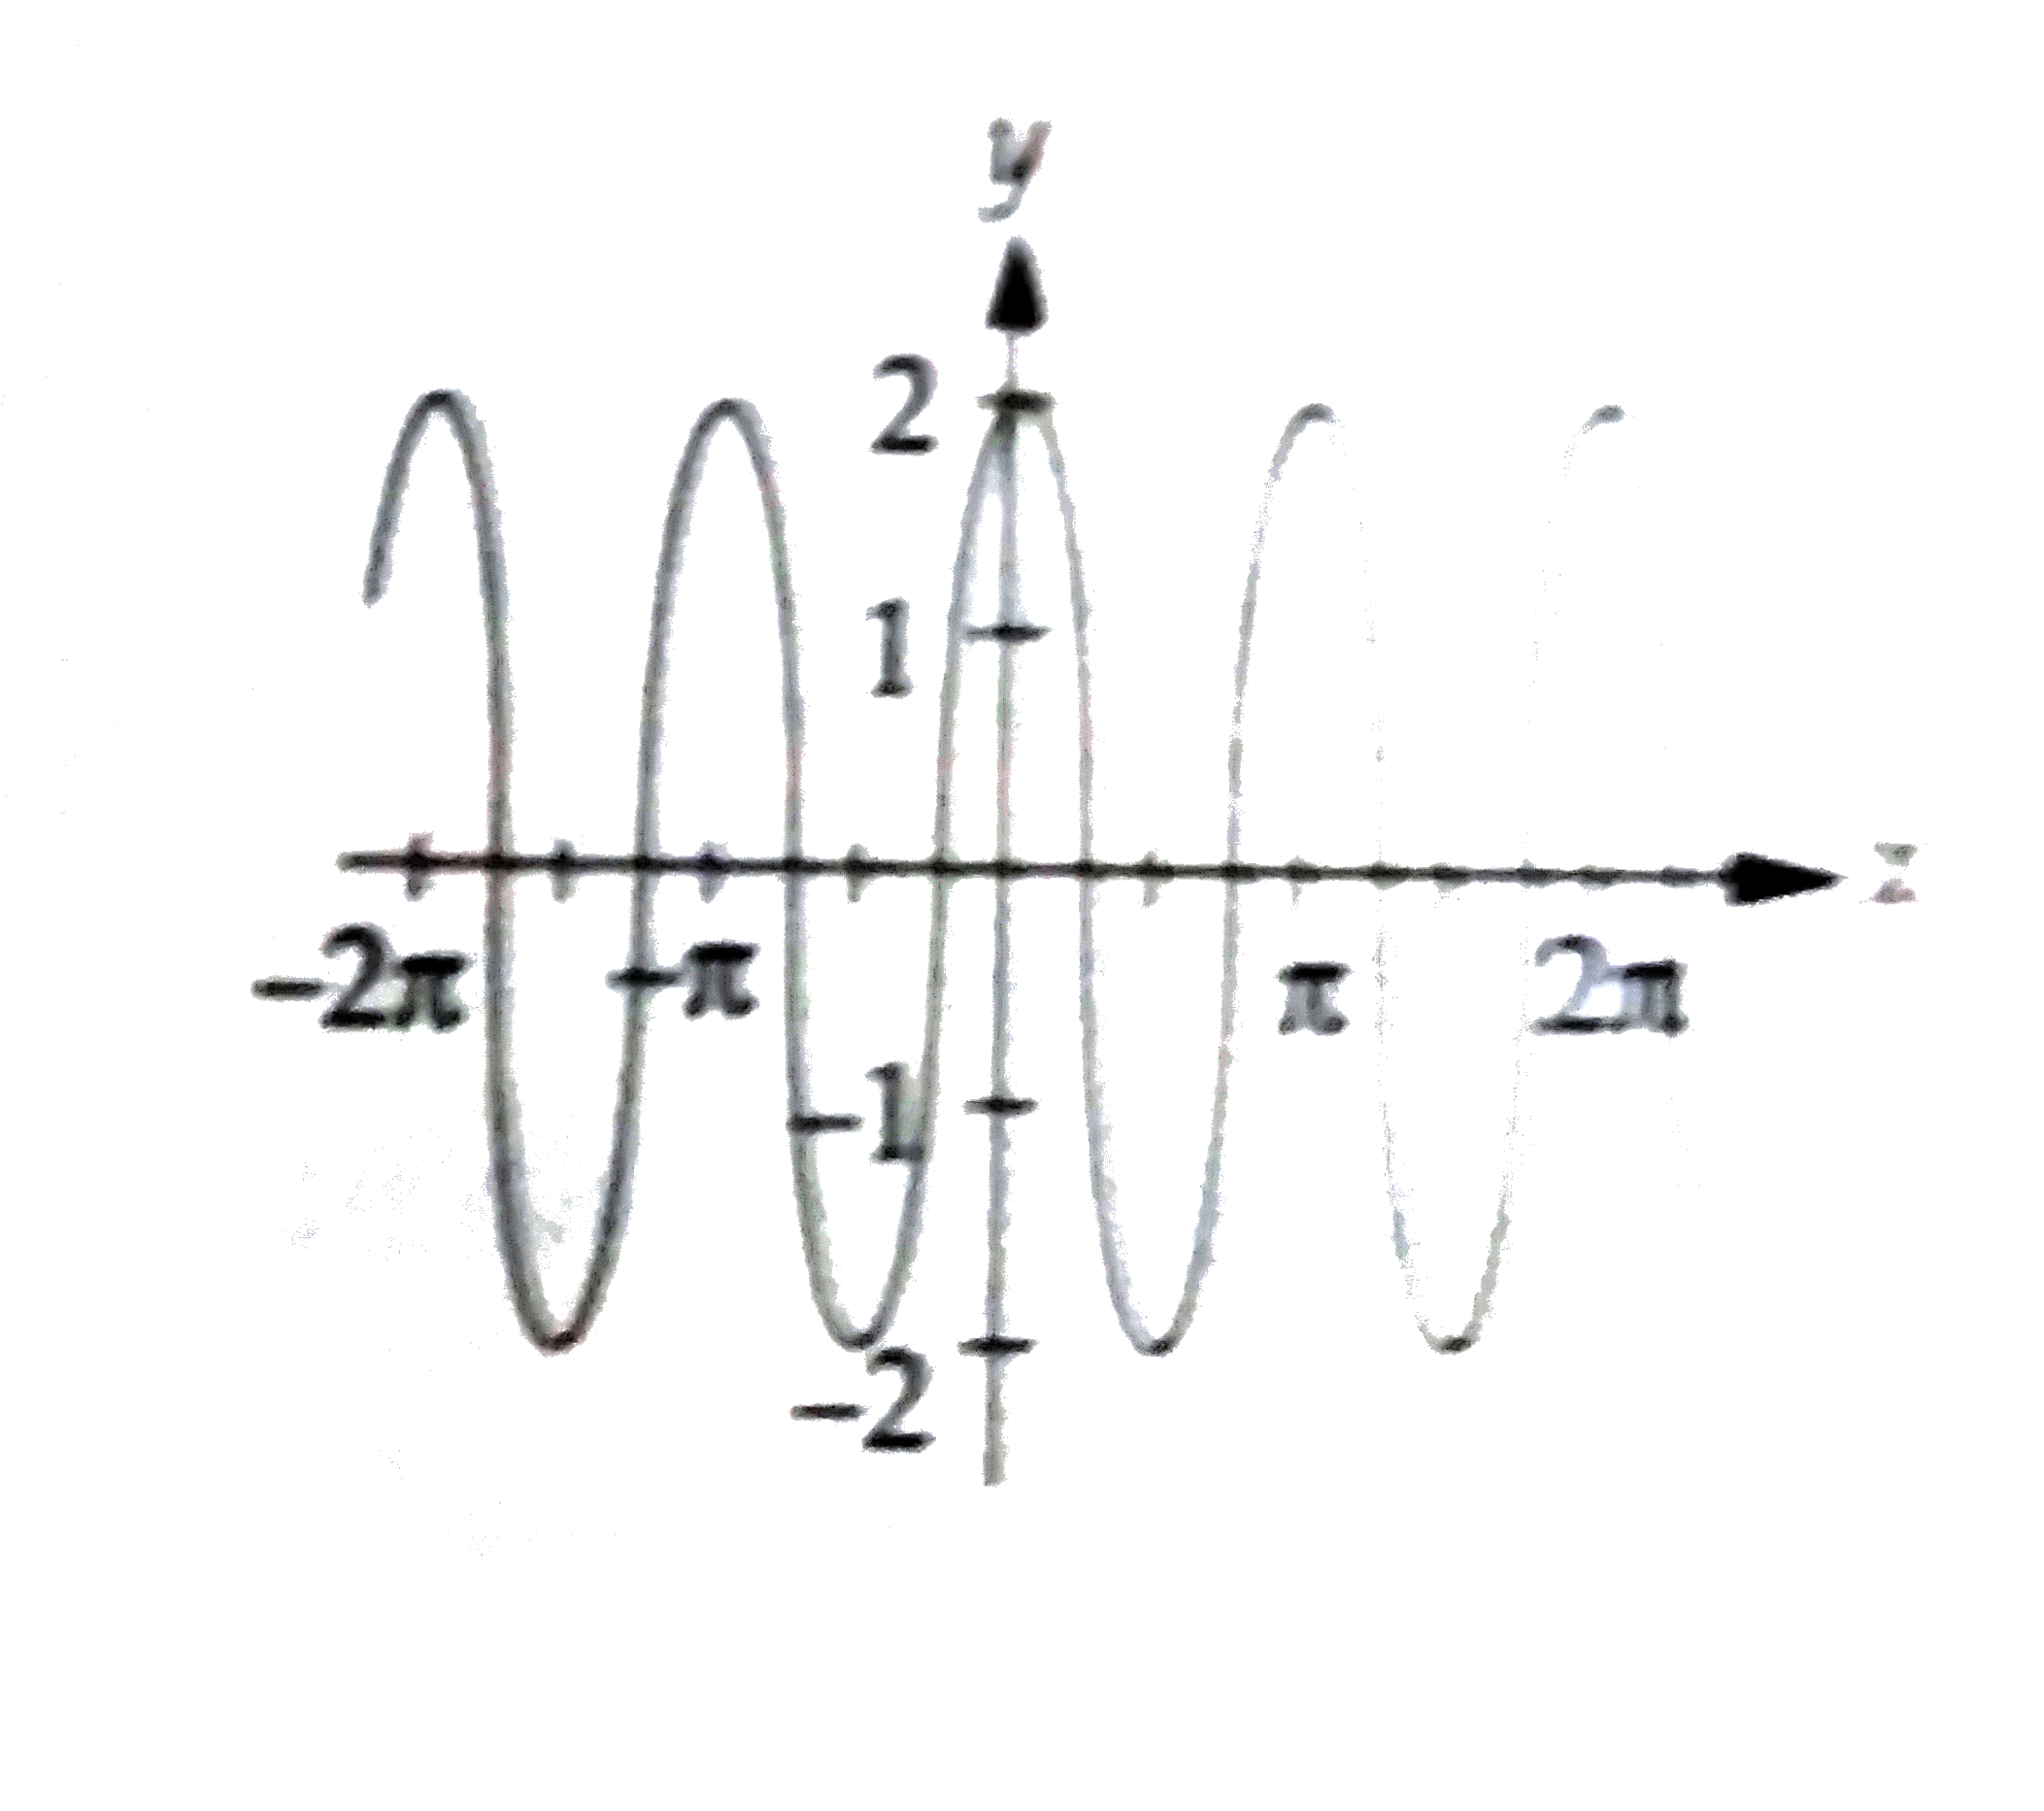
View Solution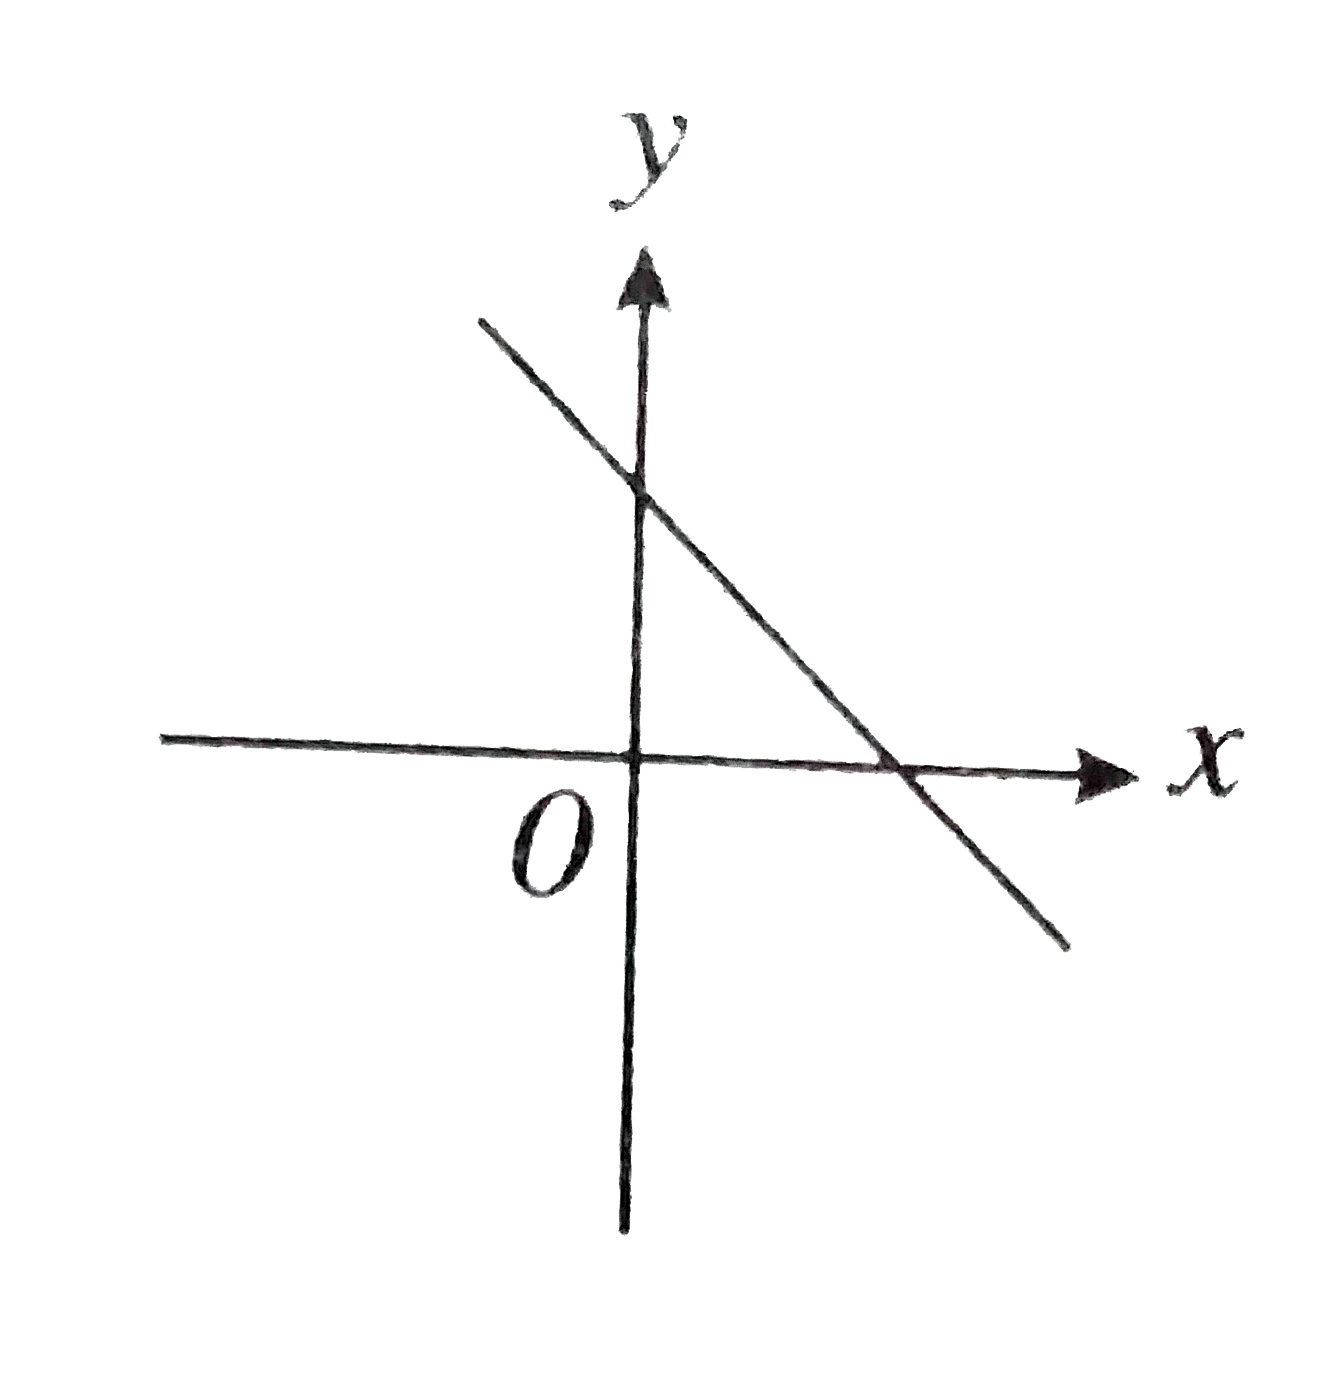
Which of the following could be the equation of the line represented in the graph above?
View Solution

