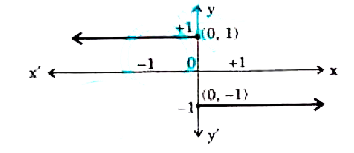
The equation of the graph shown here is
A
when x≤0,y=+1 when x>0,y=−1
B
When x<0,y=+1 when x≥0,y=−1
C
when x<0,y=+1 when x>0,y=−1
D
when x<0,y=−1 when x>0,y=+1
Video Solution
|
Answer
Step by step video & image solution for The equation of the graph shown here is by Maths experts to help you in doubts & scoring excellent marks in Class 14 exams.
Updated on:21/07/2023Similar Questions
Knowledge Check
The equation of the graph given below is
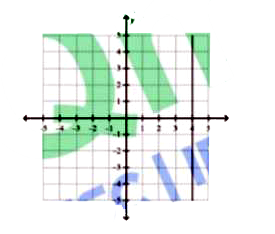 AY=4BX=4CX=−4DY=0
The ligand shown here is
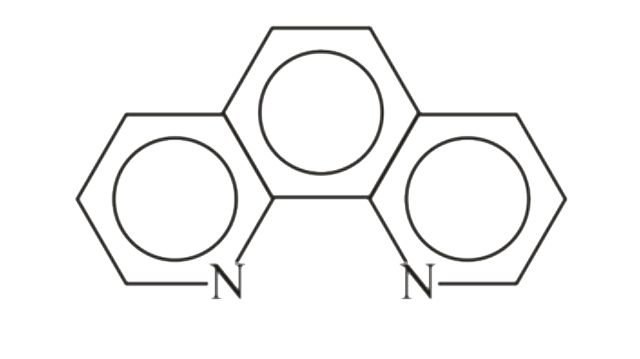 ATridentateB1,10 - phenathrolineC1,10 - phenanthrineD2,2- dipyridyl
A body moves with uniform velocity. Which of the graphs shown here is a graph of velocity against time for this motion?
A B
B C
C D
D
Calculate work done in moving the object from x=2 to x=3m from the graph shown here.
View SolutionWrite equations for the straight lines shown in the following graphs.
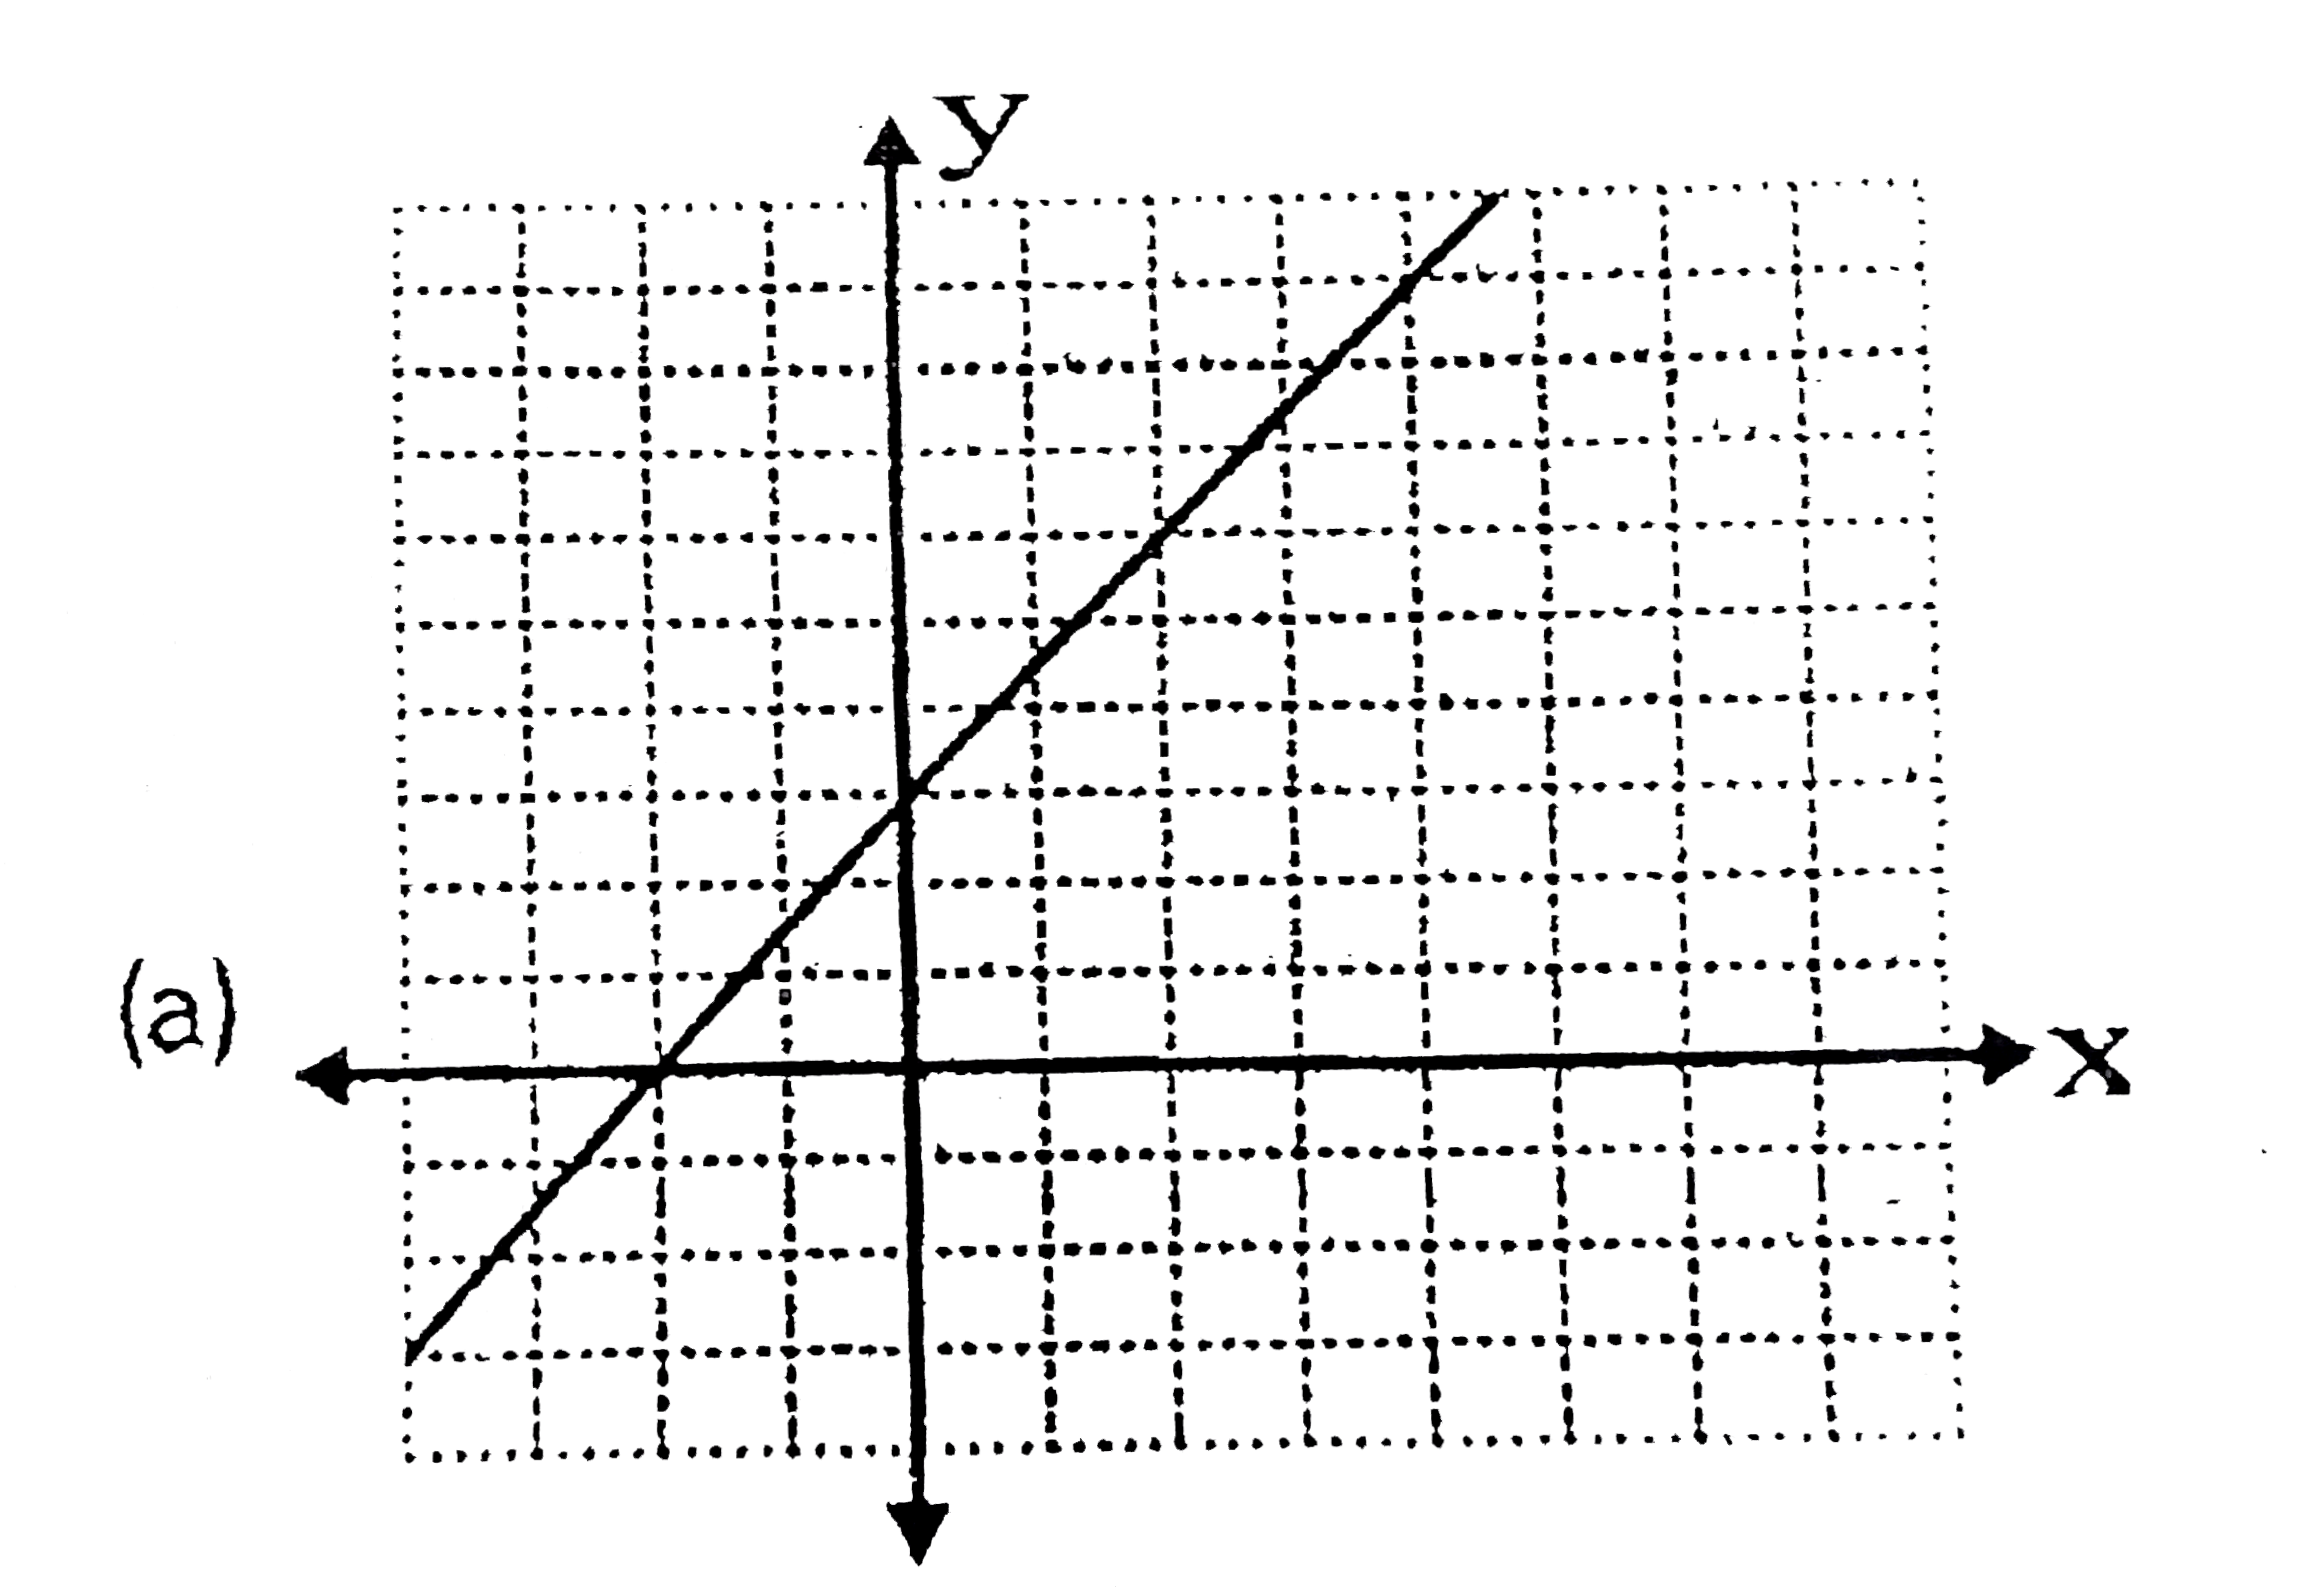
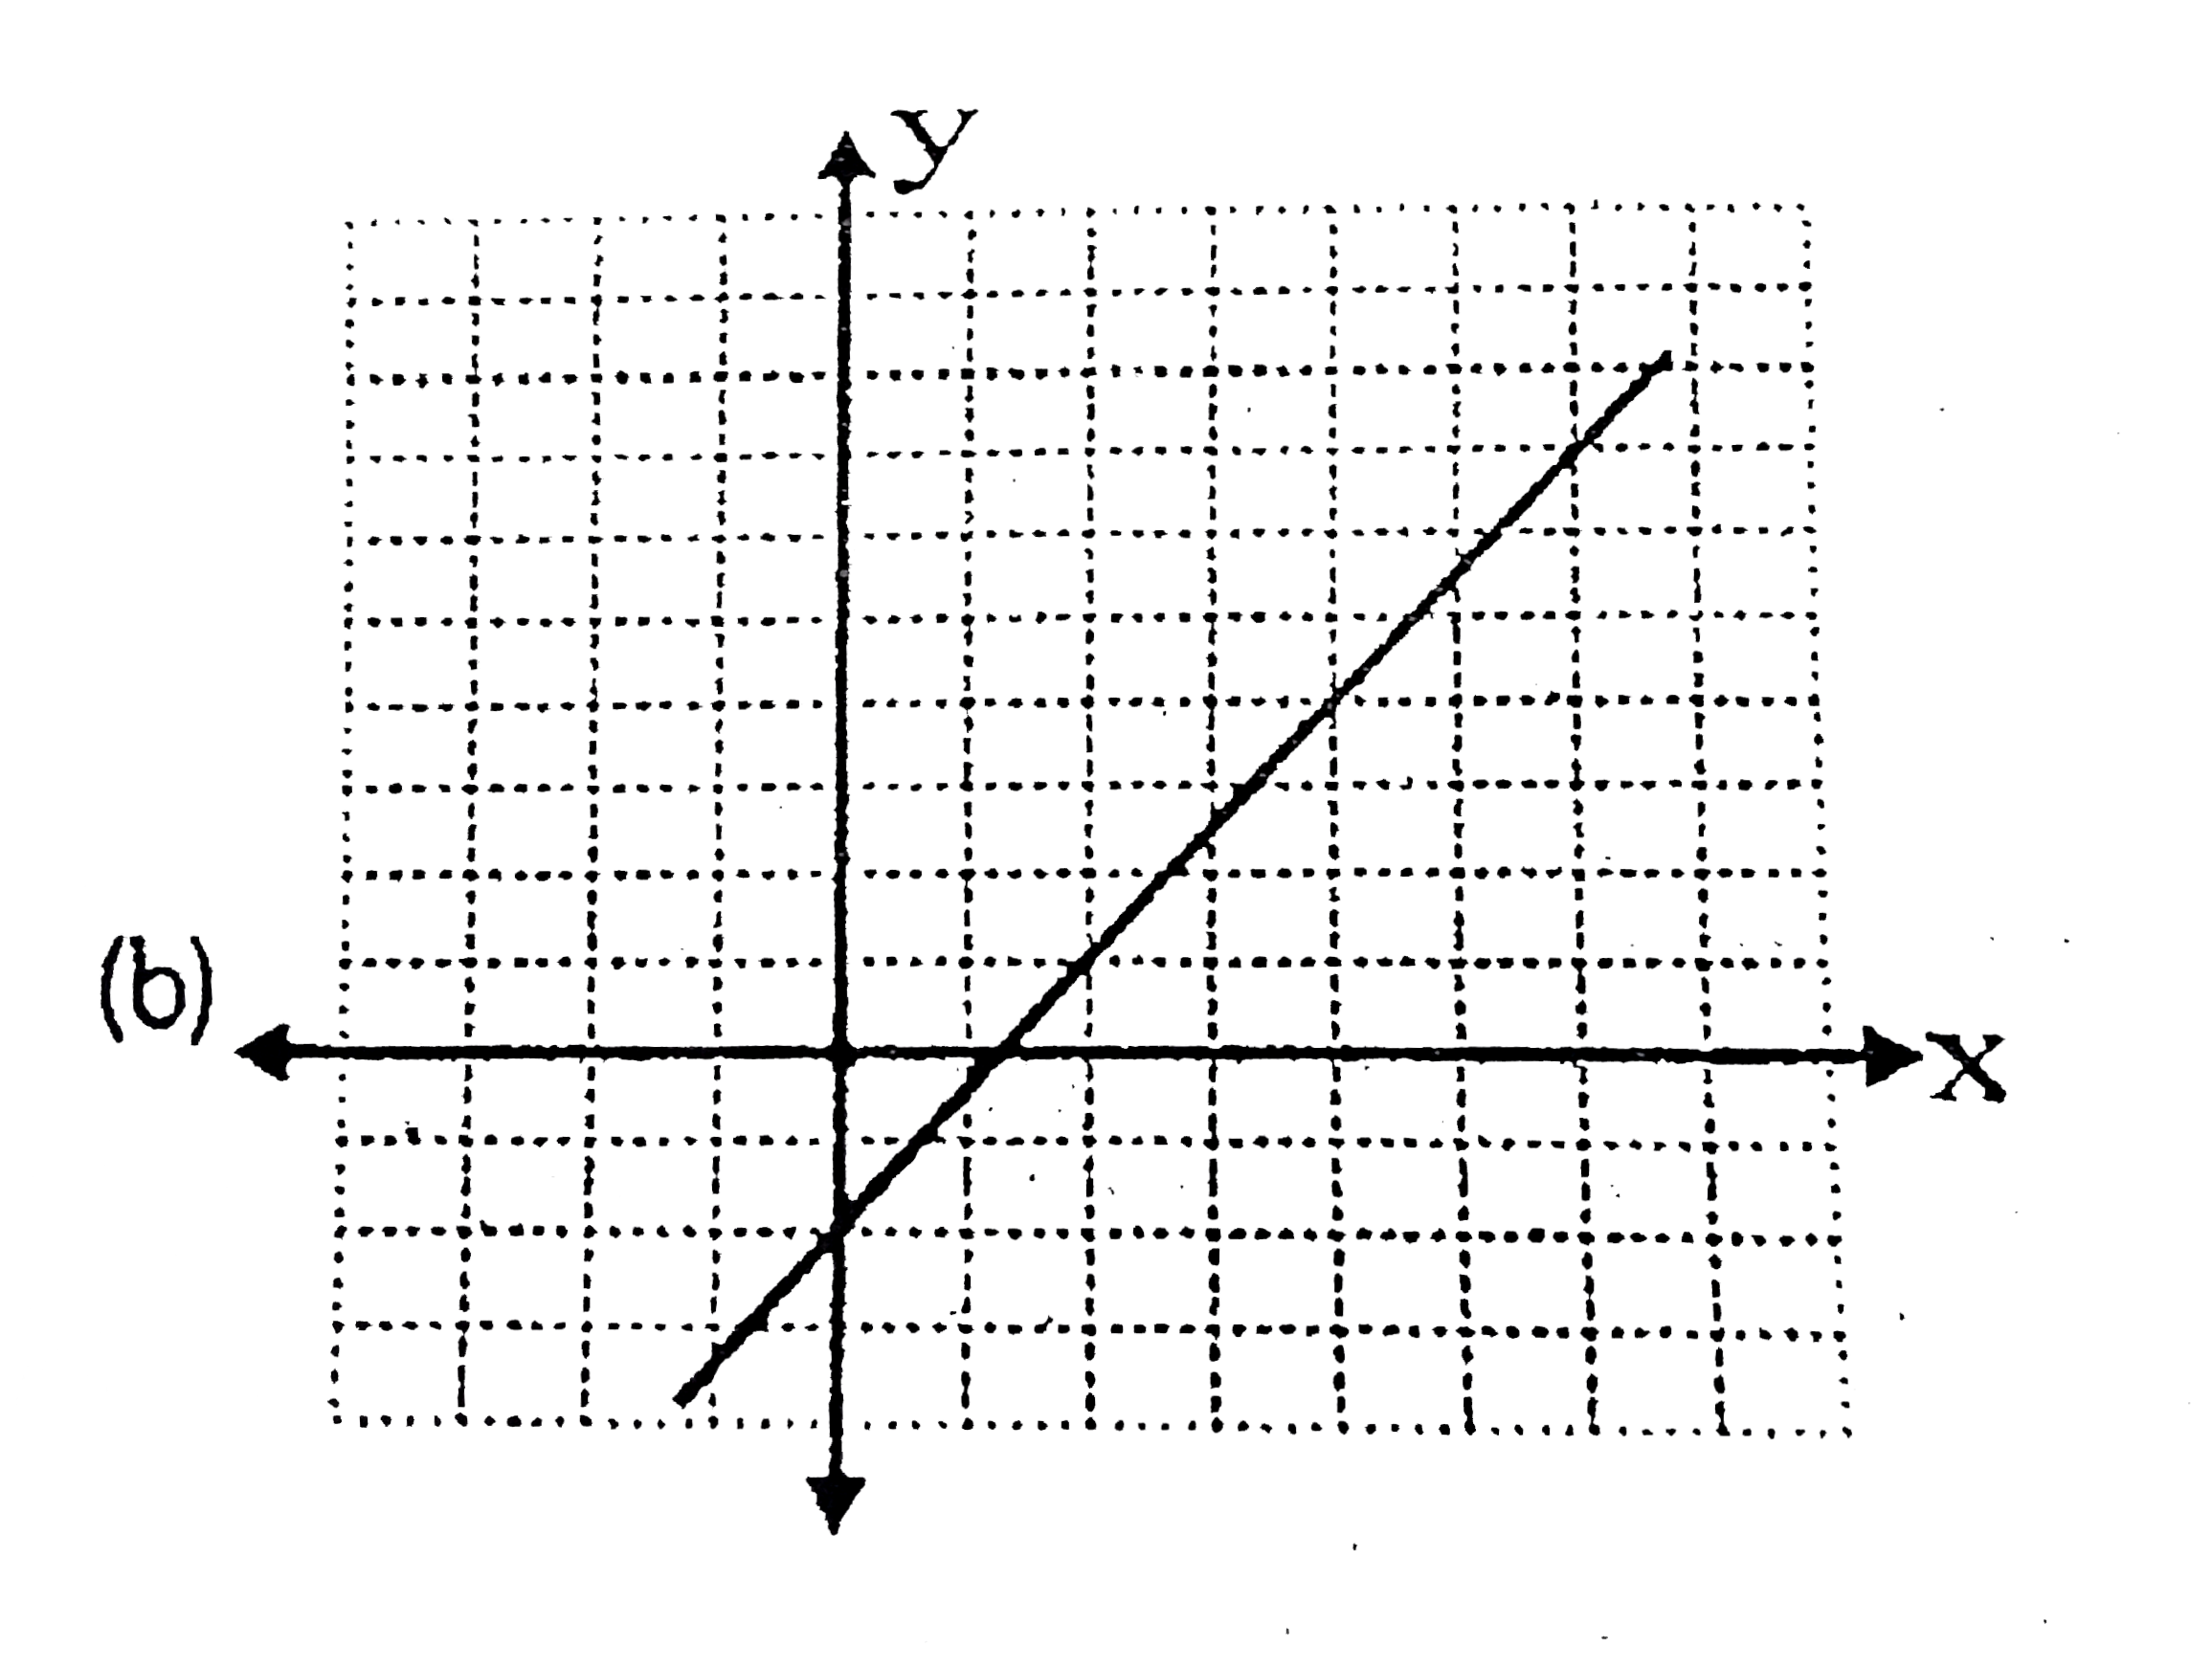
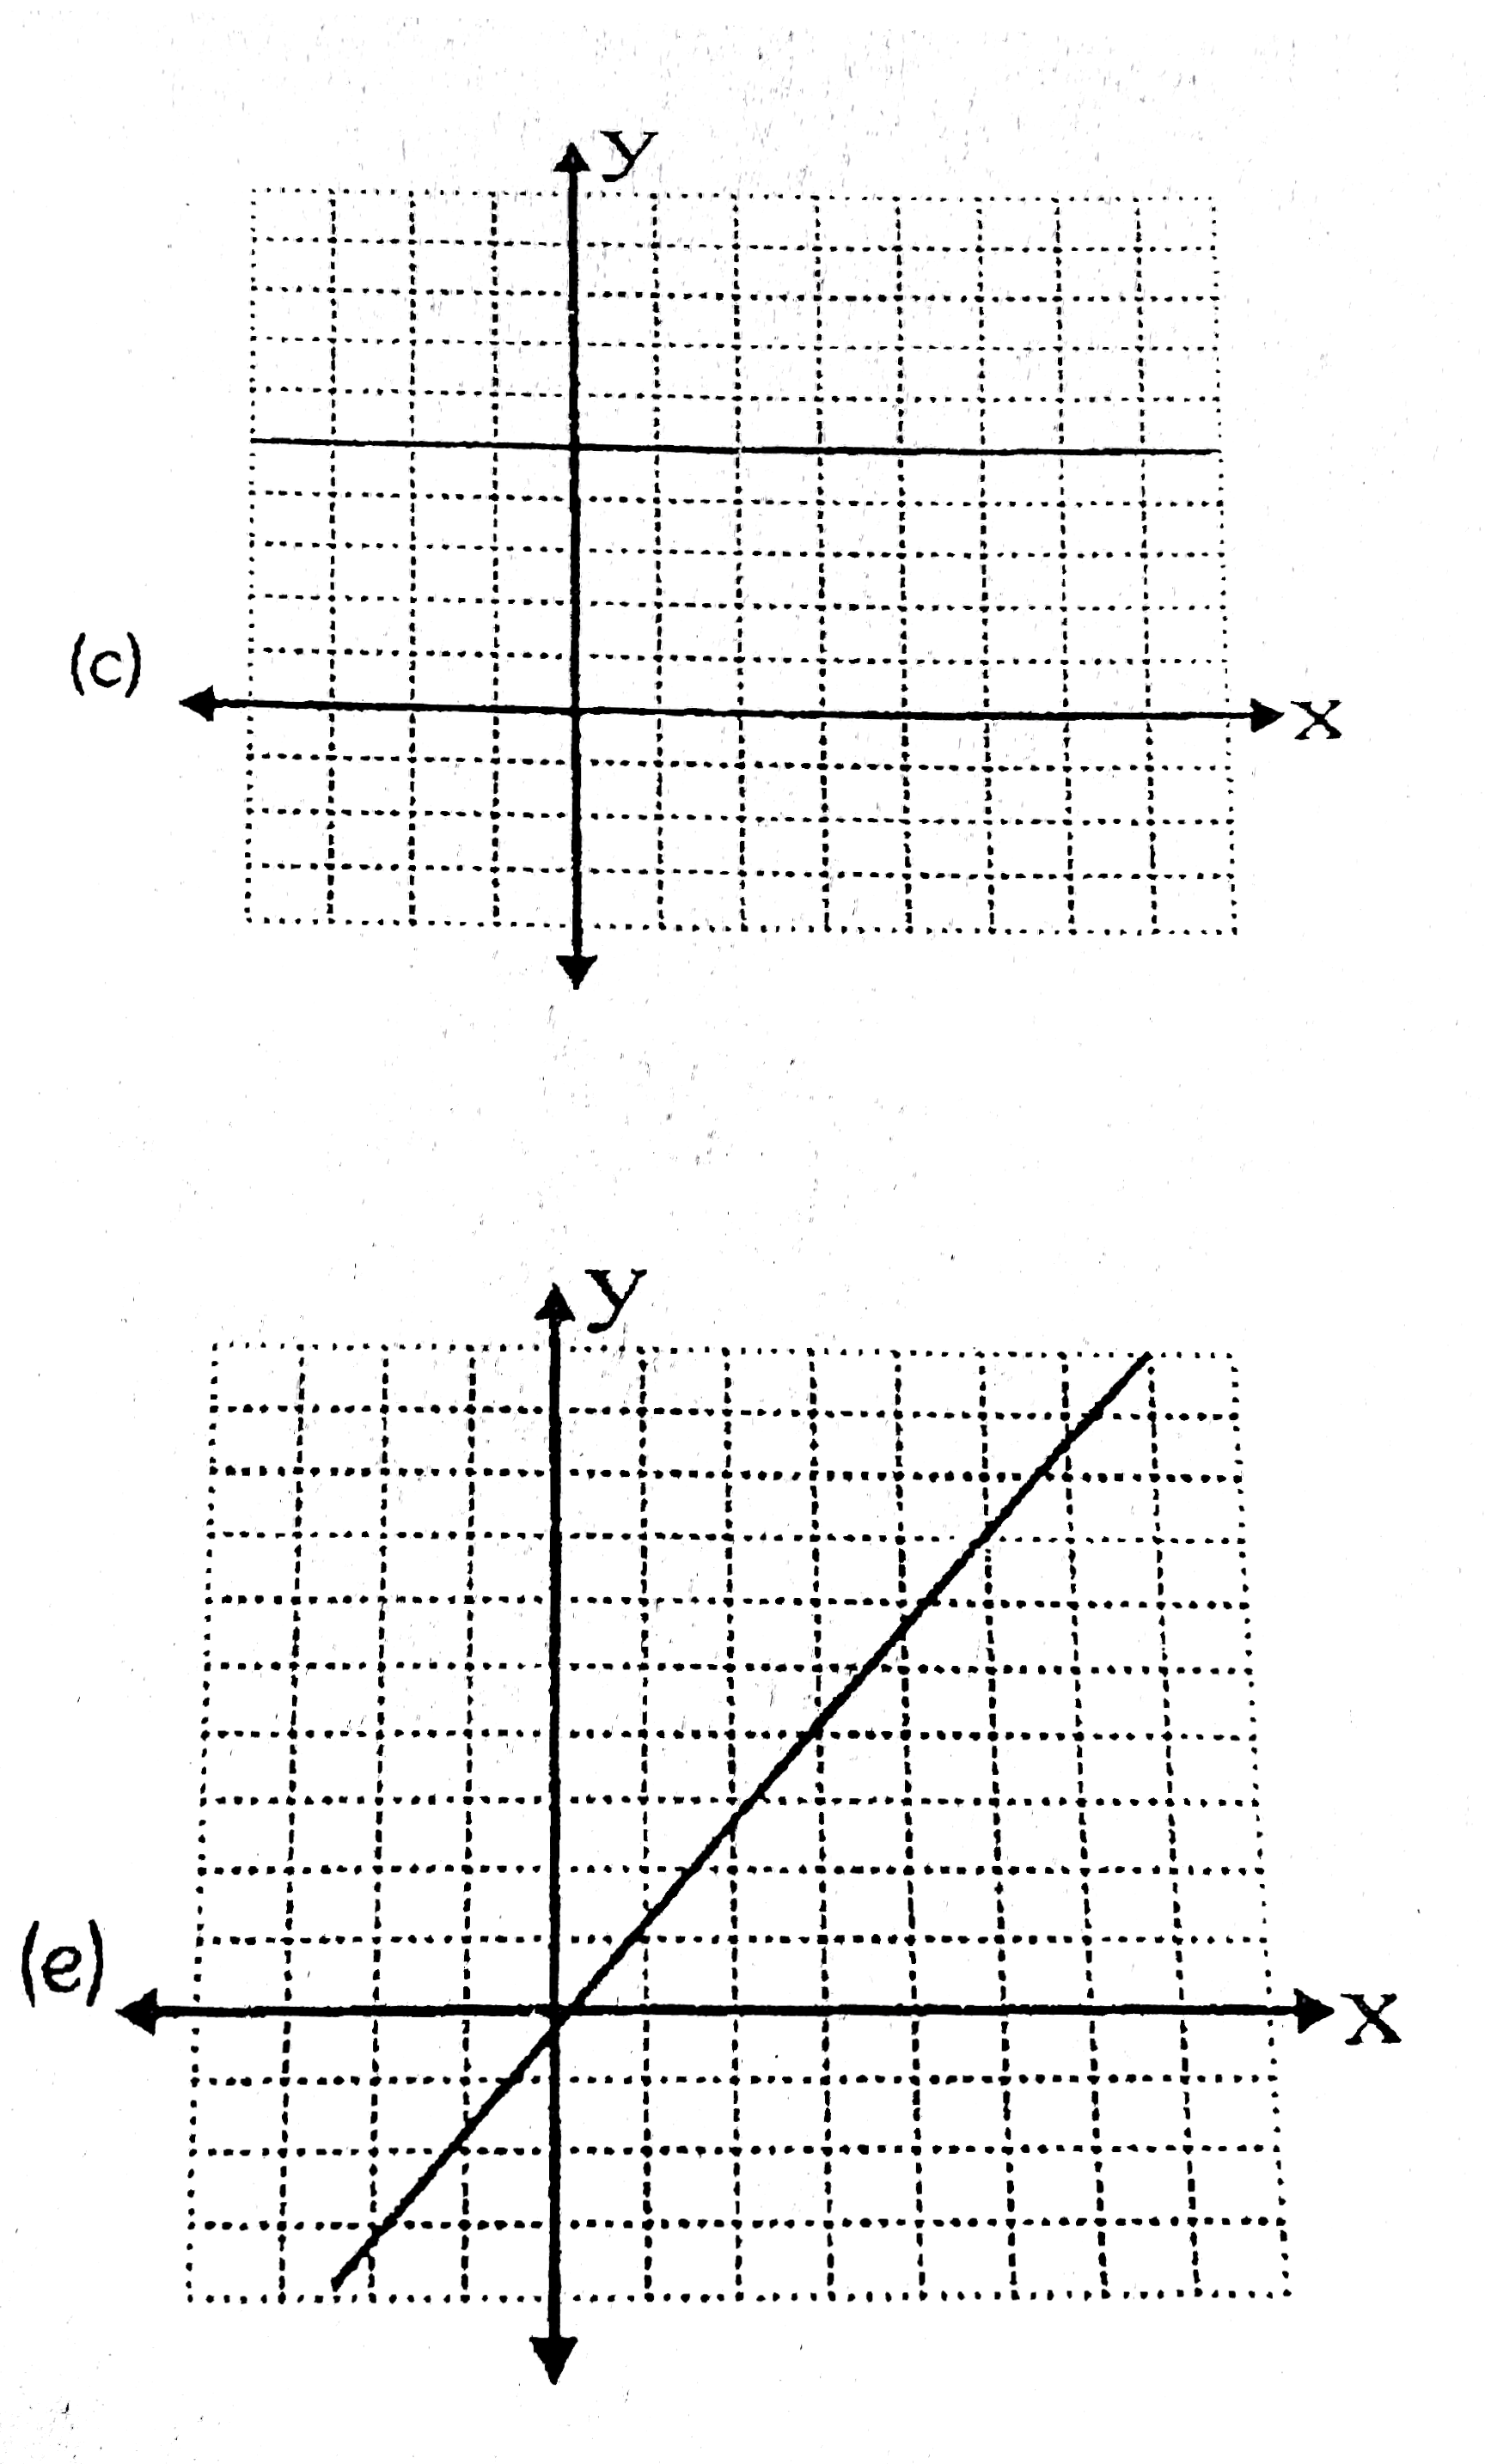

View Solution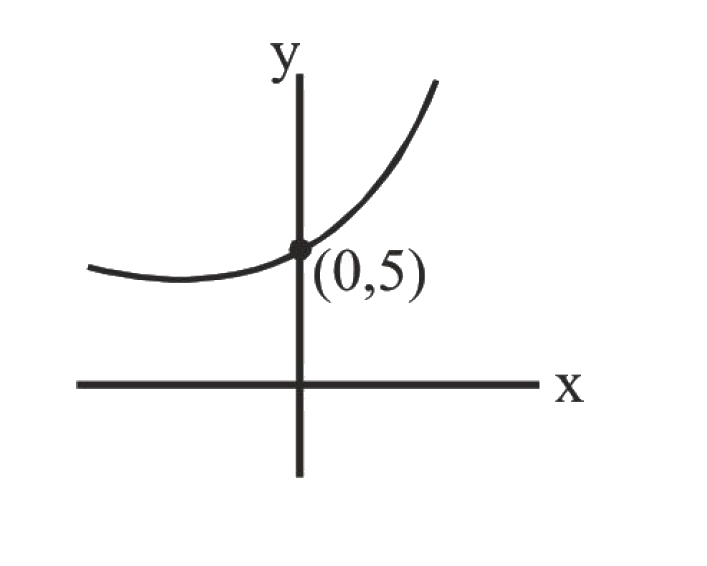
If the equation for graph shown in figure is y=aex then value of a is:-
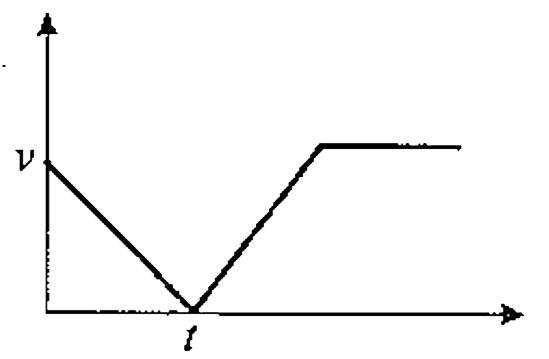
View SolutionThe velocity of a particle moving in straight line is given by the graph shown here. Then its acceleration is best represented by :
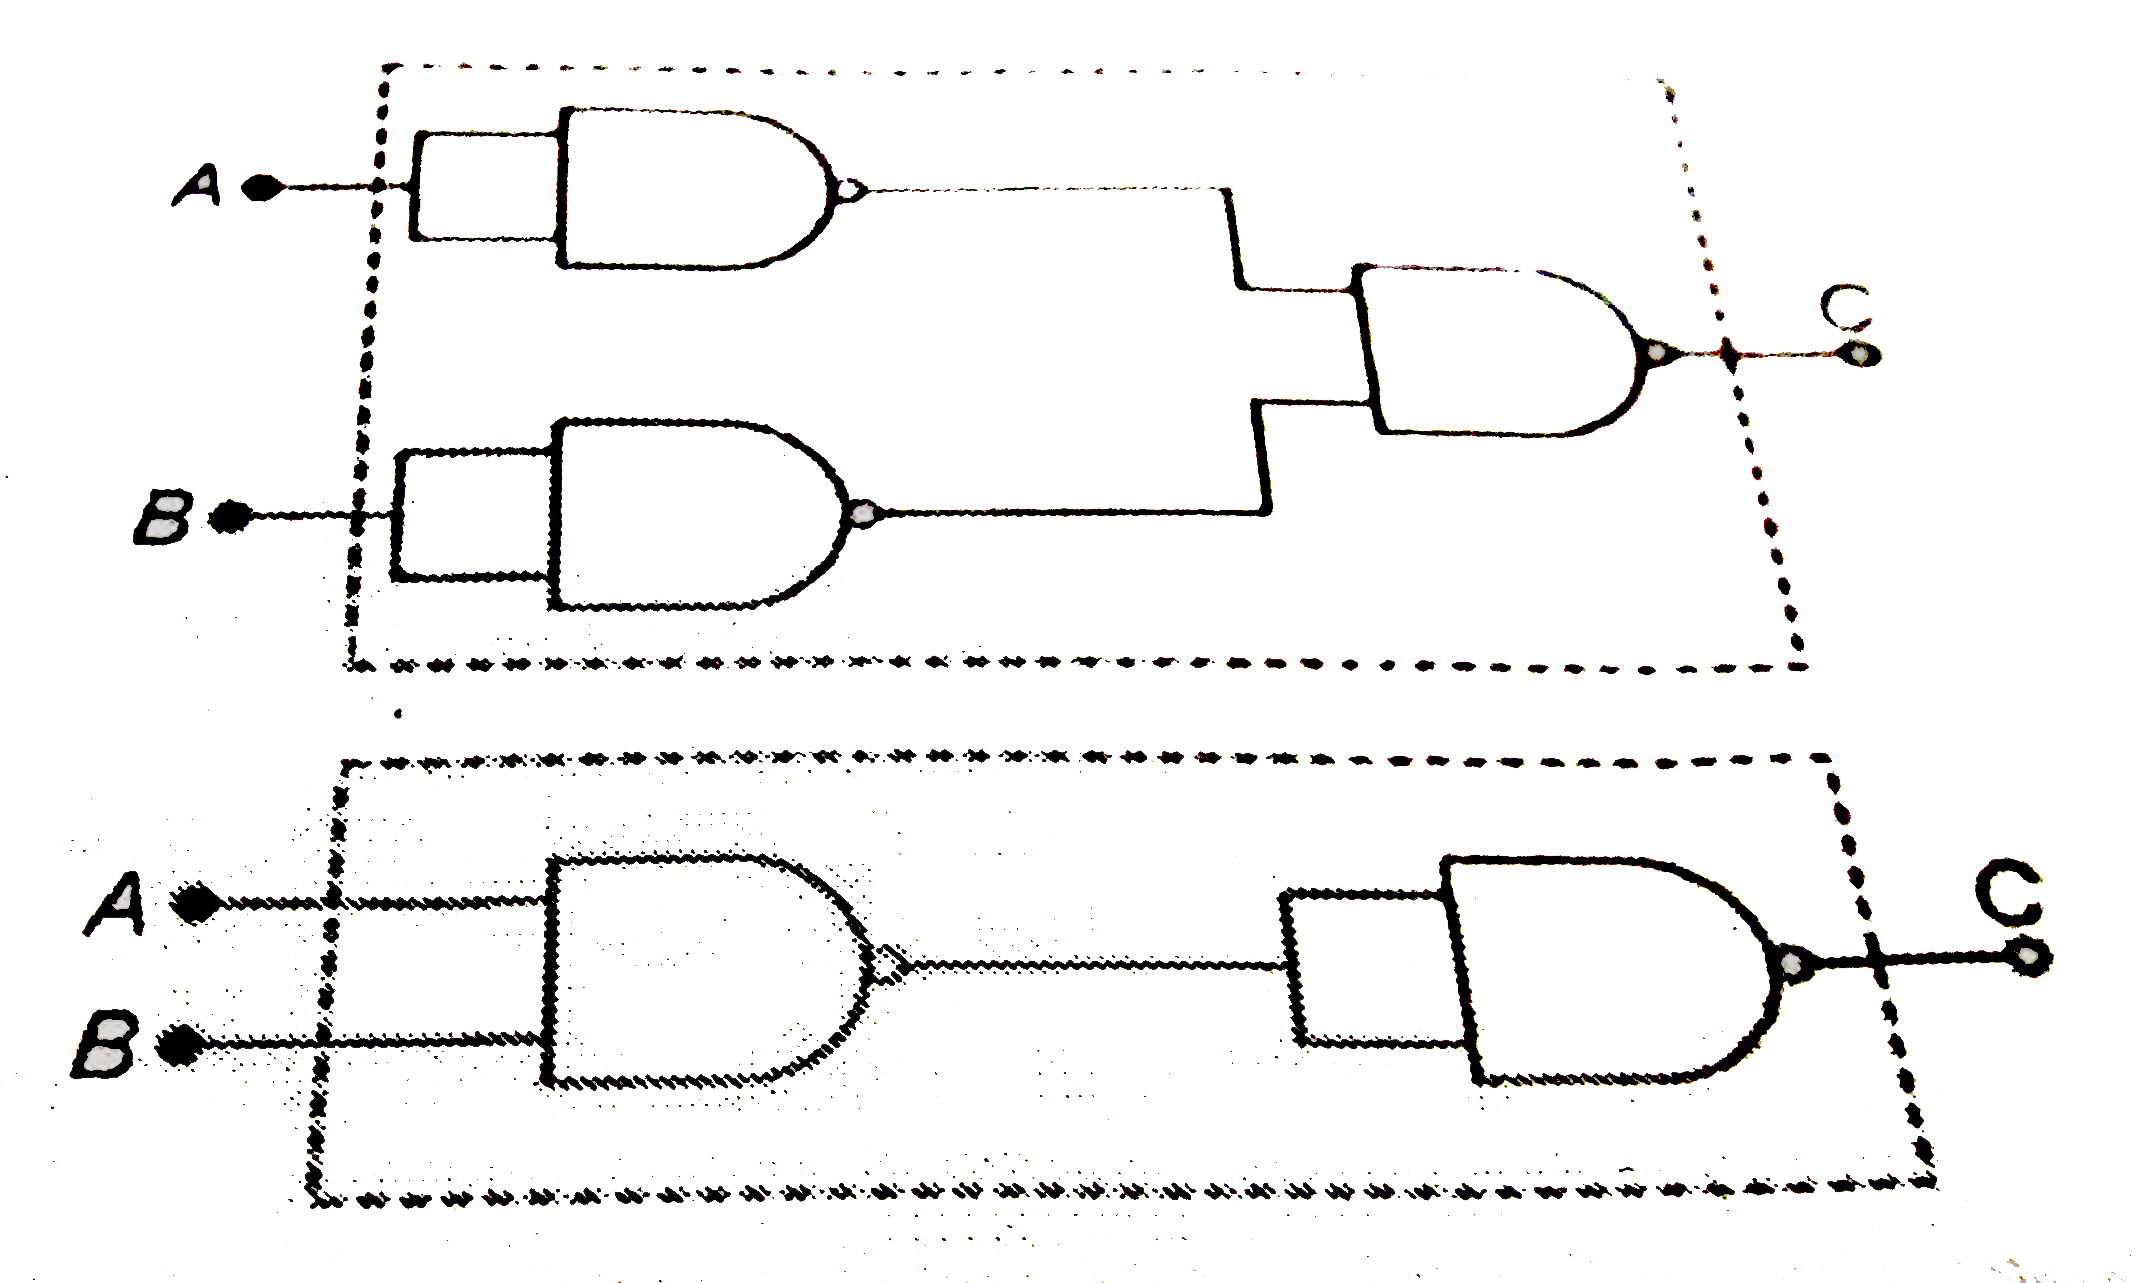
View SolutionThe combination of gates shown here are equivalent to
View Solution

