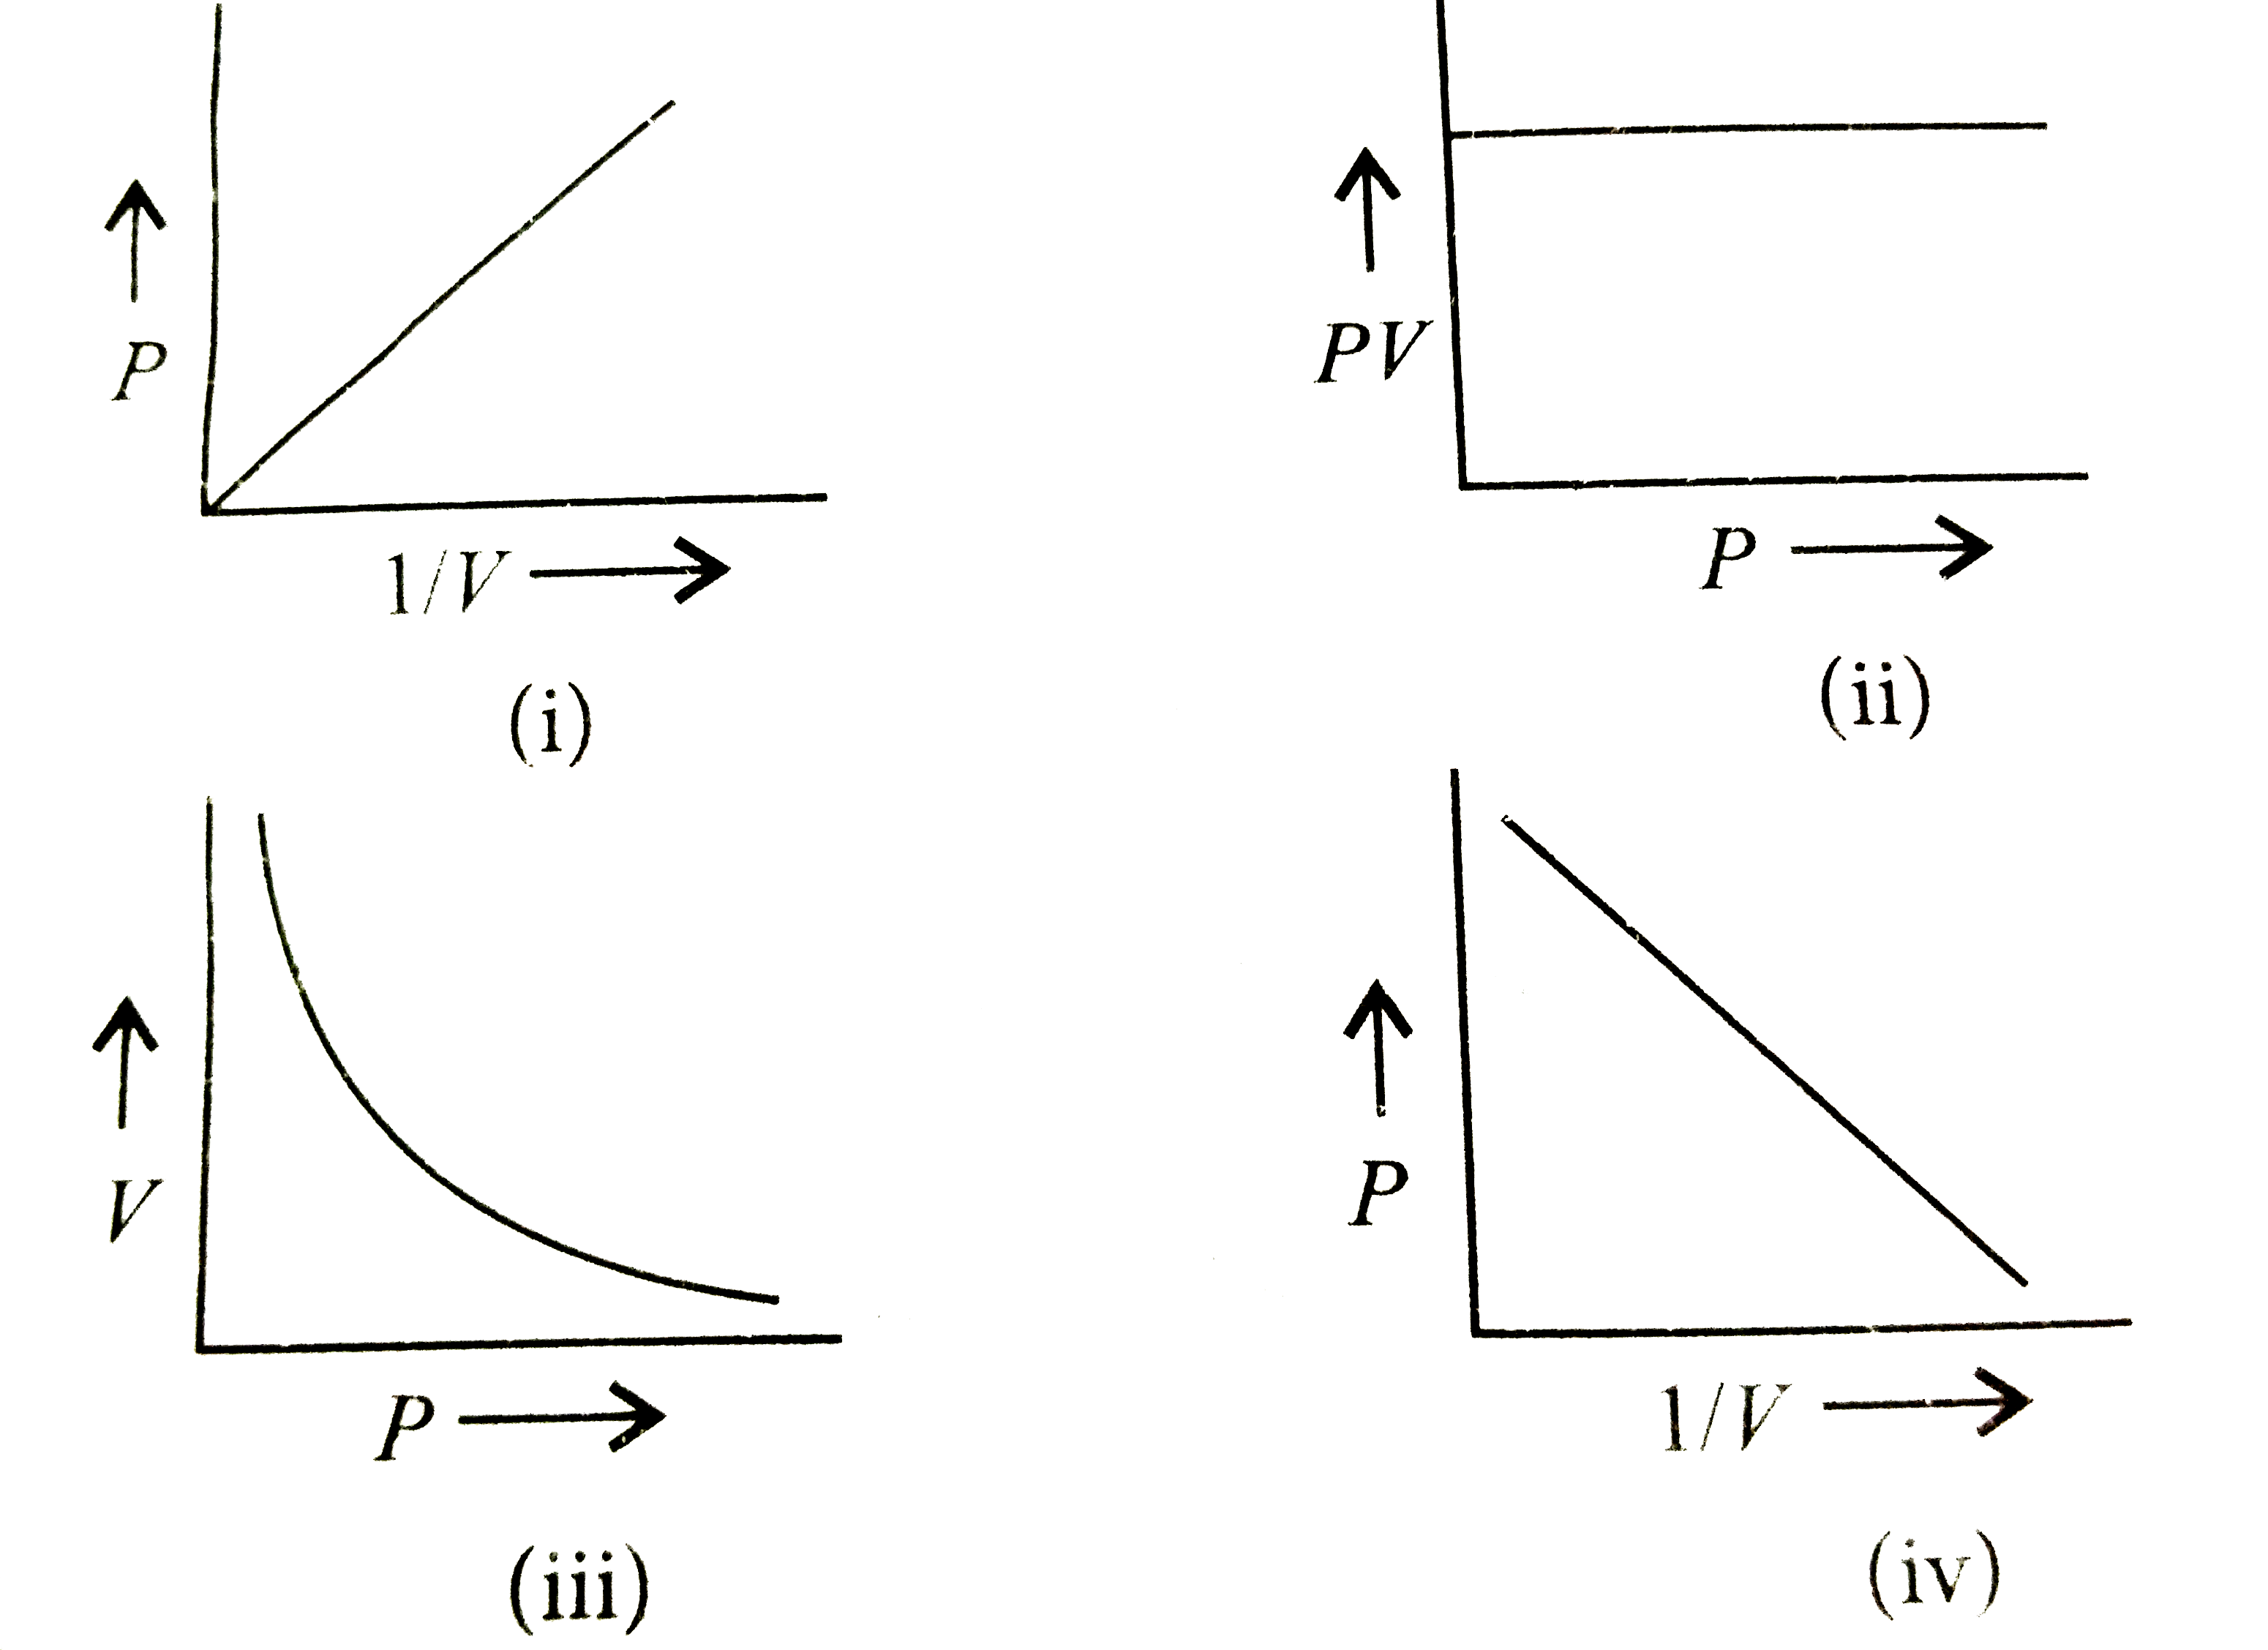
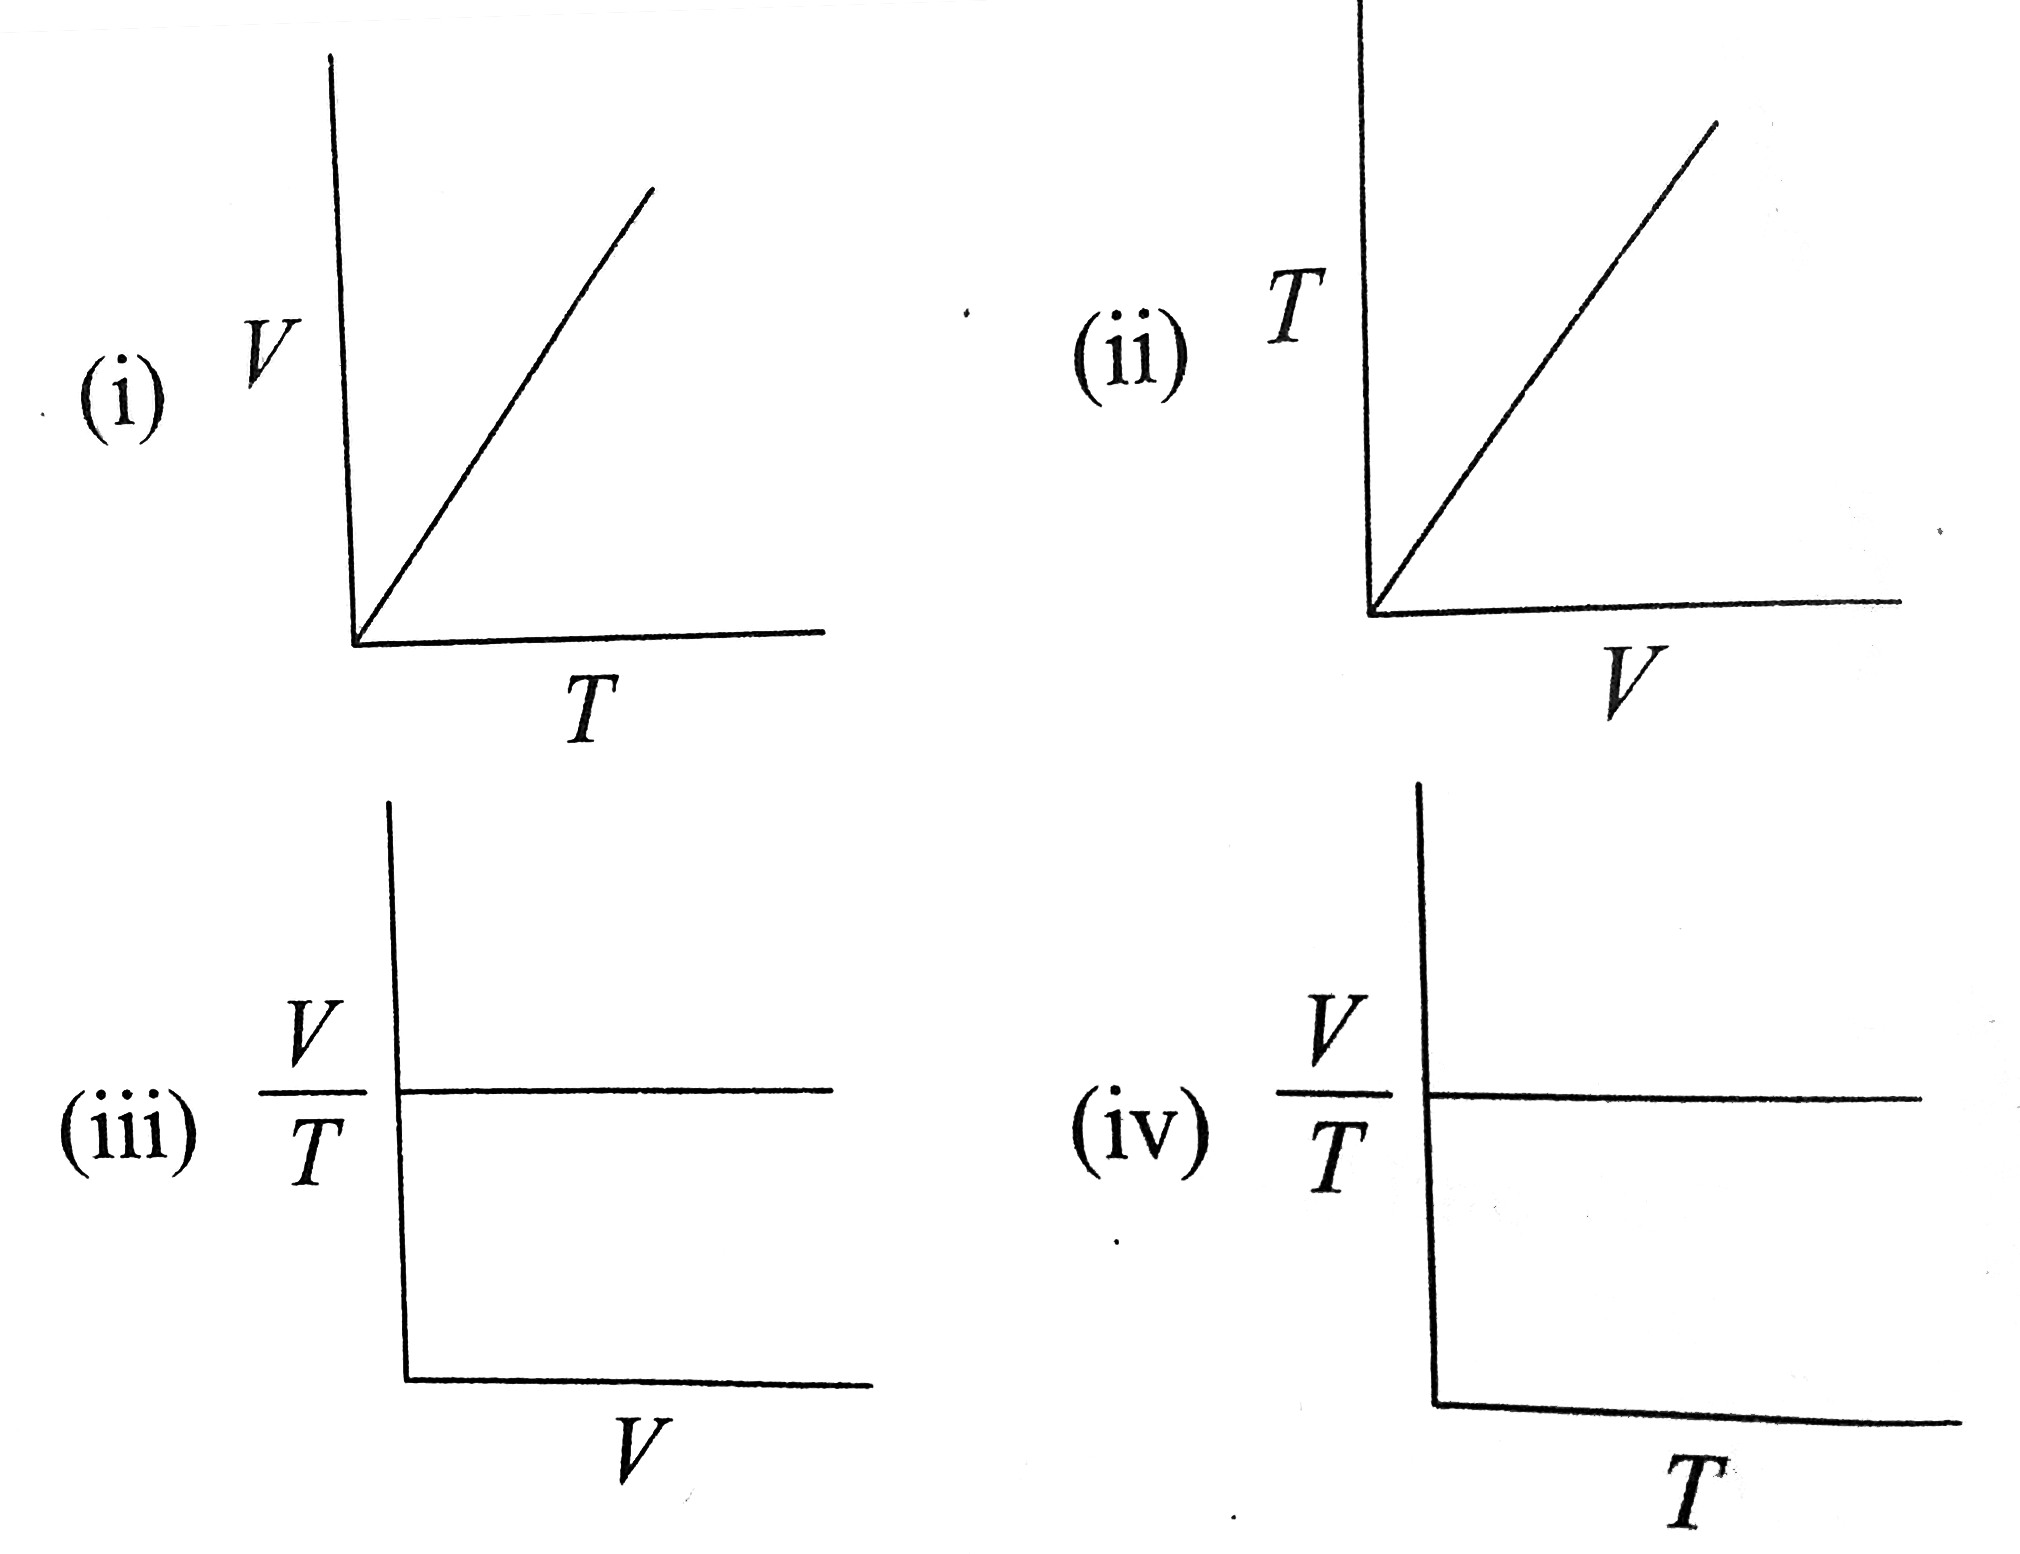
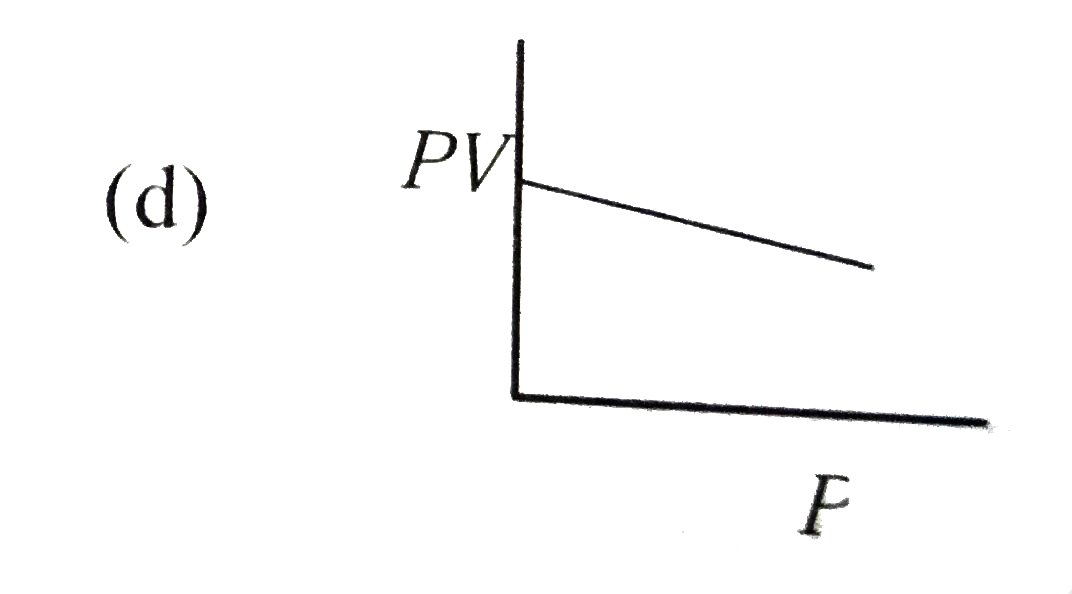
Which of the following graphs represents Boyle's law correctly?
(i) 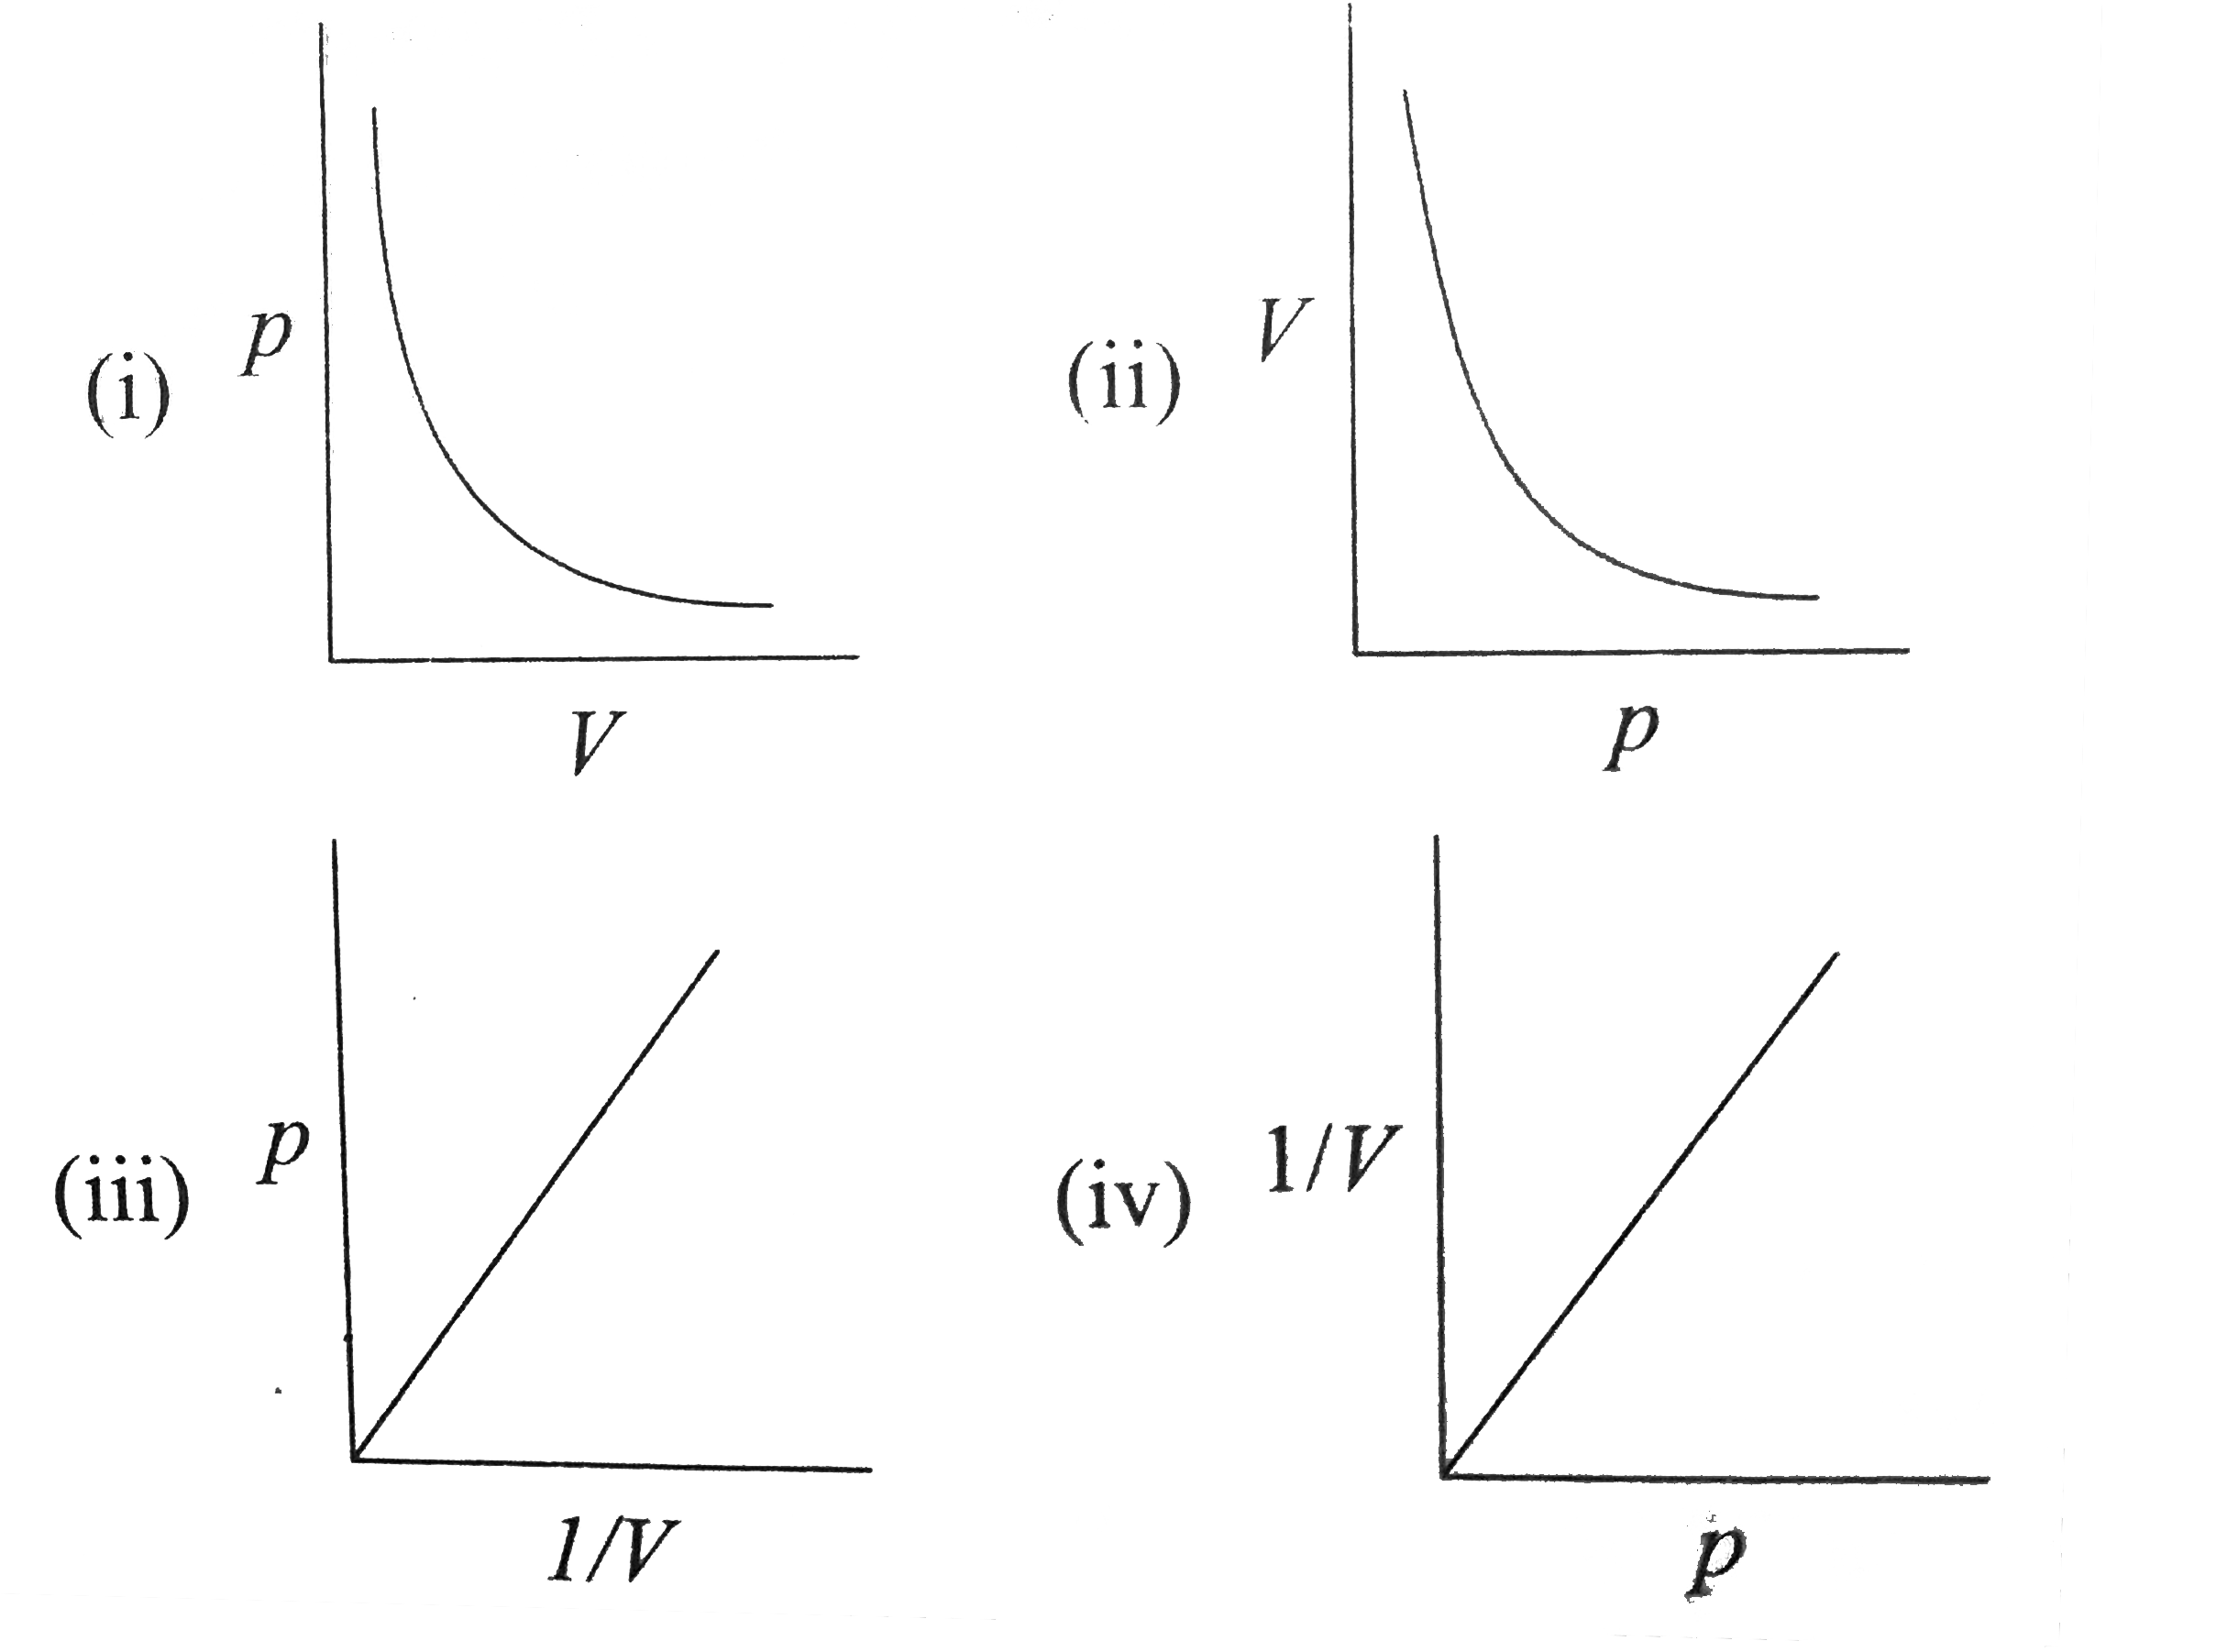
A
B

C

D
Video Solution
Text Solution
The correct Answer is:BC
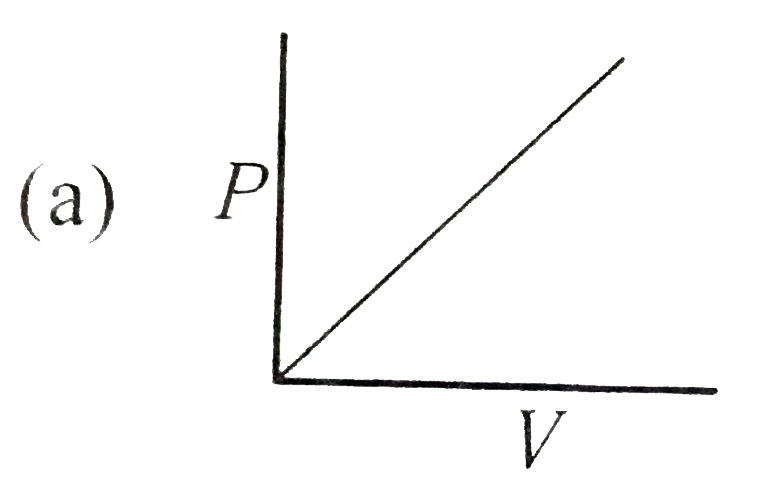
According to Boyle's Law PV= constant at constant temperature either P increases or V increases both ( b) & (c ) may be correct.
|
Topper's Solved these Questions
- GASEOUS STATE BOOK - ERRORLESS CHAPTER - GASEOUS STATE EXERCISE - ORDINARY THINKING (Objective Questions) Kinetic theory of gases and Molecular collisions
28 Videos
- GASEOUS STATE BOOK - ERRORLESS CHAPTER - GASEOUS STATE EXERCISE - ORDINARY THINKING (Objective Questions) Molecular speeds
24 Videos
- GASEOUS STATE BOOK - ERRORLESS CHAPTER - GASEOUS STATE EXERCISE - JEE SECTION JEE (Advanced) 2018 Numeric answer type question
1 Videos
- ENVIRONMENTAL CHEMISTRYBOOK - ERRORLESS CHAPTER - ENVIRONMENTAL CHEMISTRYEXERCISE - CRITICAL THINKING (Objective question )
16 Videos
- GENERAL ORGANIC CHEMISTRYBOOK - ERRORLESS CHAPTER - GENERAL ORGANIC CHEMISTRYEXERCISE - Matrix Match type questions
4 Videos
Similar Questions
Knowledge Check
Which of the following graph represents Boyle's law ?
A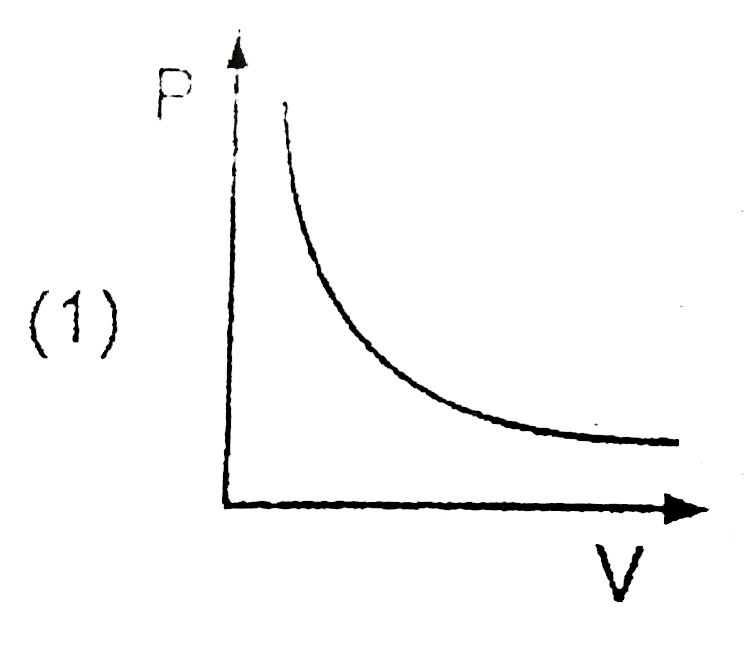 B
B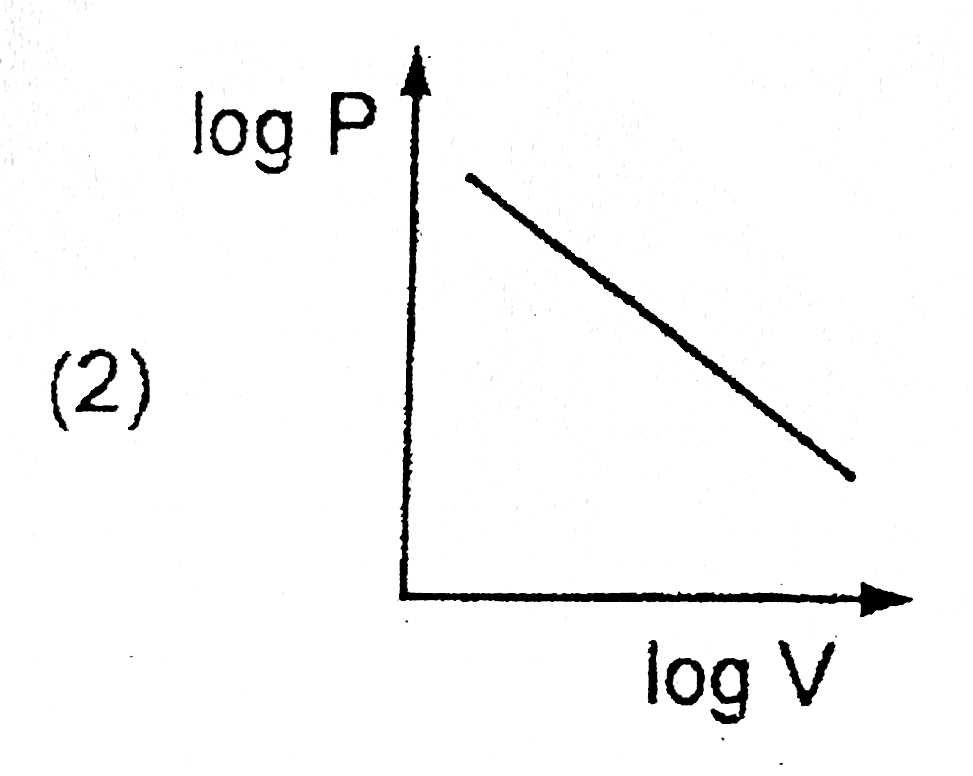 C
C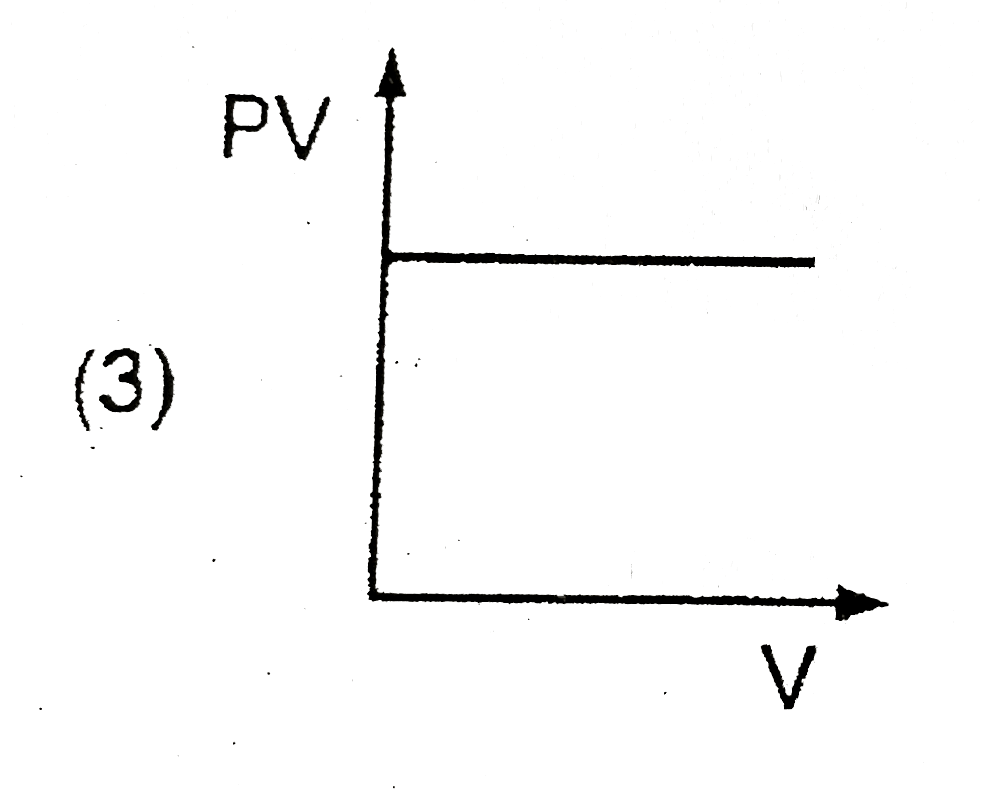 DAll of these
Which of the following graph represent Boyle's law ?
A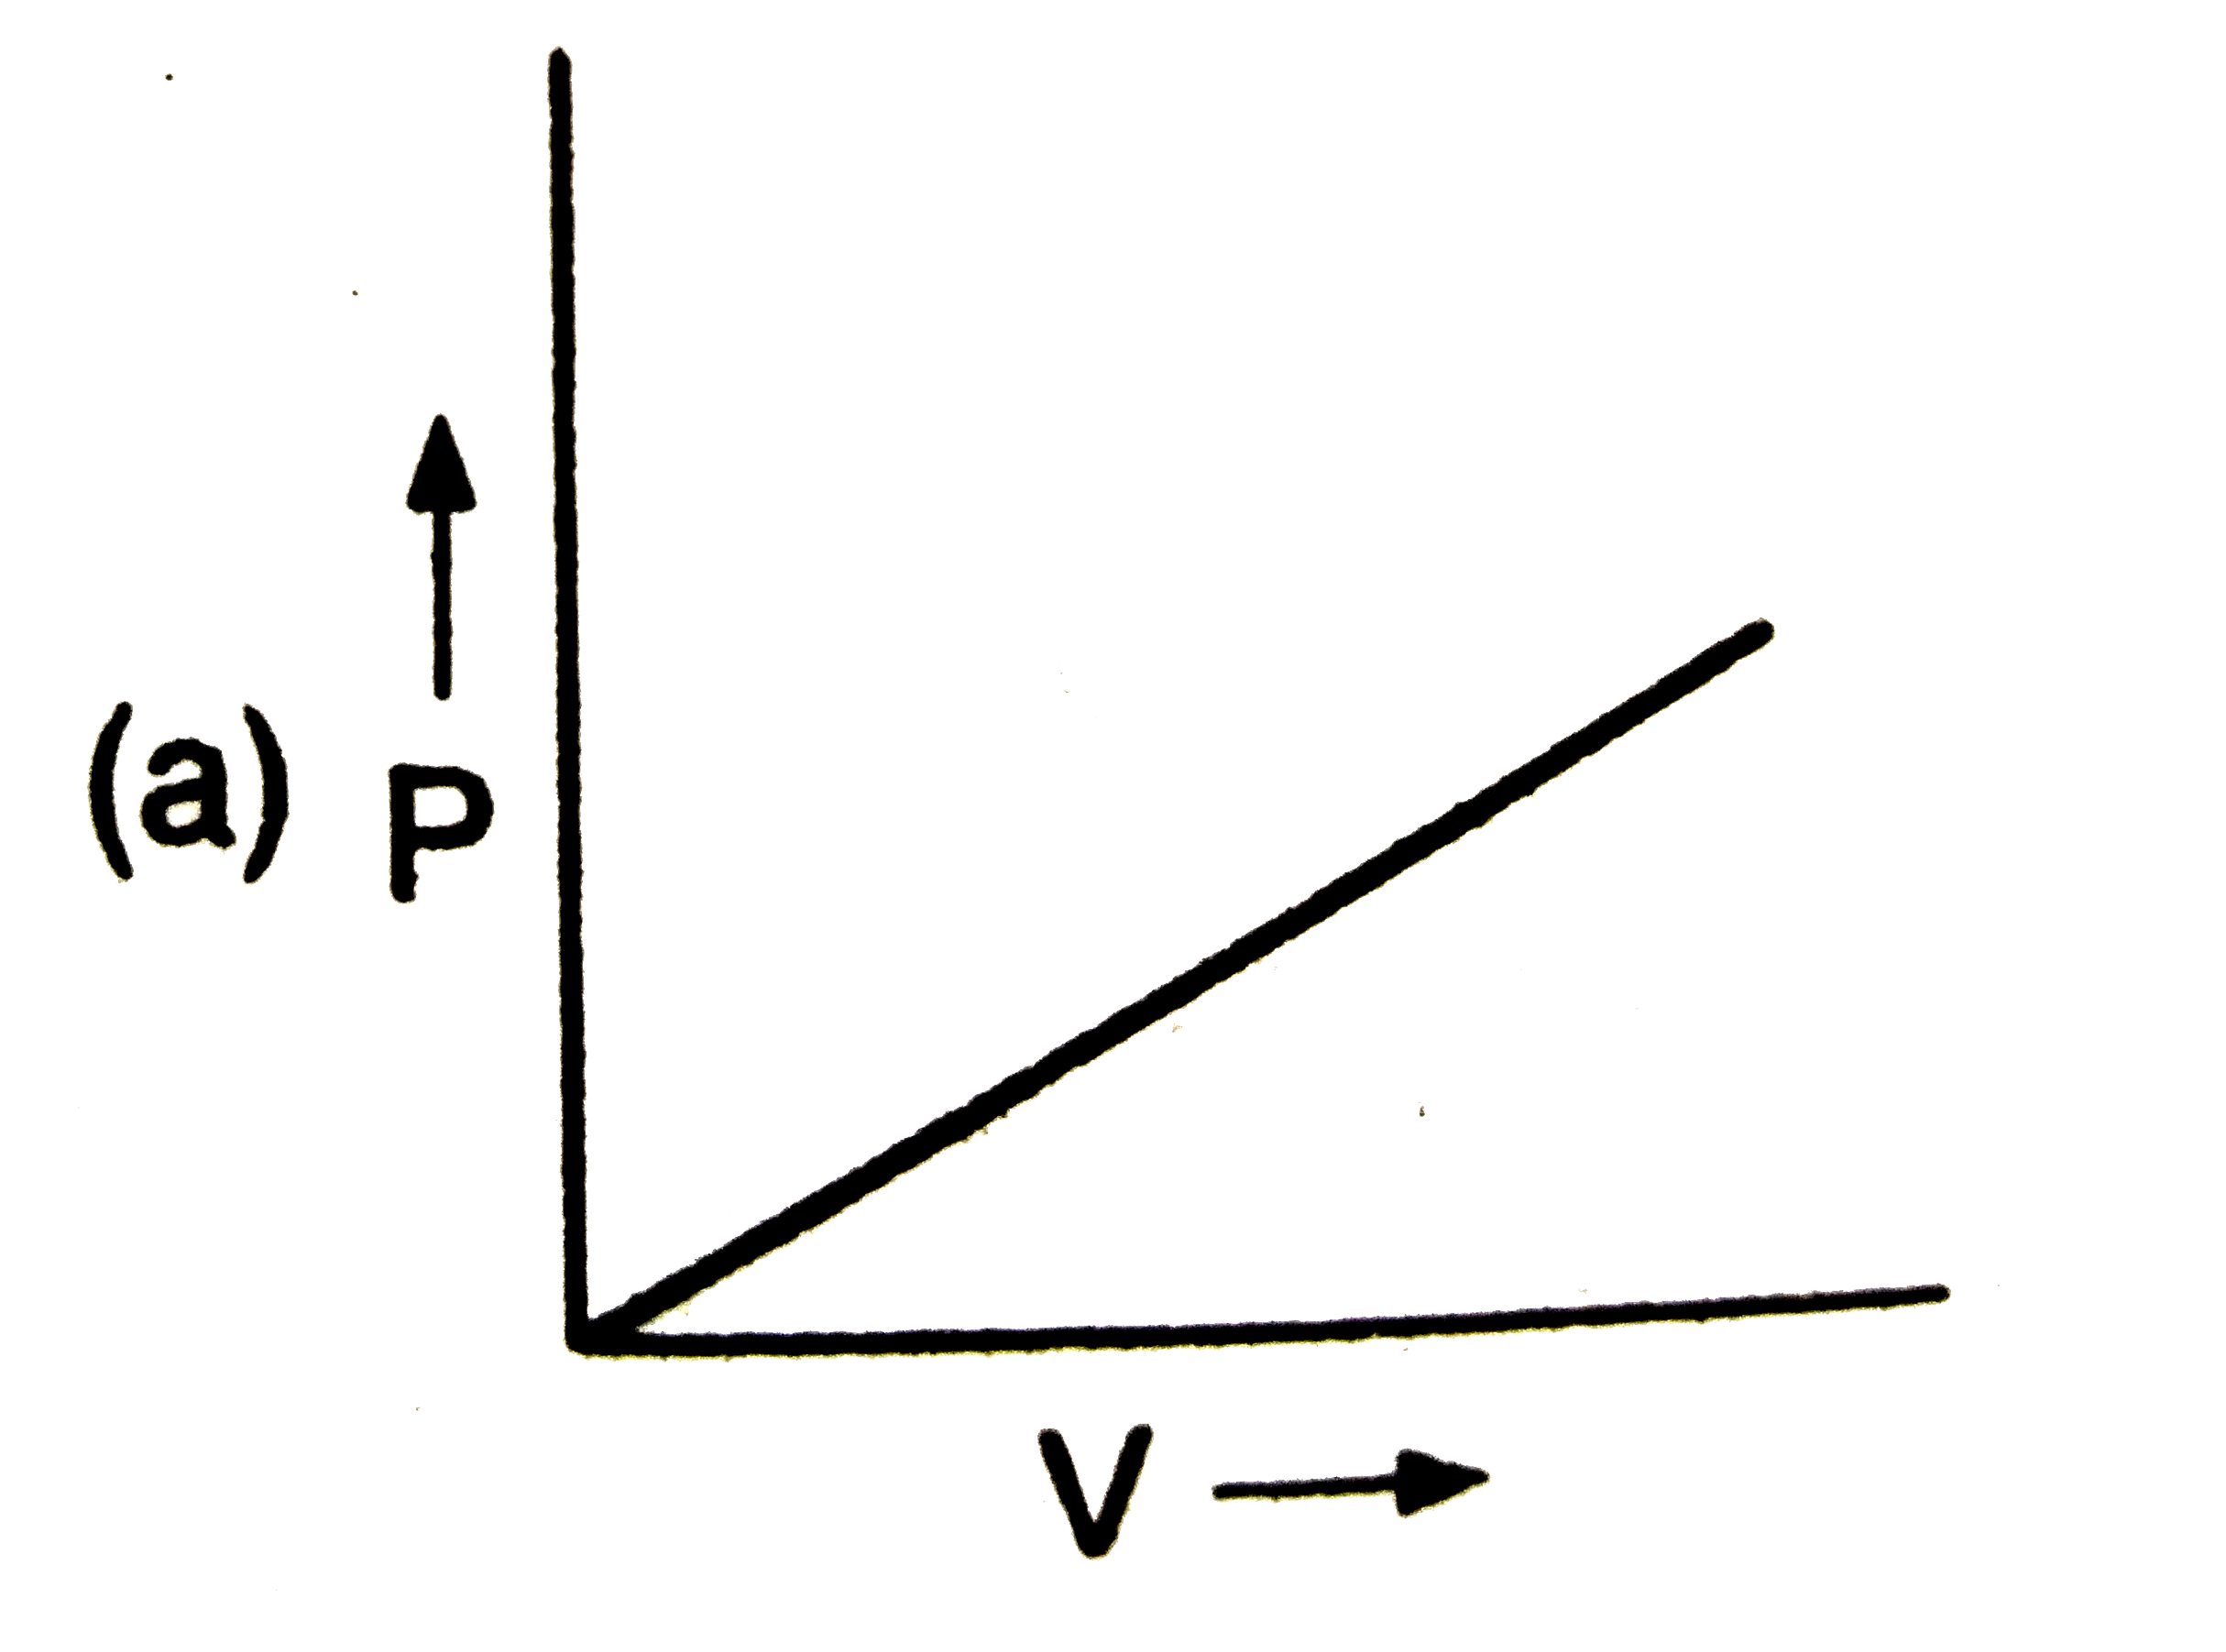 B
B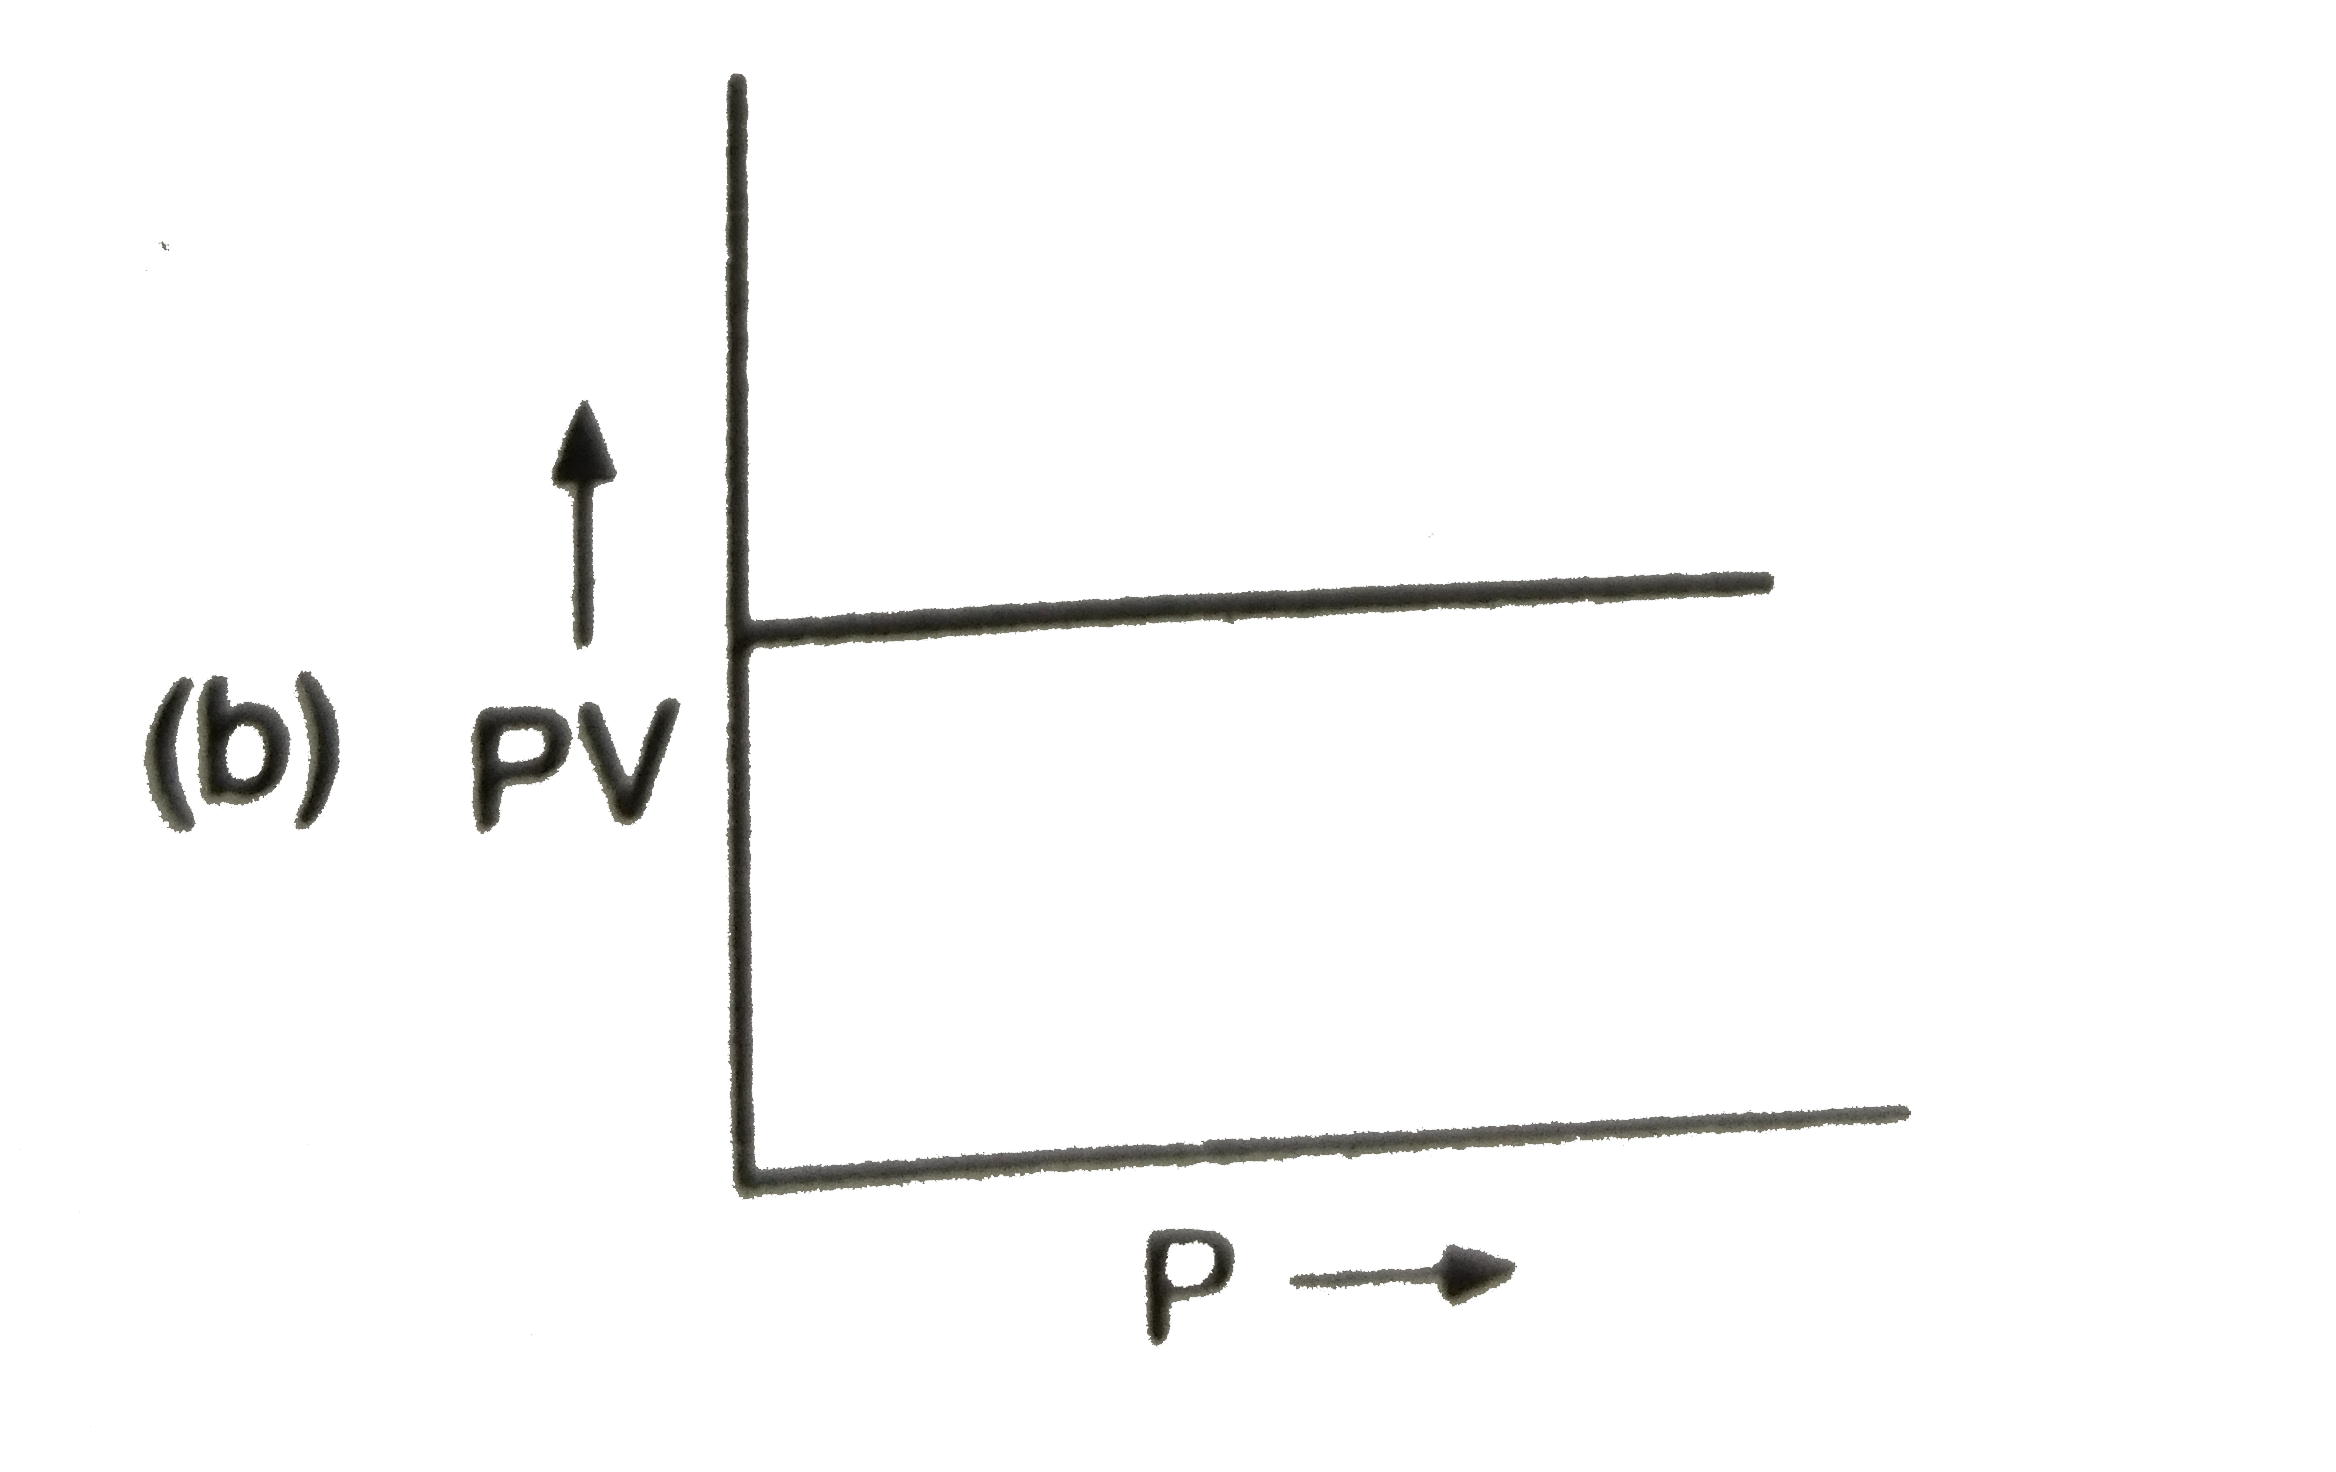 C
C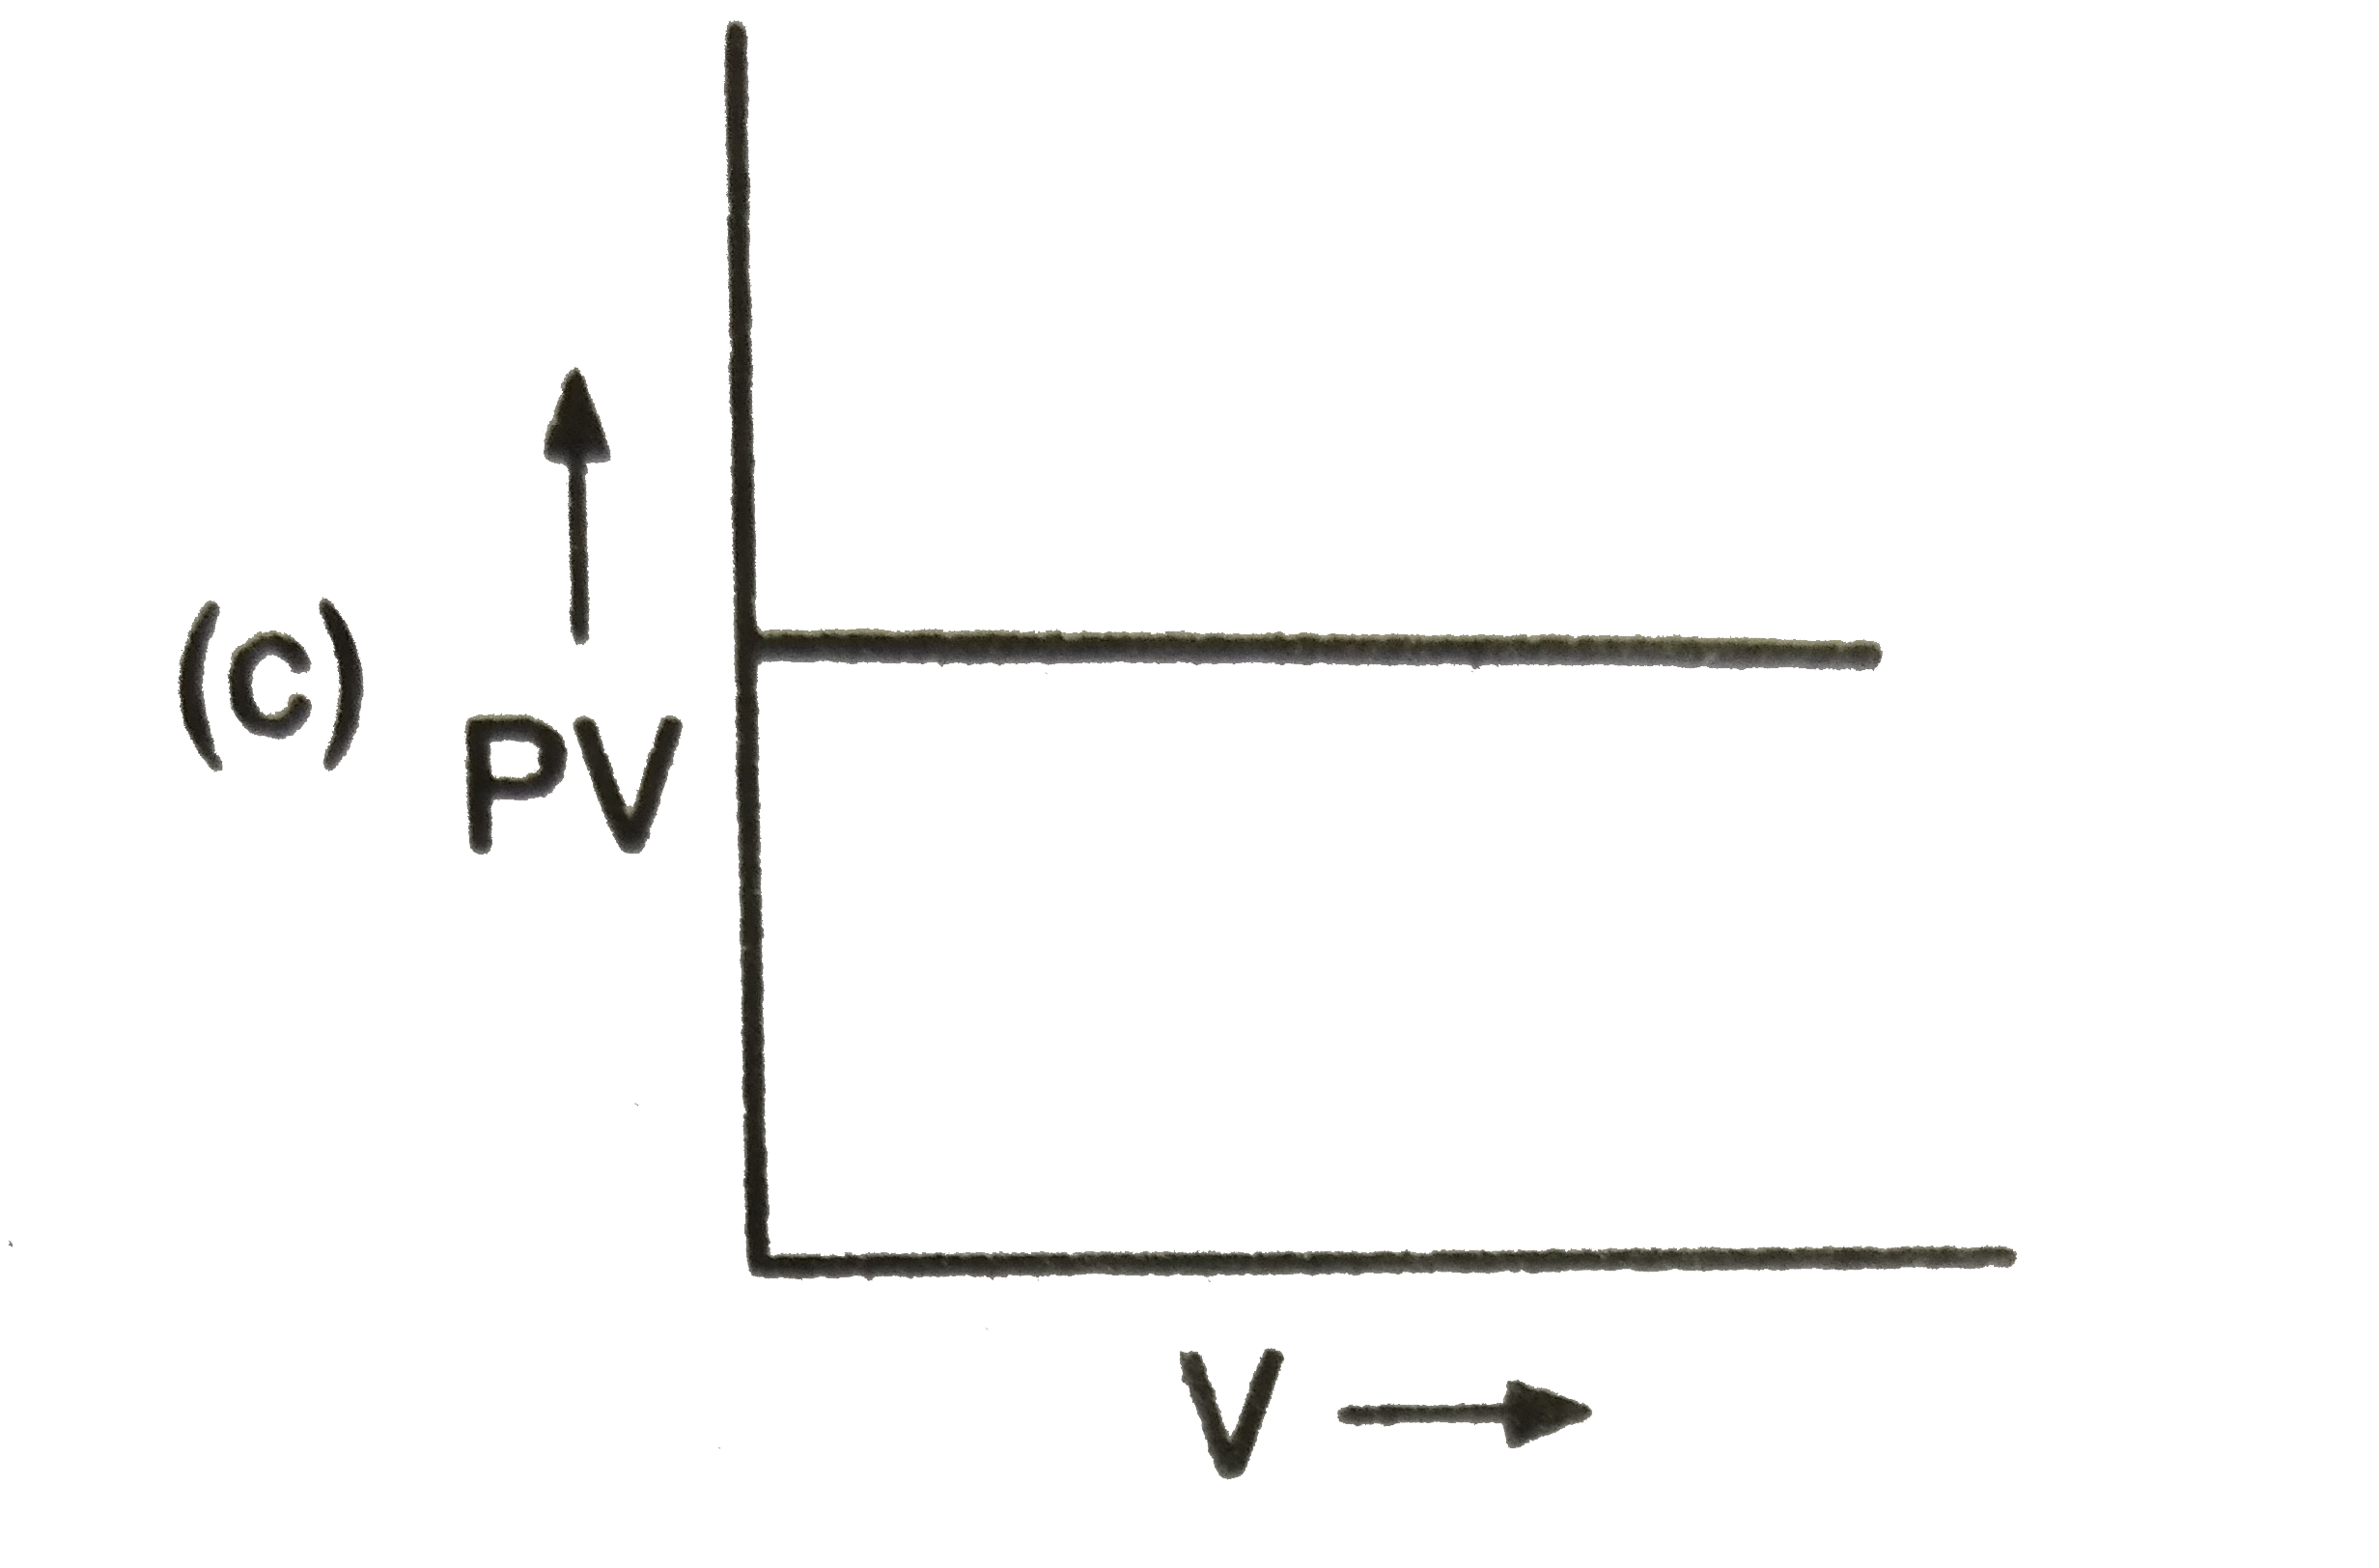 D
D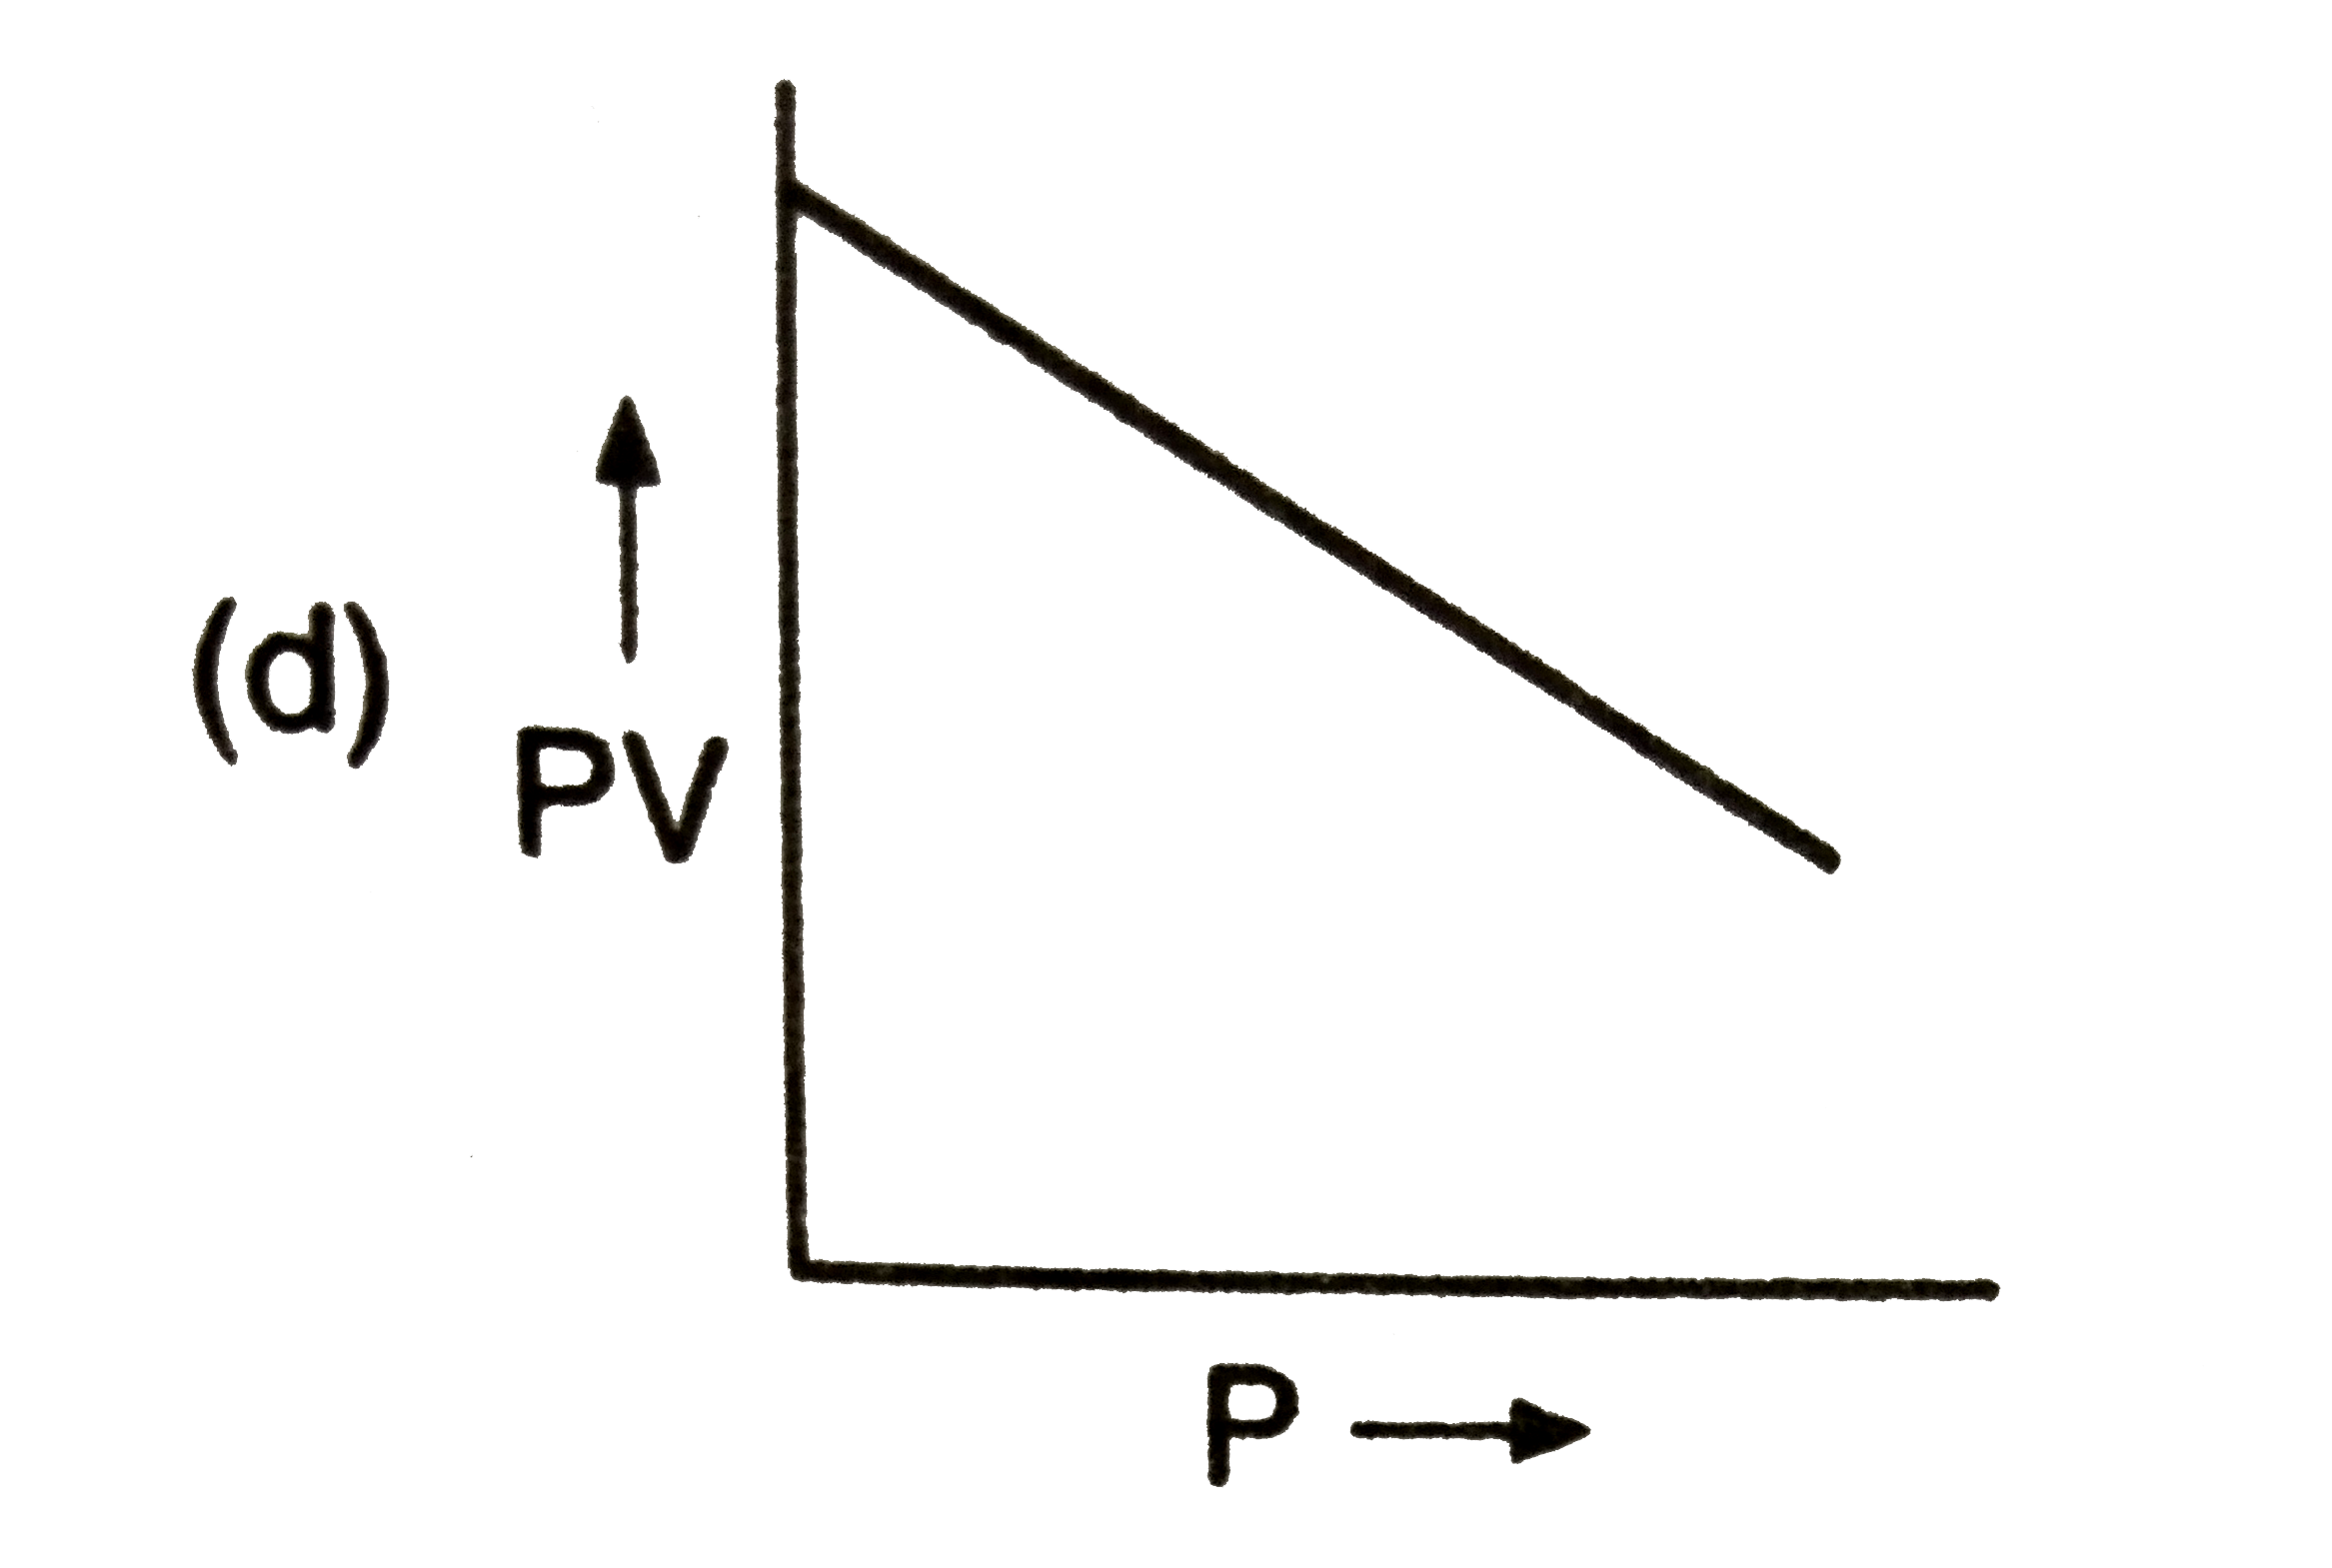
Which of the following graph represents Boyle's law ?
A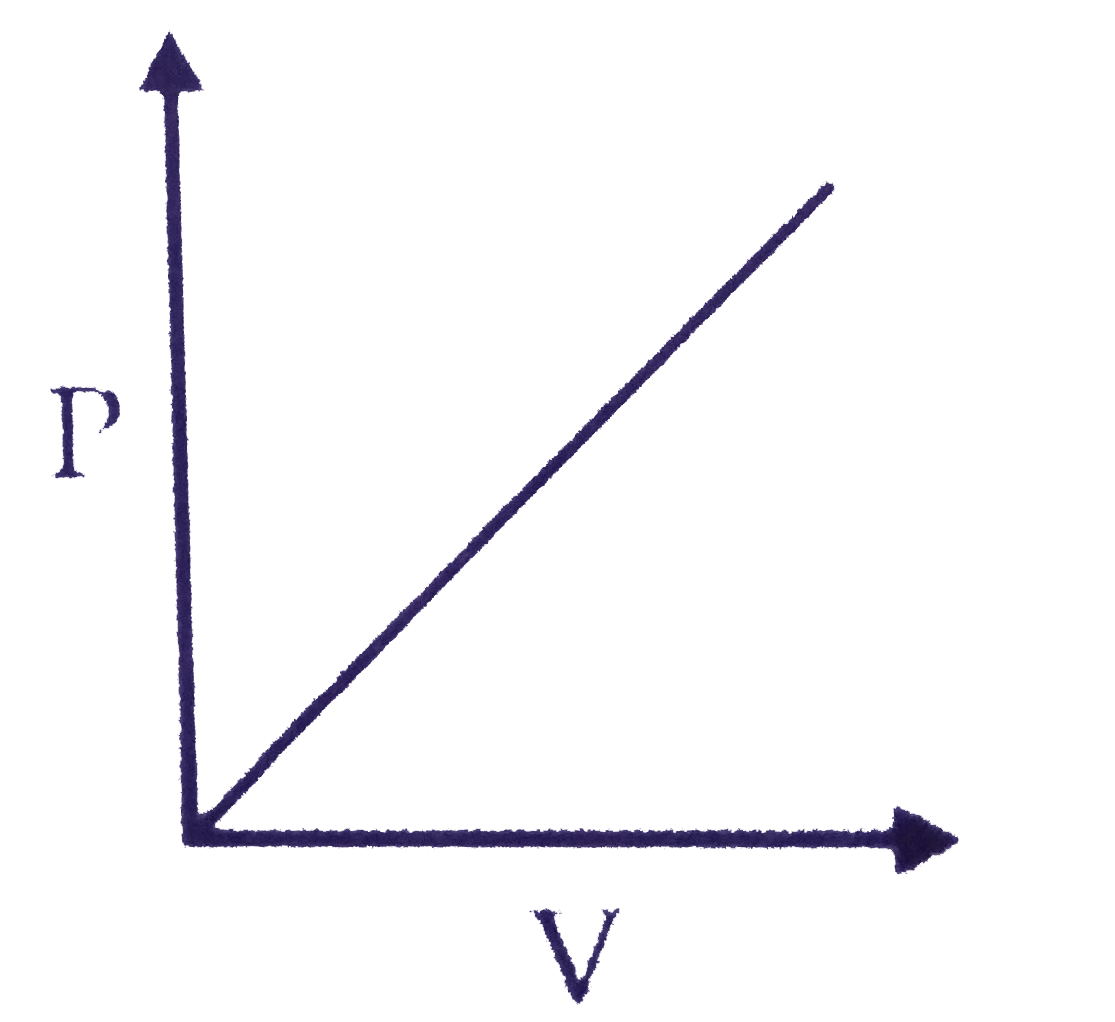 B
B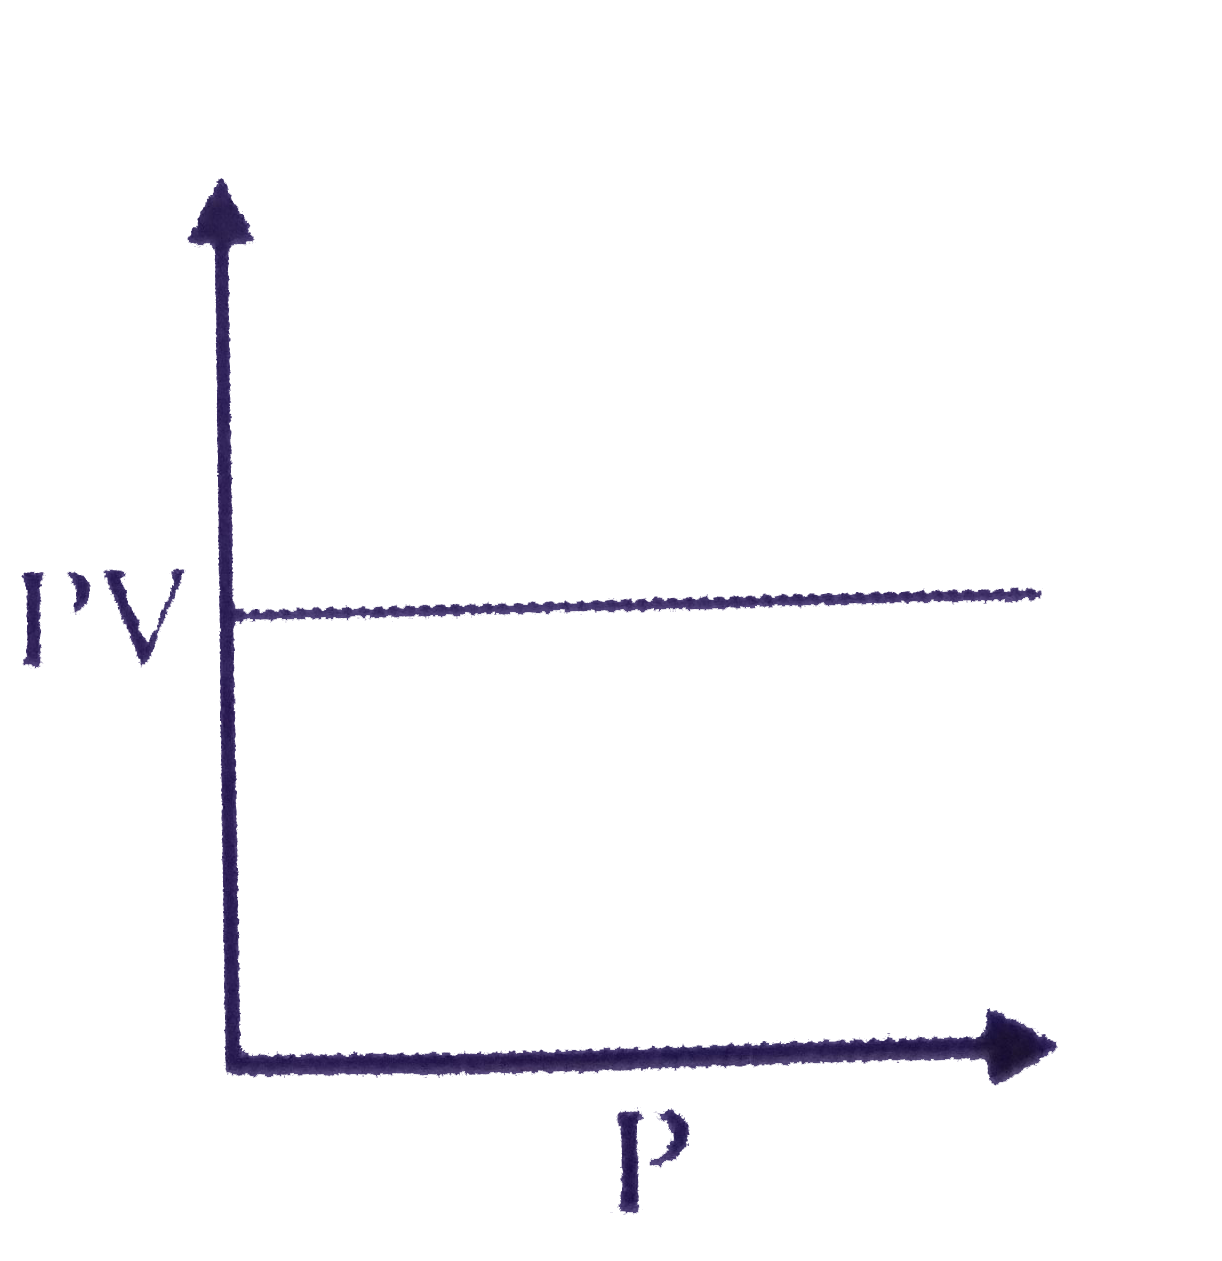 C
C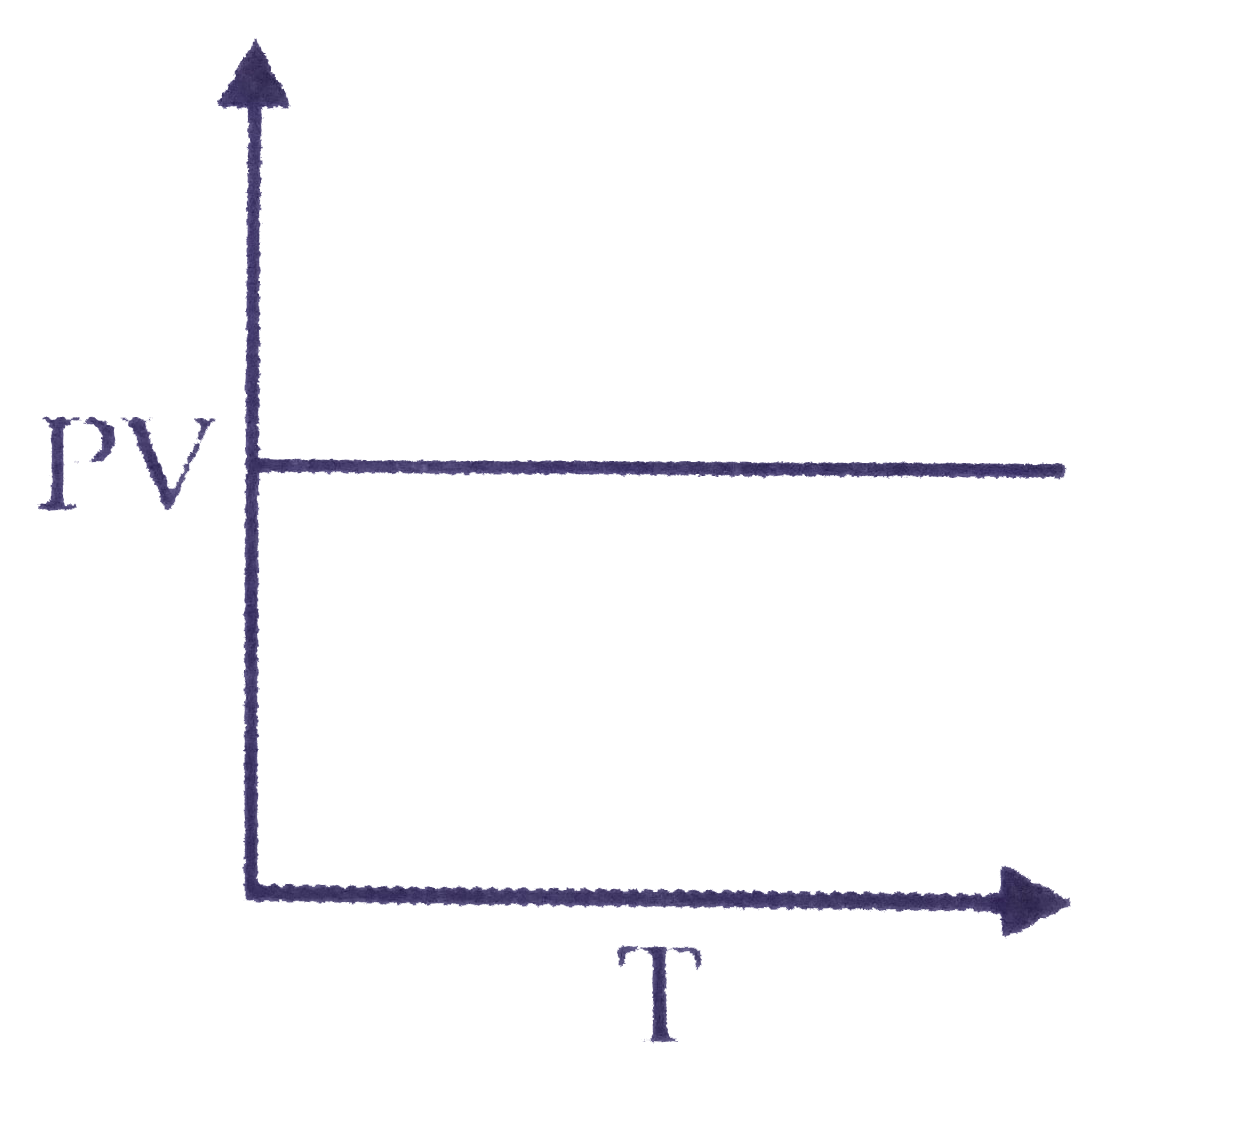 D
D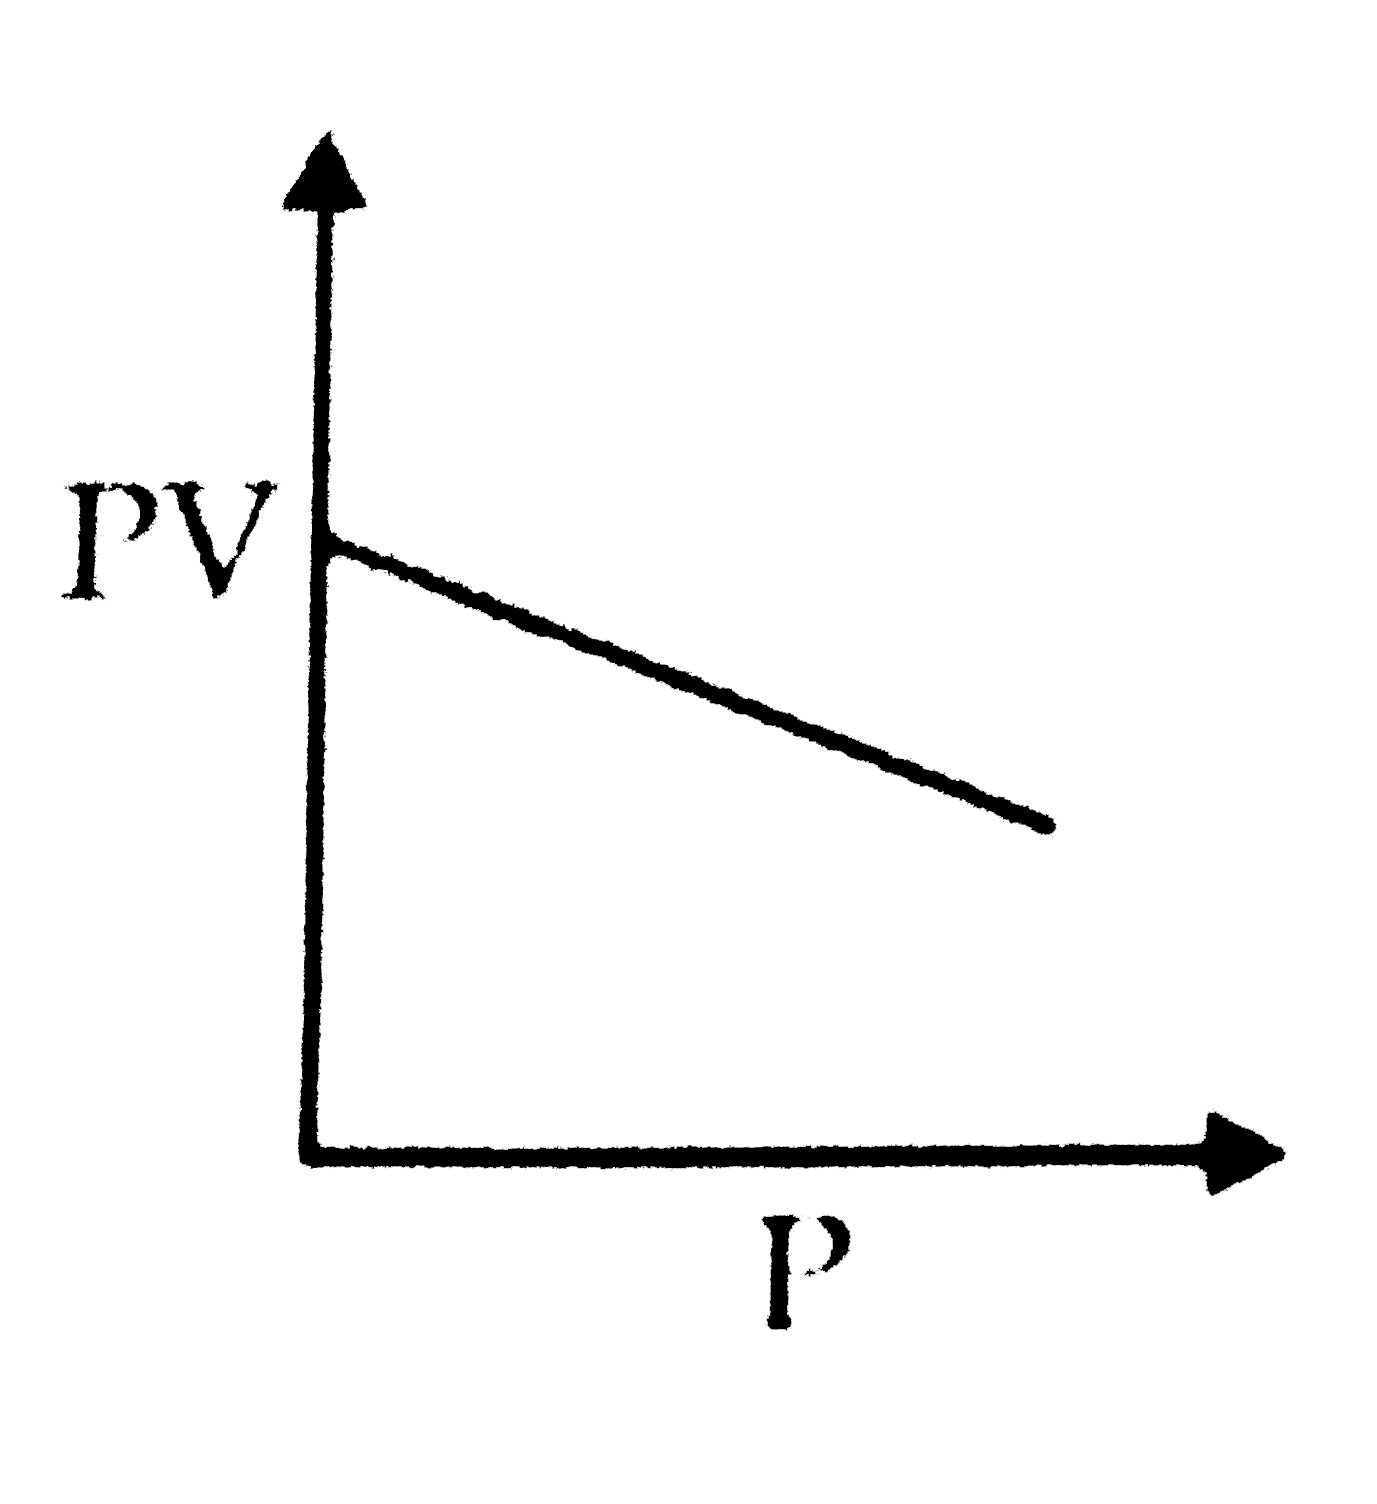
Which of the following curves represent(s) Boyle's law?
View SolutionOne of the following represents the Boyle's law .
View SolutionWhich of the following graphs represents correctly the variations of 0.5mv2max with the intensity of incident radiations of a constant frequency ?
View SolutionWhich of the following plots does not represent Boyle's law?
View SolutionWhich of the following curve does not represent Boyle's law?
View Solution

