Which of the following graphs represent function whose derivatives have a maximum in the interval (0,1) ?
B 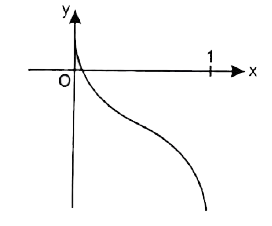
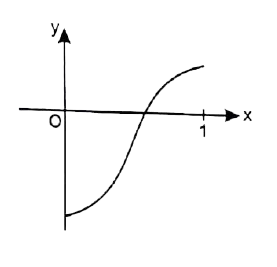
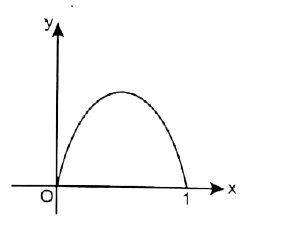
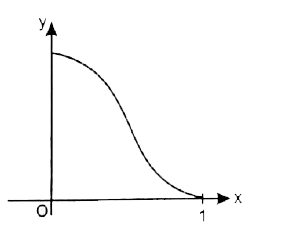
The correct Answer is:A, B
To determine which of the given graphs represents a function whose derivatives have a maximum in the interval (0, 1), we need to analyze the concavity of the function and its derivative.
1. Understanding the Problem:
- We need to find a function f(x) such that its derivative f′(x) has a maximum in the interval (0,1).
- This means that f′(x) should change its concavity in this interval.
2. Concept of Concavity:
- If f′(x) has a maximum in the interval (0,1), then the second derivative f′′(x) must change sign in this interval.
- Specifically, f′′(x) should be positive before the maximum and negative after the maximum, indicating a change from concave up to concave down.
3. Analyzing the Options:
- We will examine each option to see if the graph of the function f(x) shows a change in concavity in the interval (0,1).
4. Option 1:
- If the graph is concave up before x=1 and concave down after x=1, then f′(x) has a maximum in the interval (0,1).
- This option satisfies the condition.
5. Option 2:
- Similar to Option 1, if the graph shows a change from concave up to concave down in the interval (0,1), then this option also satisfies the condition.
6. Option 3:
- If the graph does not show a change in concavity or remains either concave up or concave down throughout the interval, then this option does not satisfy the condition.
7. Option 4:
- If the graph shows a change from concave up to concave down in the interval (0,1), then this option satisfies the condition.
8. Conclusion:
- Based on the analysis, Options 1, 2, and 4 represent functions whose derivatives have a maximum in the interval (0,1).
- Therefore, the final answer is: Options 1, 2, and 4 are correct.
- We need to find a function f(x) such that its derivative f′(x) has a maximum in the interval (0,1).
- This means that f′(x) should change its concavity in this interval.
- If f′(x) has a maximum in the interval (0,1), then the second derivative f′′(x) must change sign in this interval.
- Specifically, f′′(x) should be positive before the maximum and negative after the maximum, indicating a change from concave up to concave down.
- We will examine each option to see if the graph of the function f(x) shows a change in concavity in the interval (0,1).
- If the graph is concave up before x=1 and concave down after x=1, then f′(x) has a maximum in the interval (0,1).
- This option satisfies the condition.
- Similar to Option 1, if the graph shows a change from concave up to concave down in the interval (0,1), then this option also satisfies the condition.
- If the graph does not show a change in concavity or remains either concave up or concave down throughout the interval, then this option does not satisfy the condition.
- If the graph shows a change from concave up to concave down in the interval (0,1), then this option satisfies the condition.
- Based on the analysis, Options 1, 2, and 4 represent functions whose derivatives have a maximum in the interval (0,1).
- Therefore, the final answer is: Options 1, 2, and 4 are correct.
Topper's Solved these Questions
- BOOK - VIKAS GUPTA (BLACK BOOK) ENGLISHCHAPTER - APPLICATION OF DERIVATIVES EXERCISE - EXERCISE (COMPREHENSION TYPE PROBLEMS)15videos
APPLICATION OF DERIVATIVES
- BOOK - VIKAS GUPTA (BLACK BOOK) ENGLISHCHAPTER - APPLICATION OF DERIVATIVES EXERCISE - EXERCISE (MATHCING TYPE PROBLEMS)6videos
APPLICATION OF DERIVATIVES
- BOOK - VIKAS GUPTA (BLACK BOOK) ENGLISHCHAPTER - APPLICATION OF DERIVATIVES EXERCISE - EXERCISE (SUBJECTIVE TYPE PROBLEMS)22videos
APPLICATION OF DERIVATIVES
- BOOK - VIKAS GUPTA (BLACK BOOK) ENGLISHCHAPTER - AREA UNDER CURVESEXERCISE - AXERCISE (SUBJECTIVE TYPE PROBLEMS)8videos
AREA UNDER CURVES
Similar Questions
Knowledge Check
- Question 1 - Select One
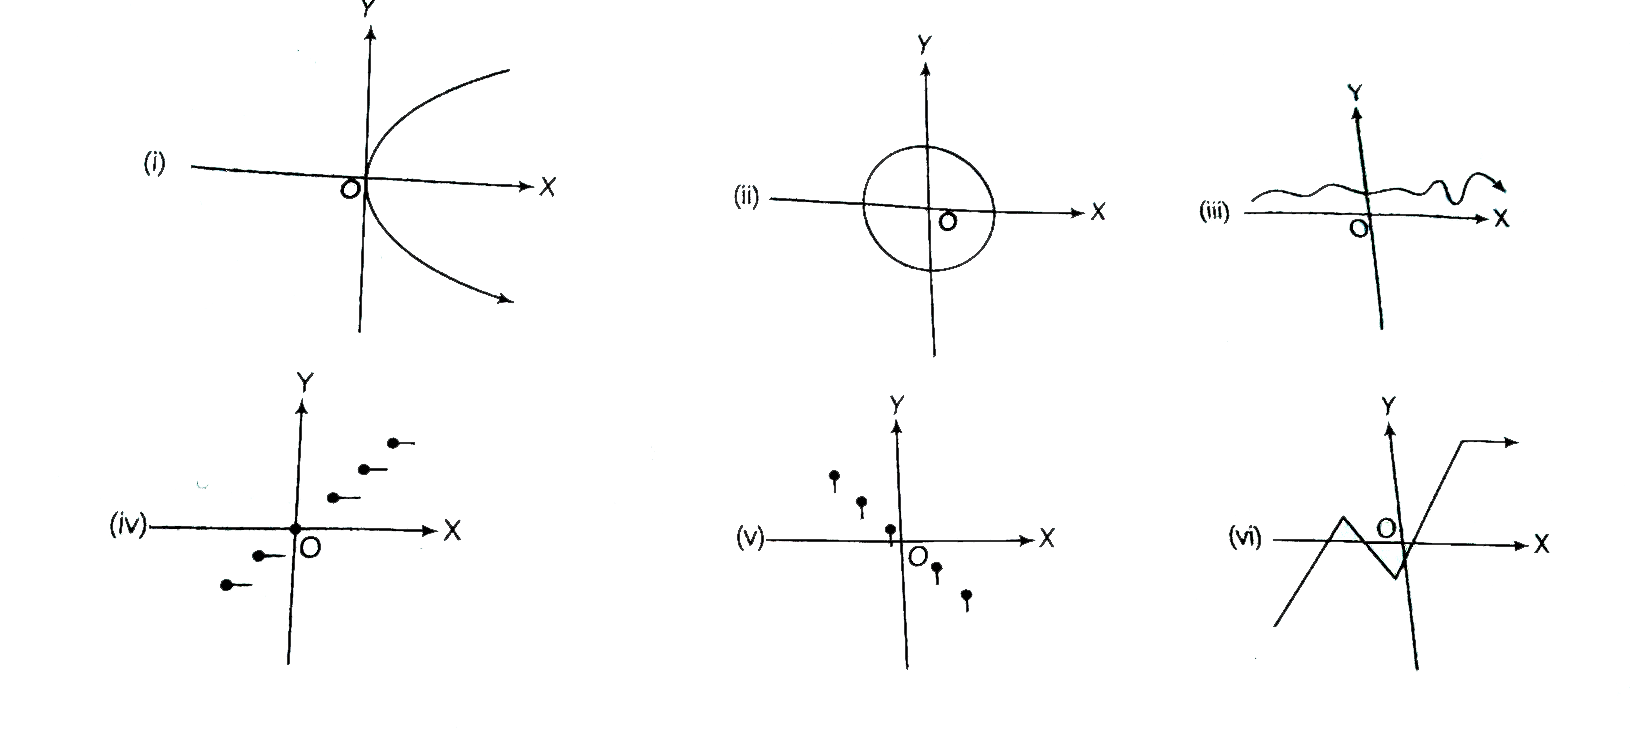
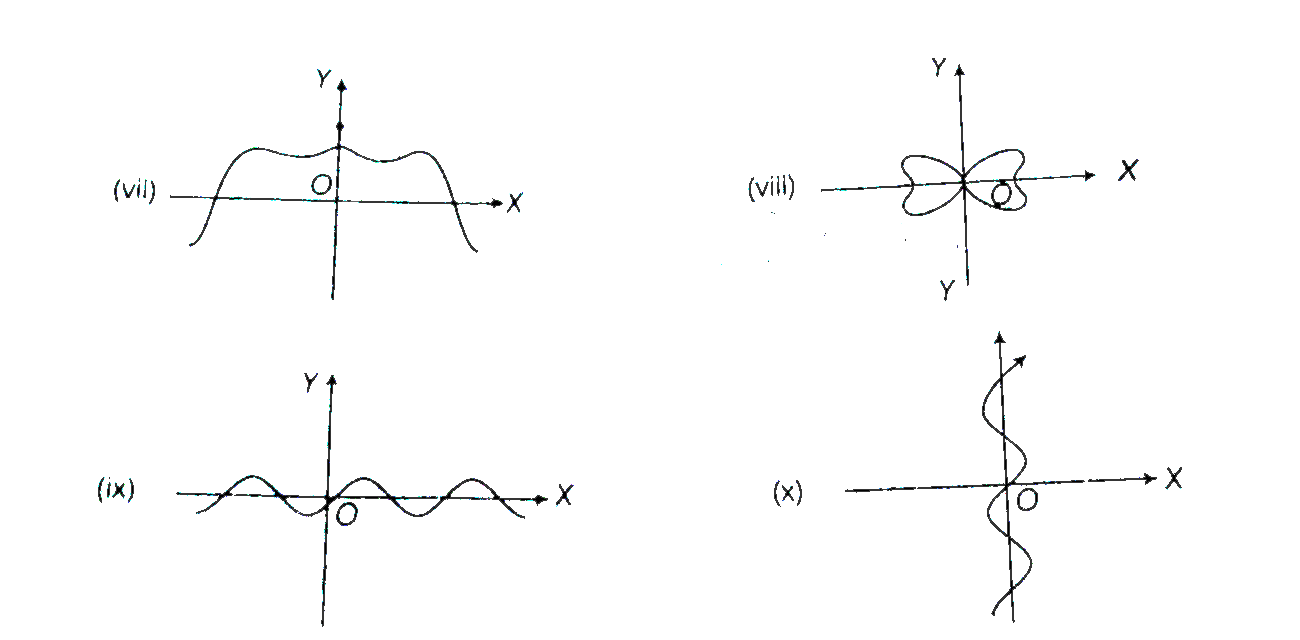
Which of the following graphs is NOT a function ?
A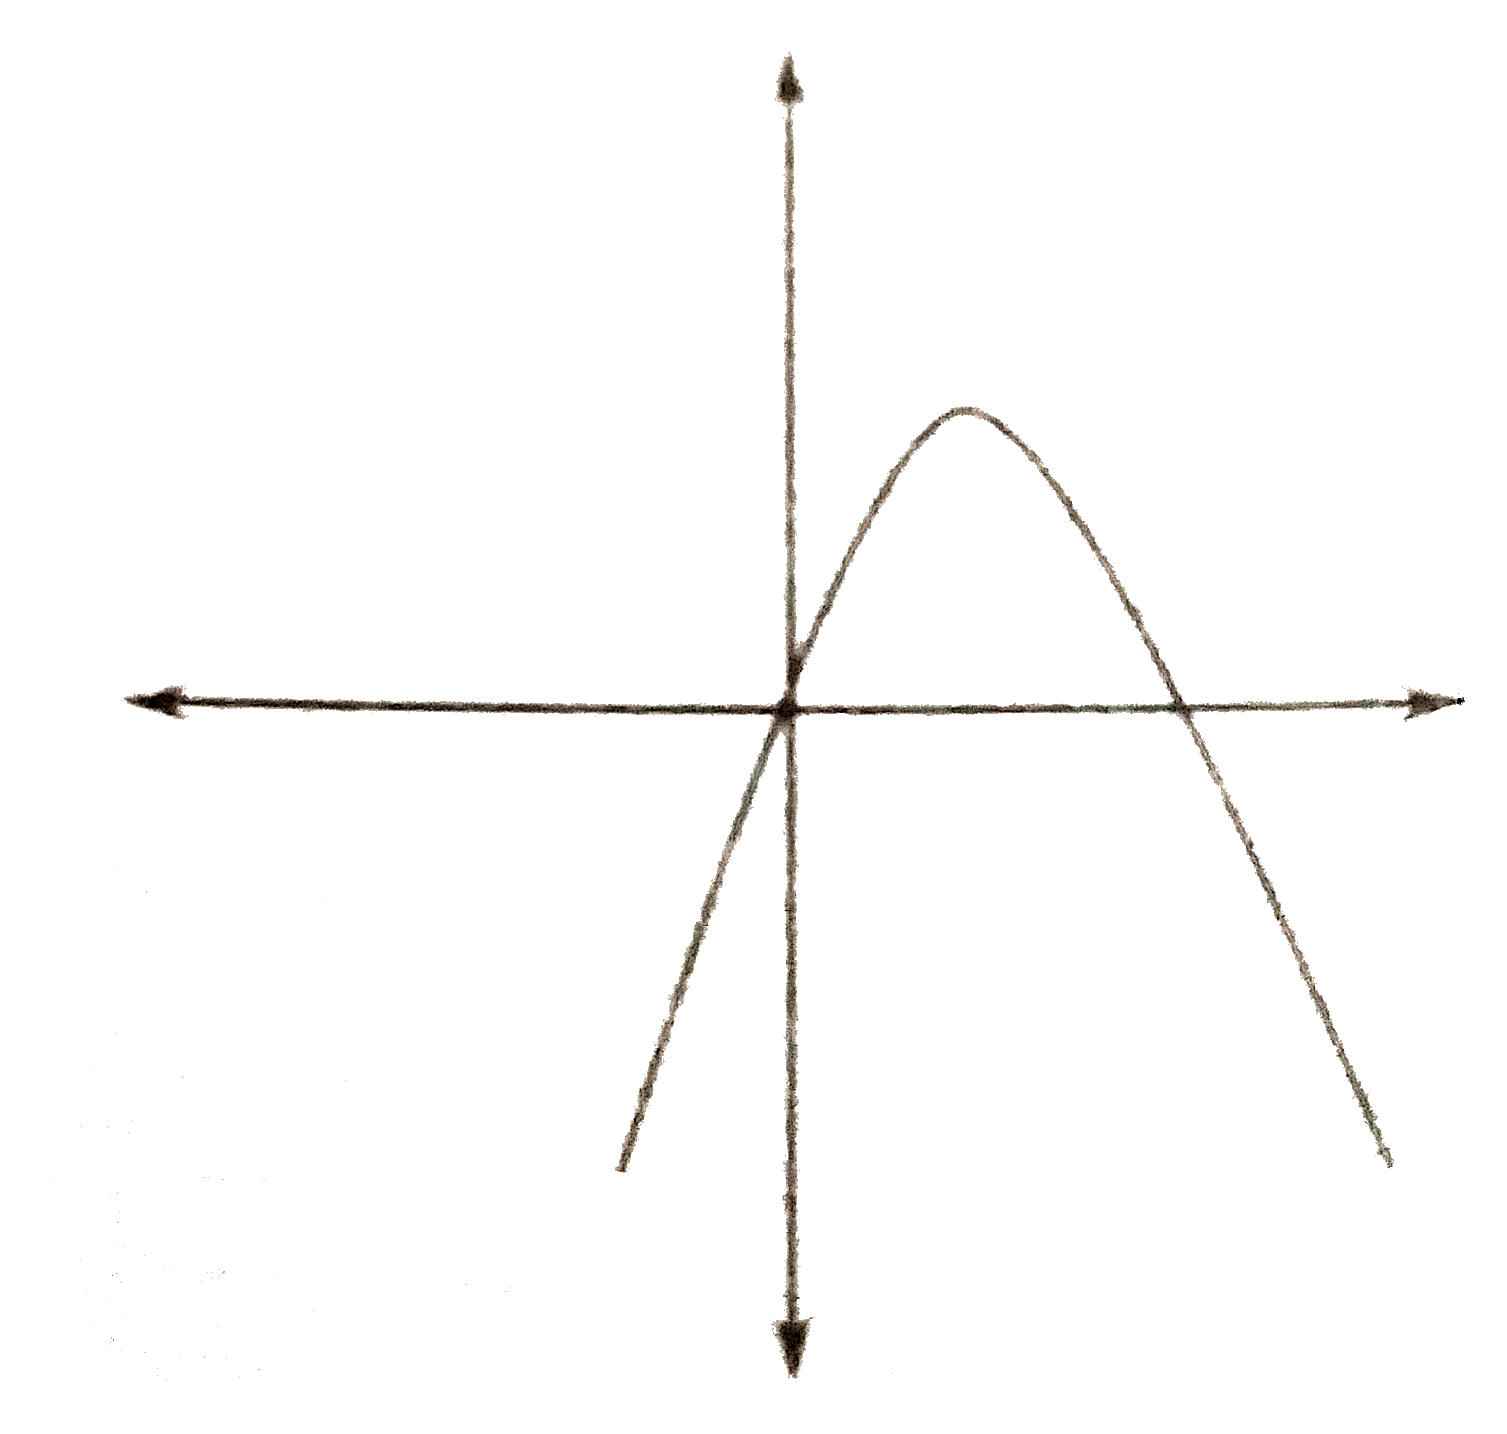 B
B C
C D
D
- Question 2 - Select One
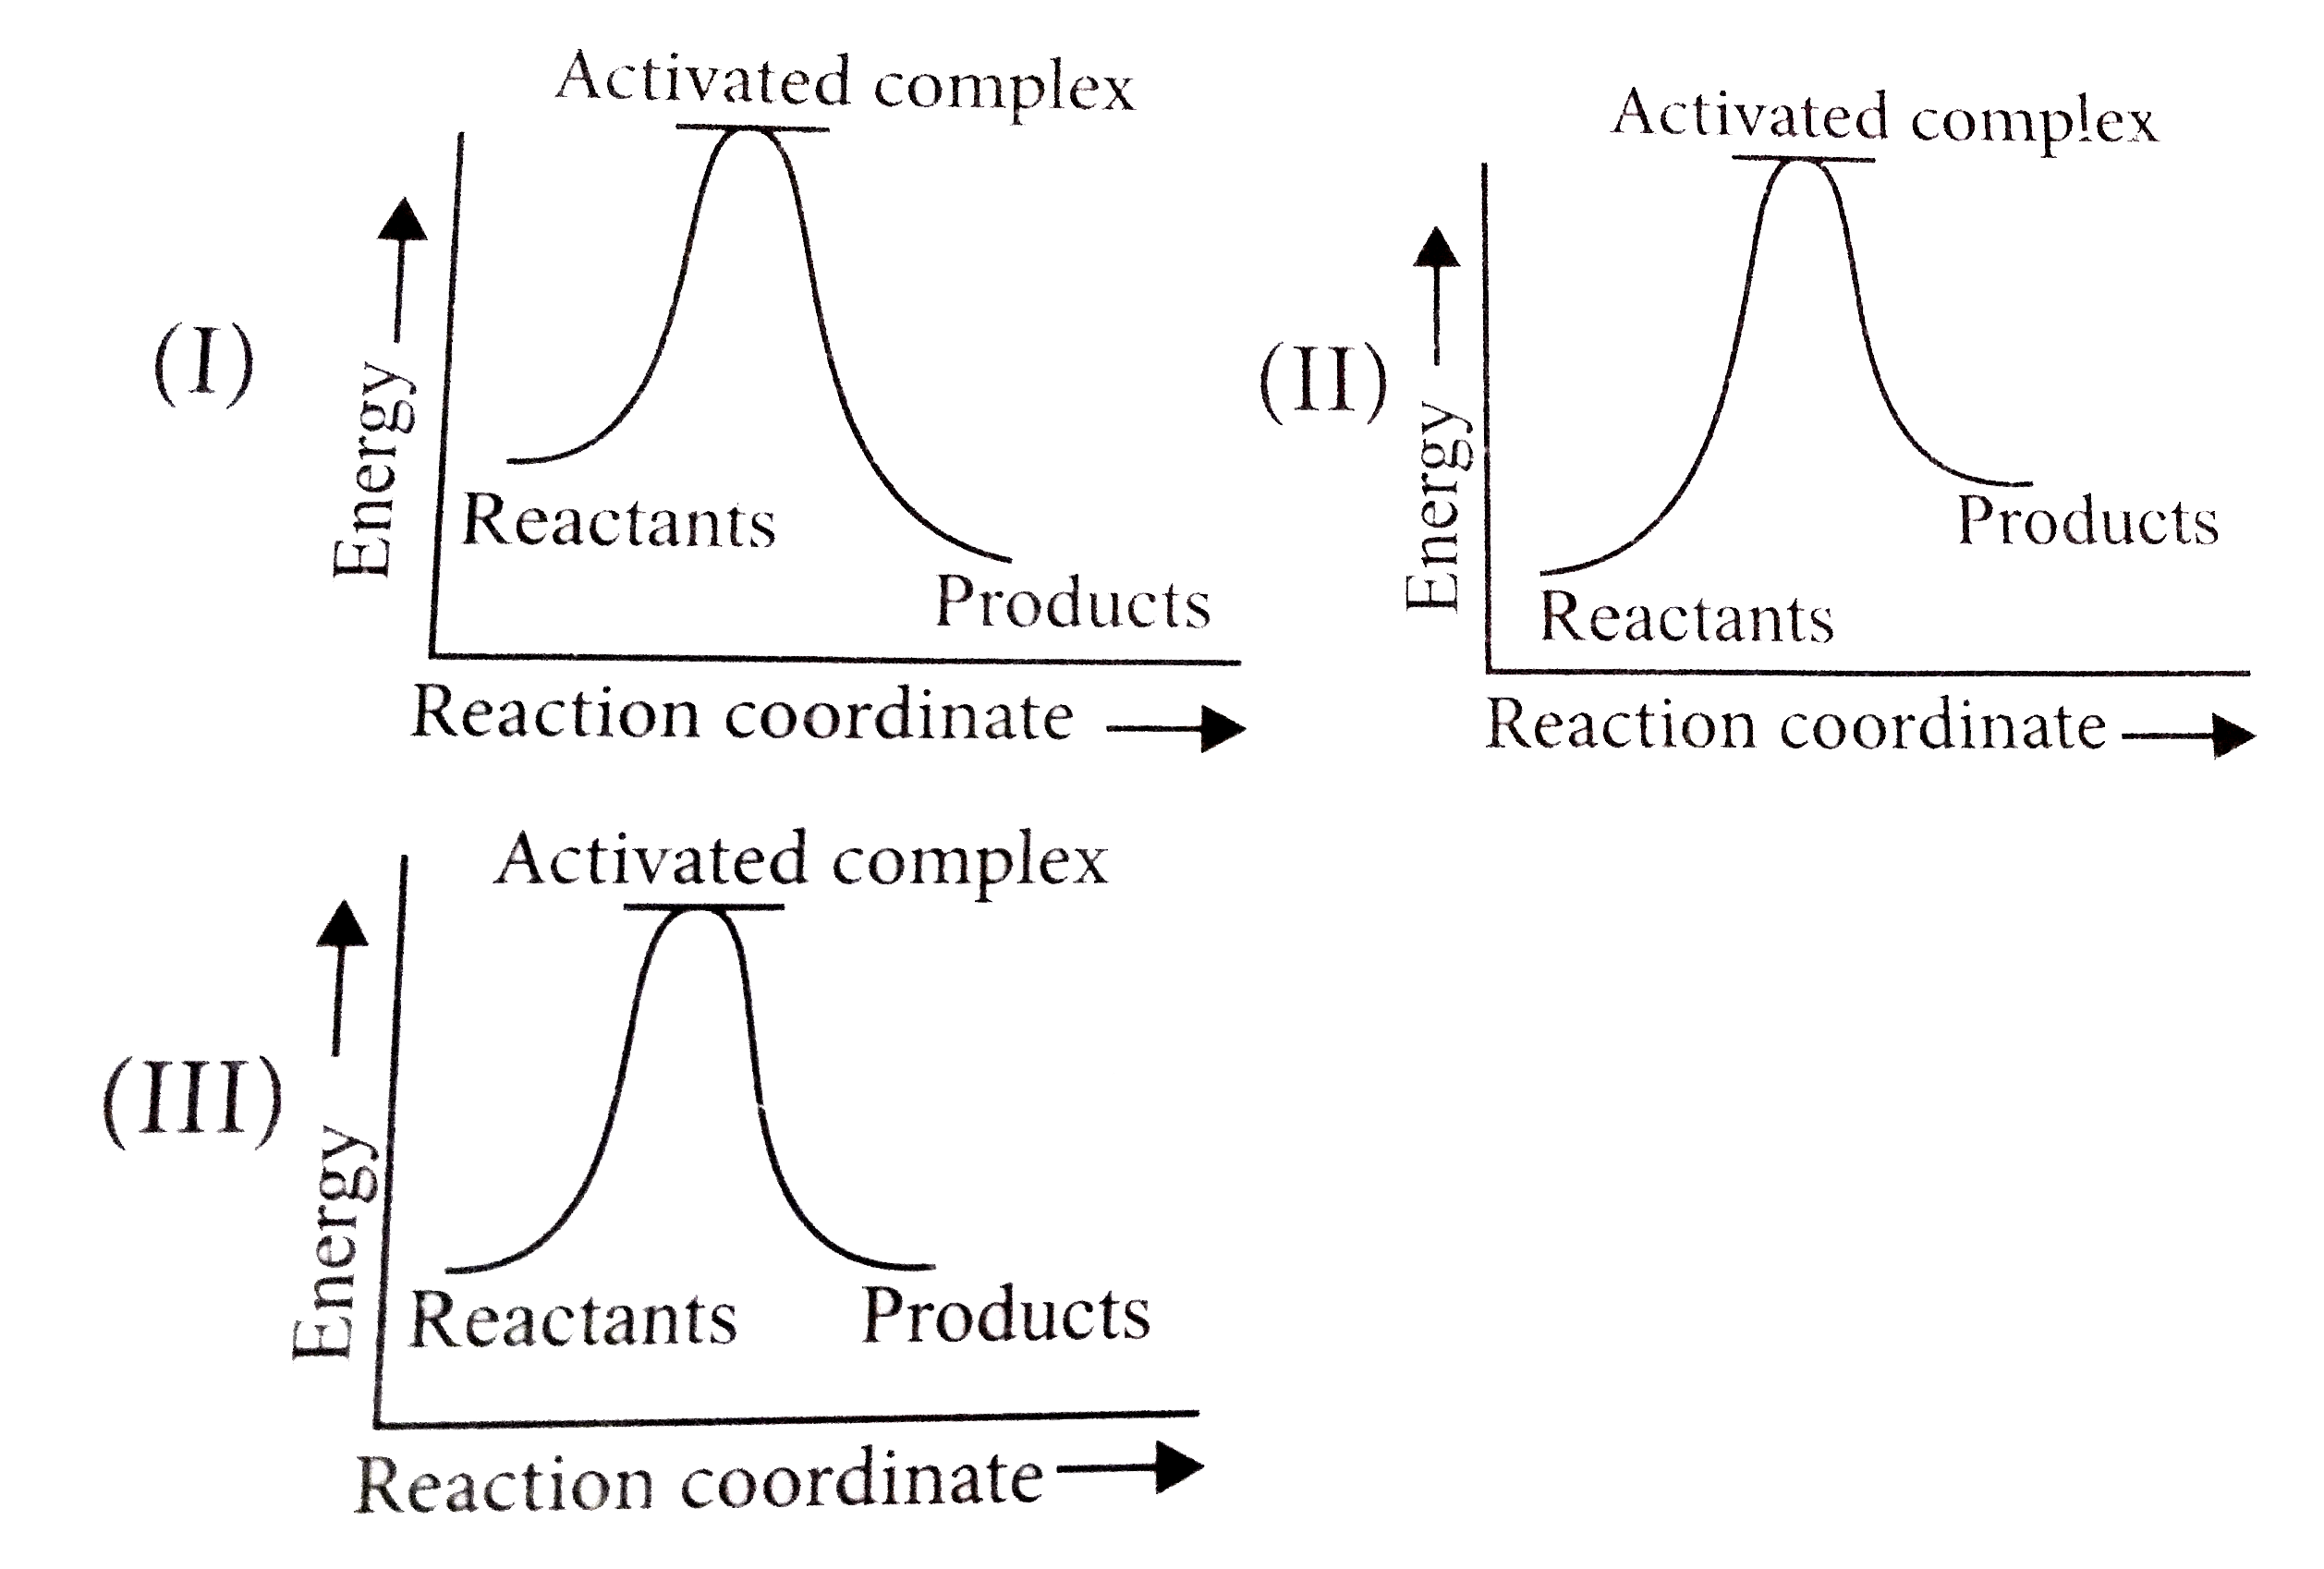
Which of the following graphs represents exothermic reaction ?
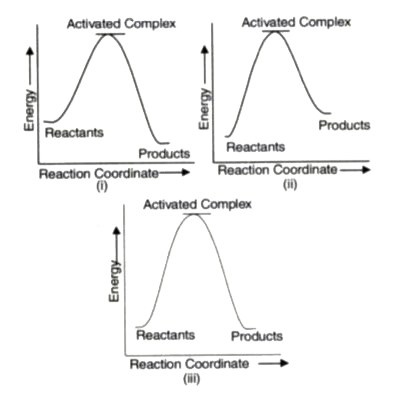 A(i) onlyB(ii) onlyC(iii) onlyD(i) and (ii)
Which of the following represents functional isomerism ?
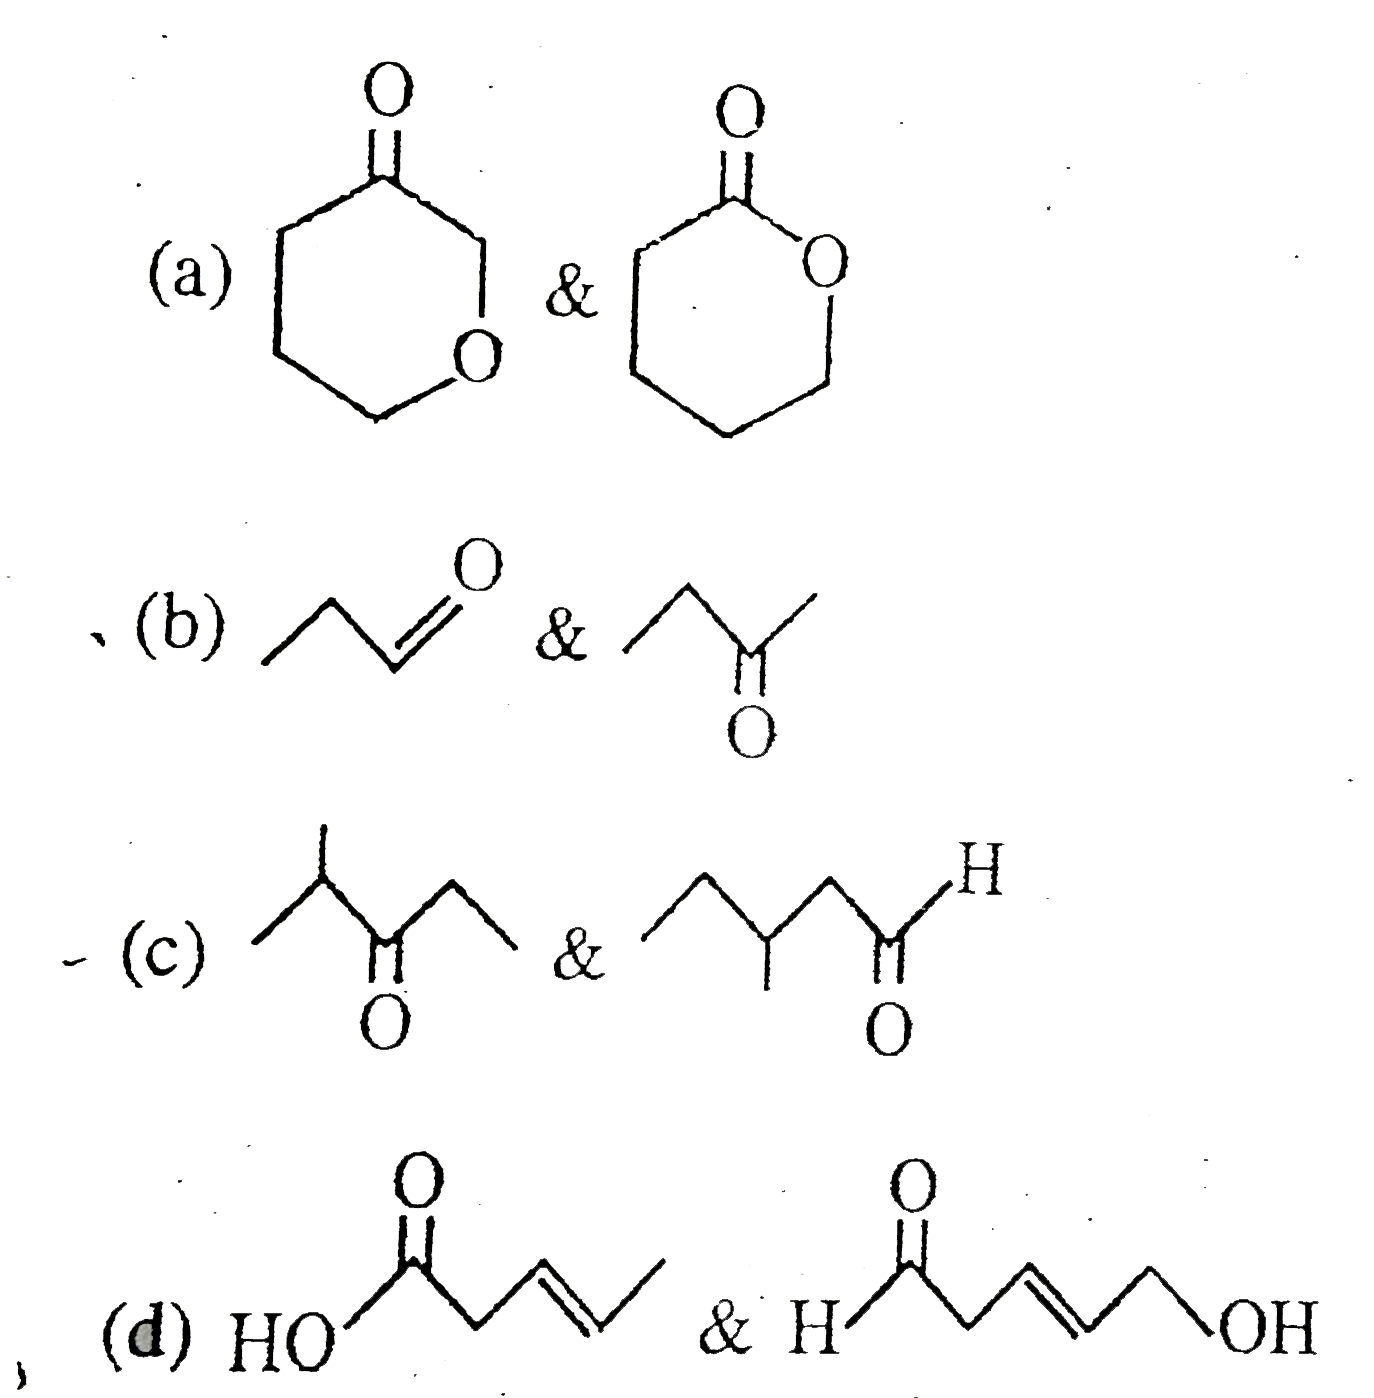 View Solution
Which of the following graph represents Boyle's law ?
View SolutionDoes the following graph represent a function or a relation?
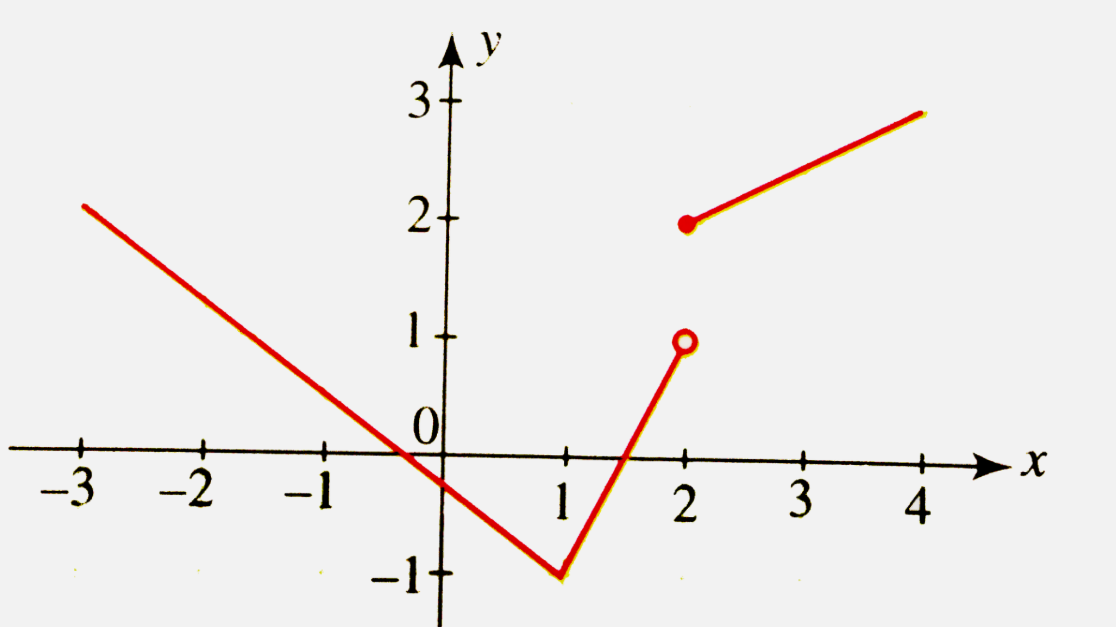 View Solution
Which of the following graphs are graphs of a function?
 View Solution
Which one of the following graphs represent a function? (FIGURE)
View SolutionWhich of the following graphs represents exothoermic reaction?
 View Solution

