Complete Solutions to EXERCISE 24 (B) of chapter MEASURES OF CENTRAL TENDENCY (MEAN, MEDIAN, QUARTILES AND MODE) of Class 10 book with complete answers and questions
| Class 10 | MATHS |
| Chapter | MEASURES OF CENTRAL TENDENCY (MEAN, MEDIAN, QUARTILES AND MODE) |
| SELINA PUBLICATION | EXERCISE 24 (B) |
| Number Of Questions | 10 |
| Academic Year | 2023-24 |
The following table gives the ages of 50 students of a class. Find the arithmetic mean of their ages.
View SolutionThe following table gives the weekly wages of workers in a factory. Weekly wages(Rs) 50-55 55-60 60-65 65-70 70-75 75-80 80-85 85-90 No. of workers 5 20 10 10 9 6 12 18 Calculate the mean, by using Short Cut Method.
View SolutionFind the mean of the following frequency distribution using step-deviation method. Class 0-10 10-20 20-30 30-40 40-50 Frequency 7 10 15 8 10
View SolutionFind the mean by step - deviation method:

View SolutionThe mean of the following frequency distribution is `21 1/7`. Find the value of f

View SolutionUsing step deviation method, calculate the mean marks of the following distribution.

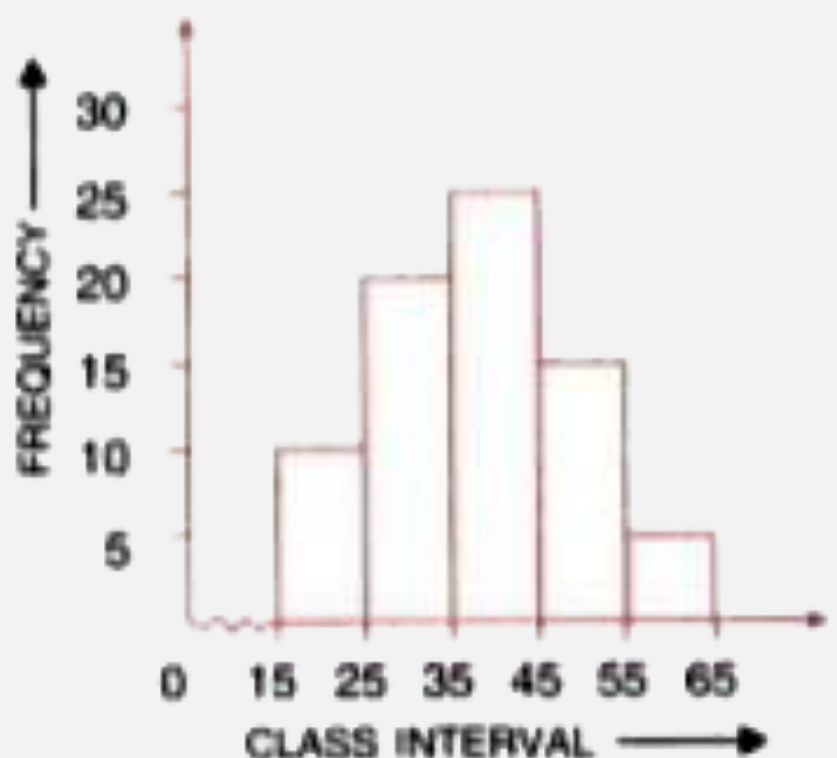
View SolutionUsing the information given in the adjoining histogram, calculate the mean.

View SolutionIf the mean of the following observation is 54, find the value of p.

View SolutionThe mean of the following distribution is 62.8 and the sum of all the frequencies is 50. Find the missing frequencies `f_(1)` and `f_(2)`

View SolutionCalculate the mean of the distribution, given below, using the short cut method:
View Solution
EXERCISE 24 (B) questions and complete solutions for chapter MEASURES OF CENTRAL TENDENCY (MEAN, MEDIAN, QUARTILES AND MODE) of SELINA MATHS (ENGLISH) of Class 10
