Complete Solutions to PRACTICE SET 6.5 of chapter STATISTICS of Class 10 book with complete answers and questions
| Class 10 | MATHS |
| Chapter | STATISTICS |
| UNIQUE PUBLICATION | PRACTICE SET 6.5 |
| Number Of Questions | 3 |
| Academic Year | 2023-24 |
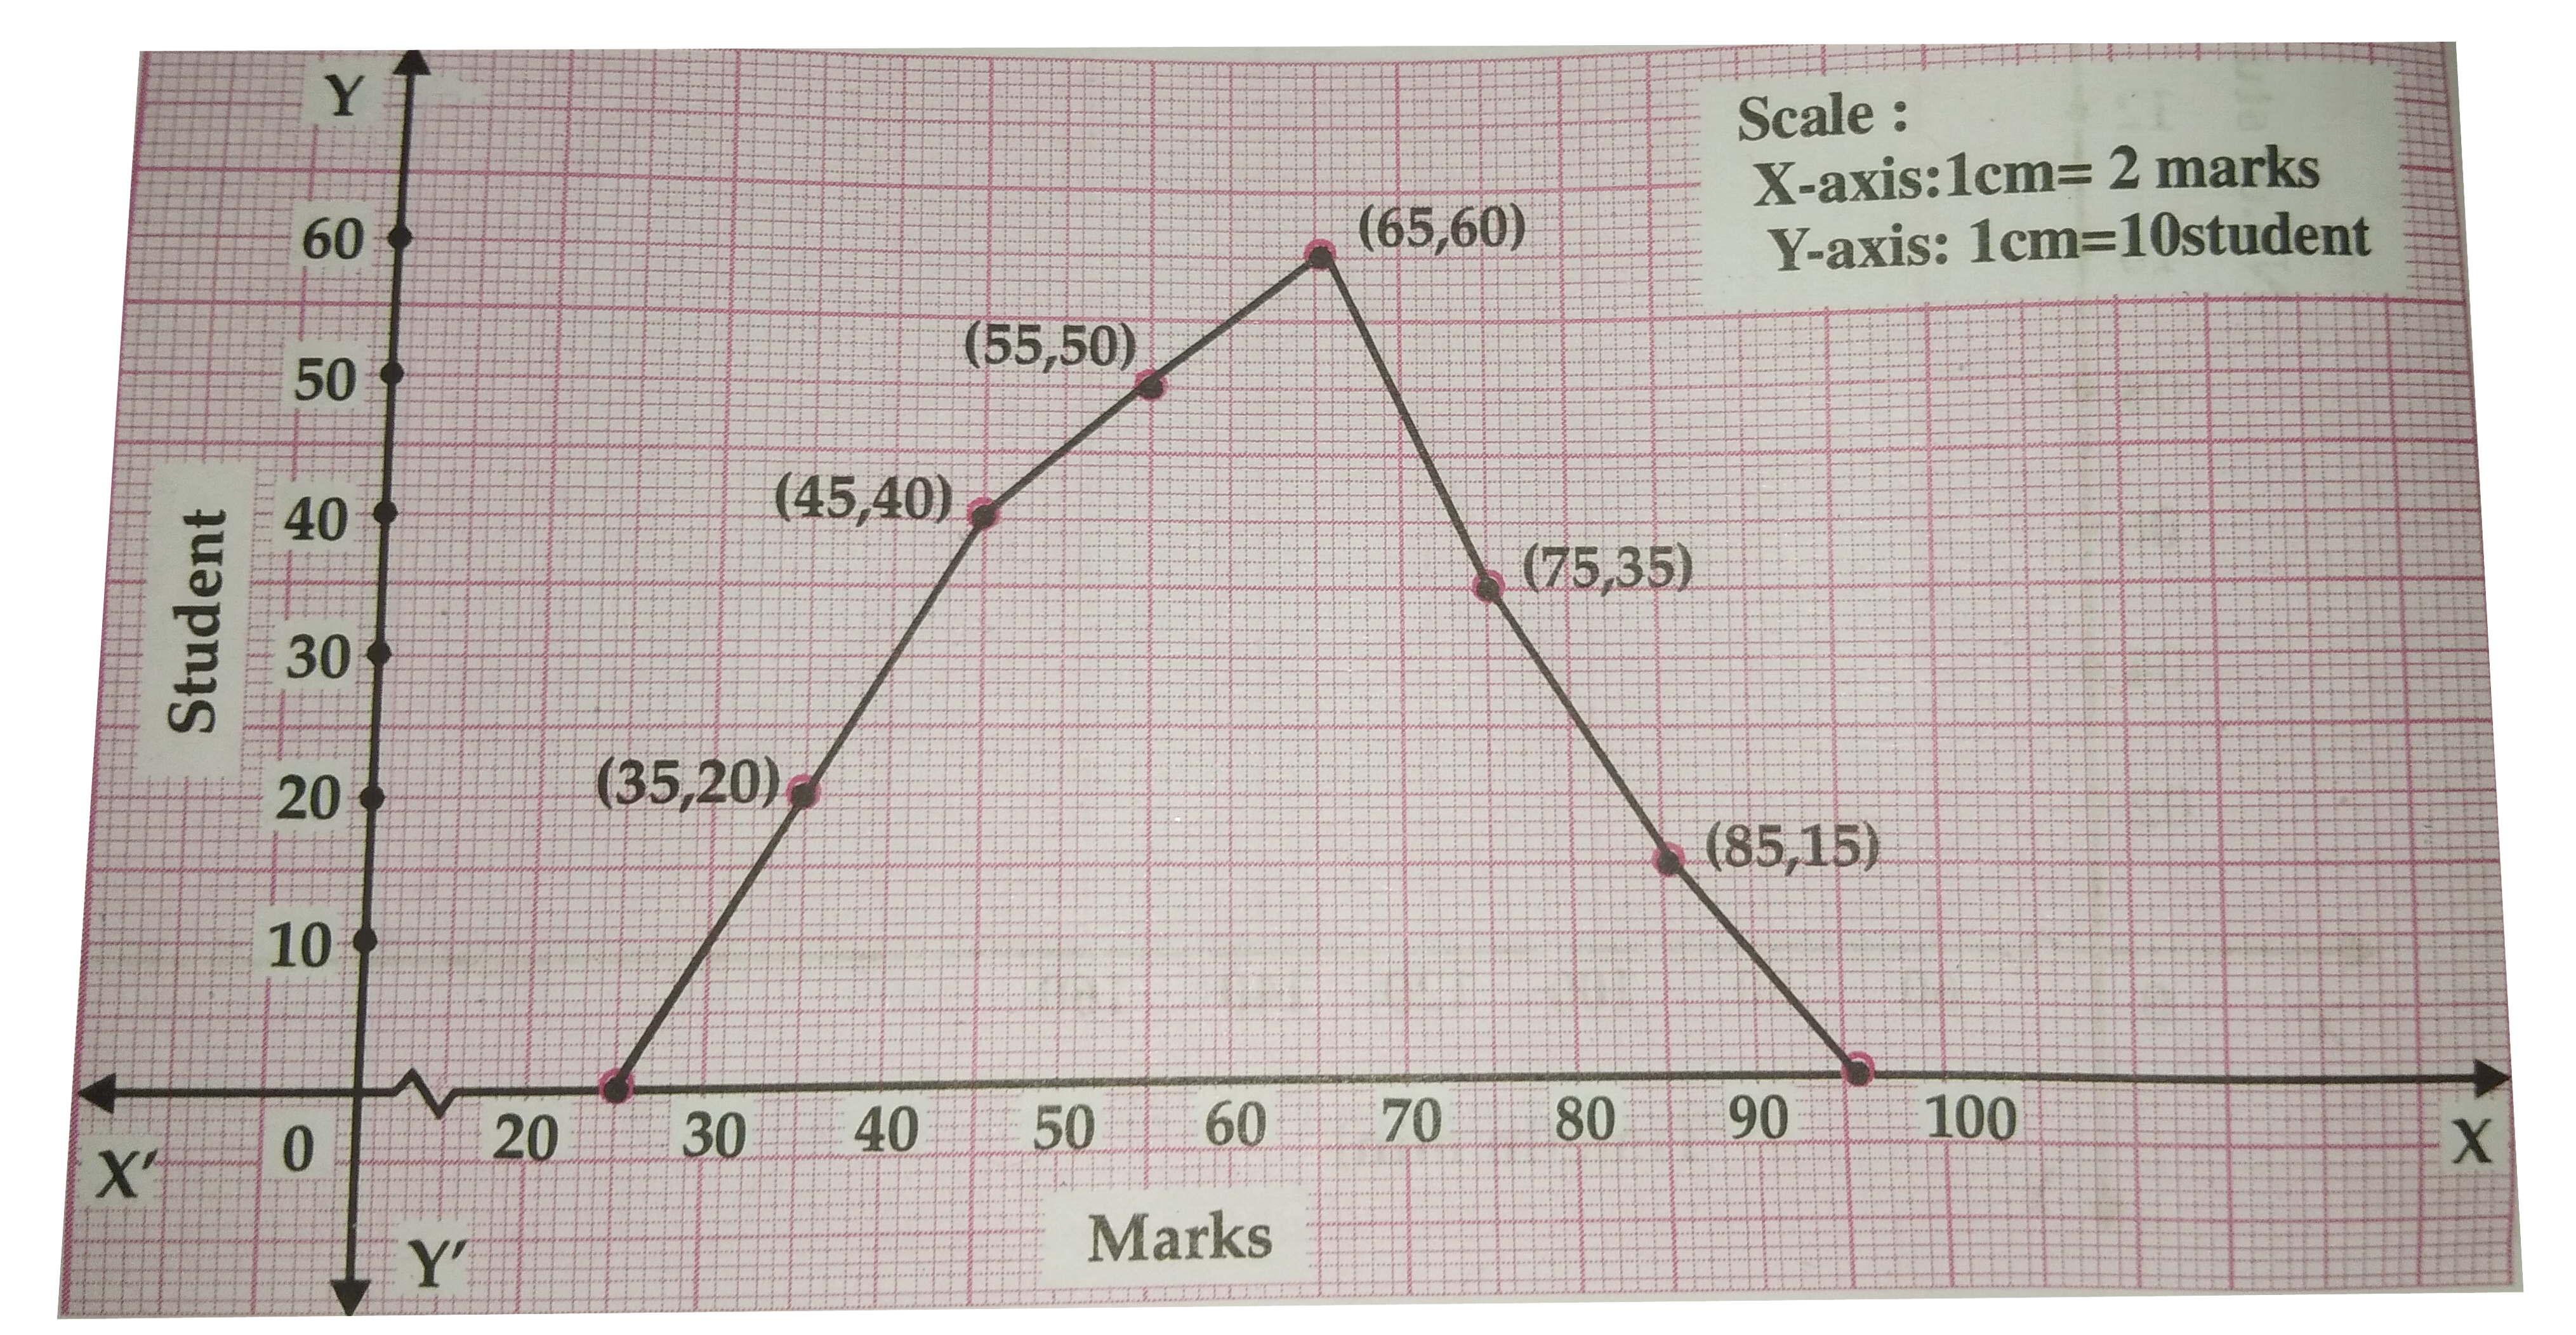
Observe the following frequency polygen and write the answers of the questions below it.
 View Solution
Show the following data by a frequency polygen.
 View Solution
The following table shows the classification of percentages of marks of students and the number of students.Draw a frequency polygen from the table.
 View Solution
PRACTICE SET 6.5 questions and complete solutions for chapter STATISTICS of UNIQUE MATHS (HINGLISH) of Class 10
