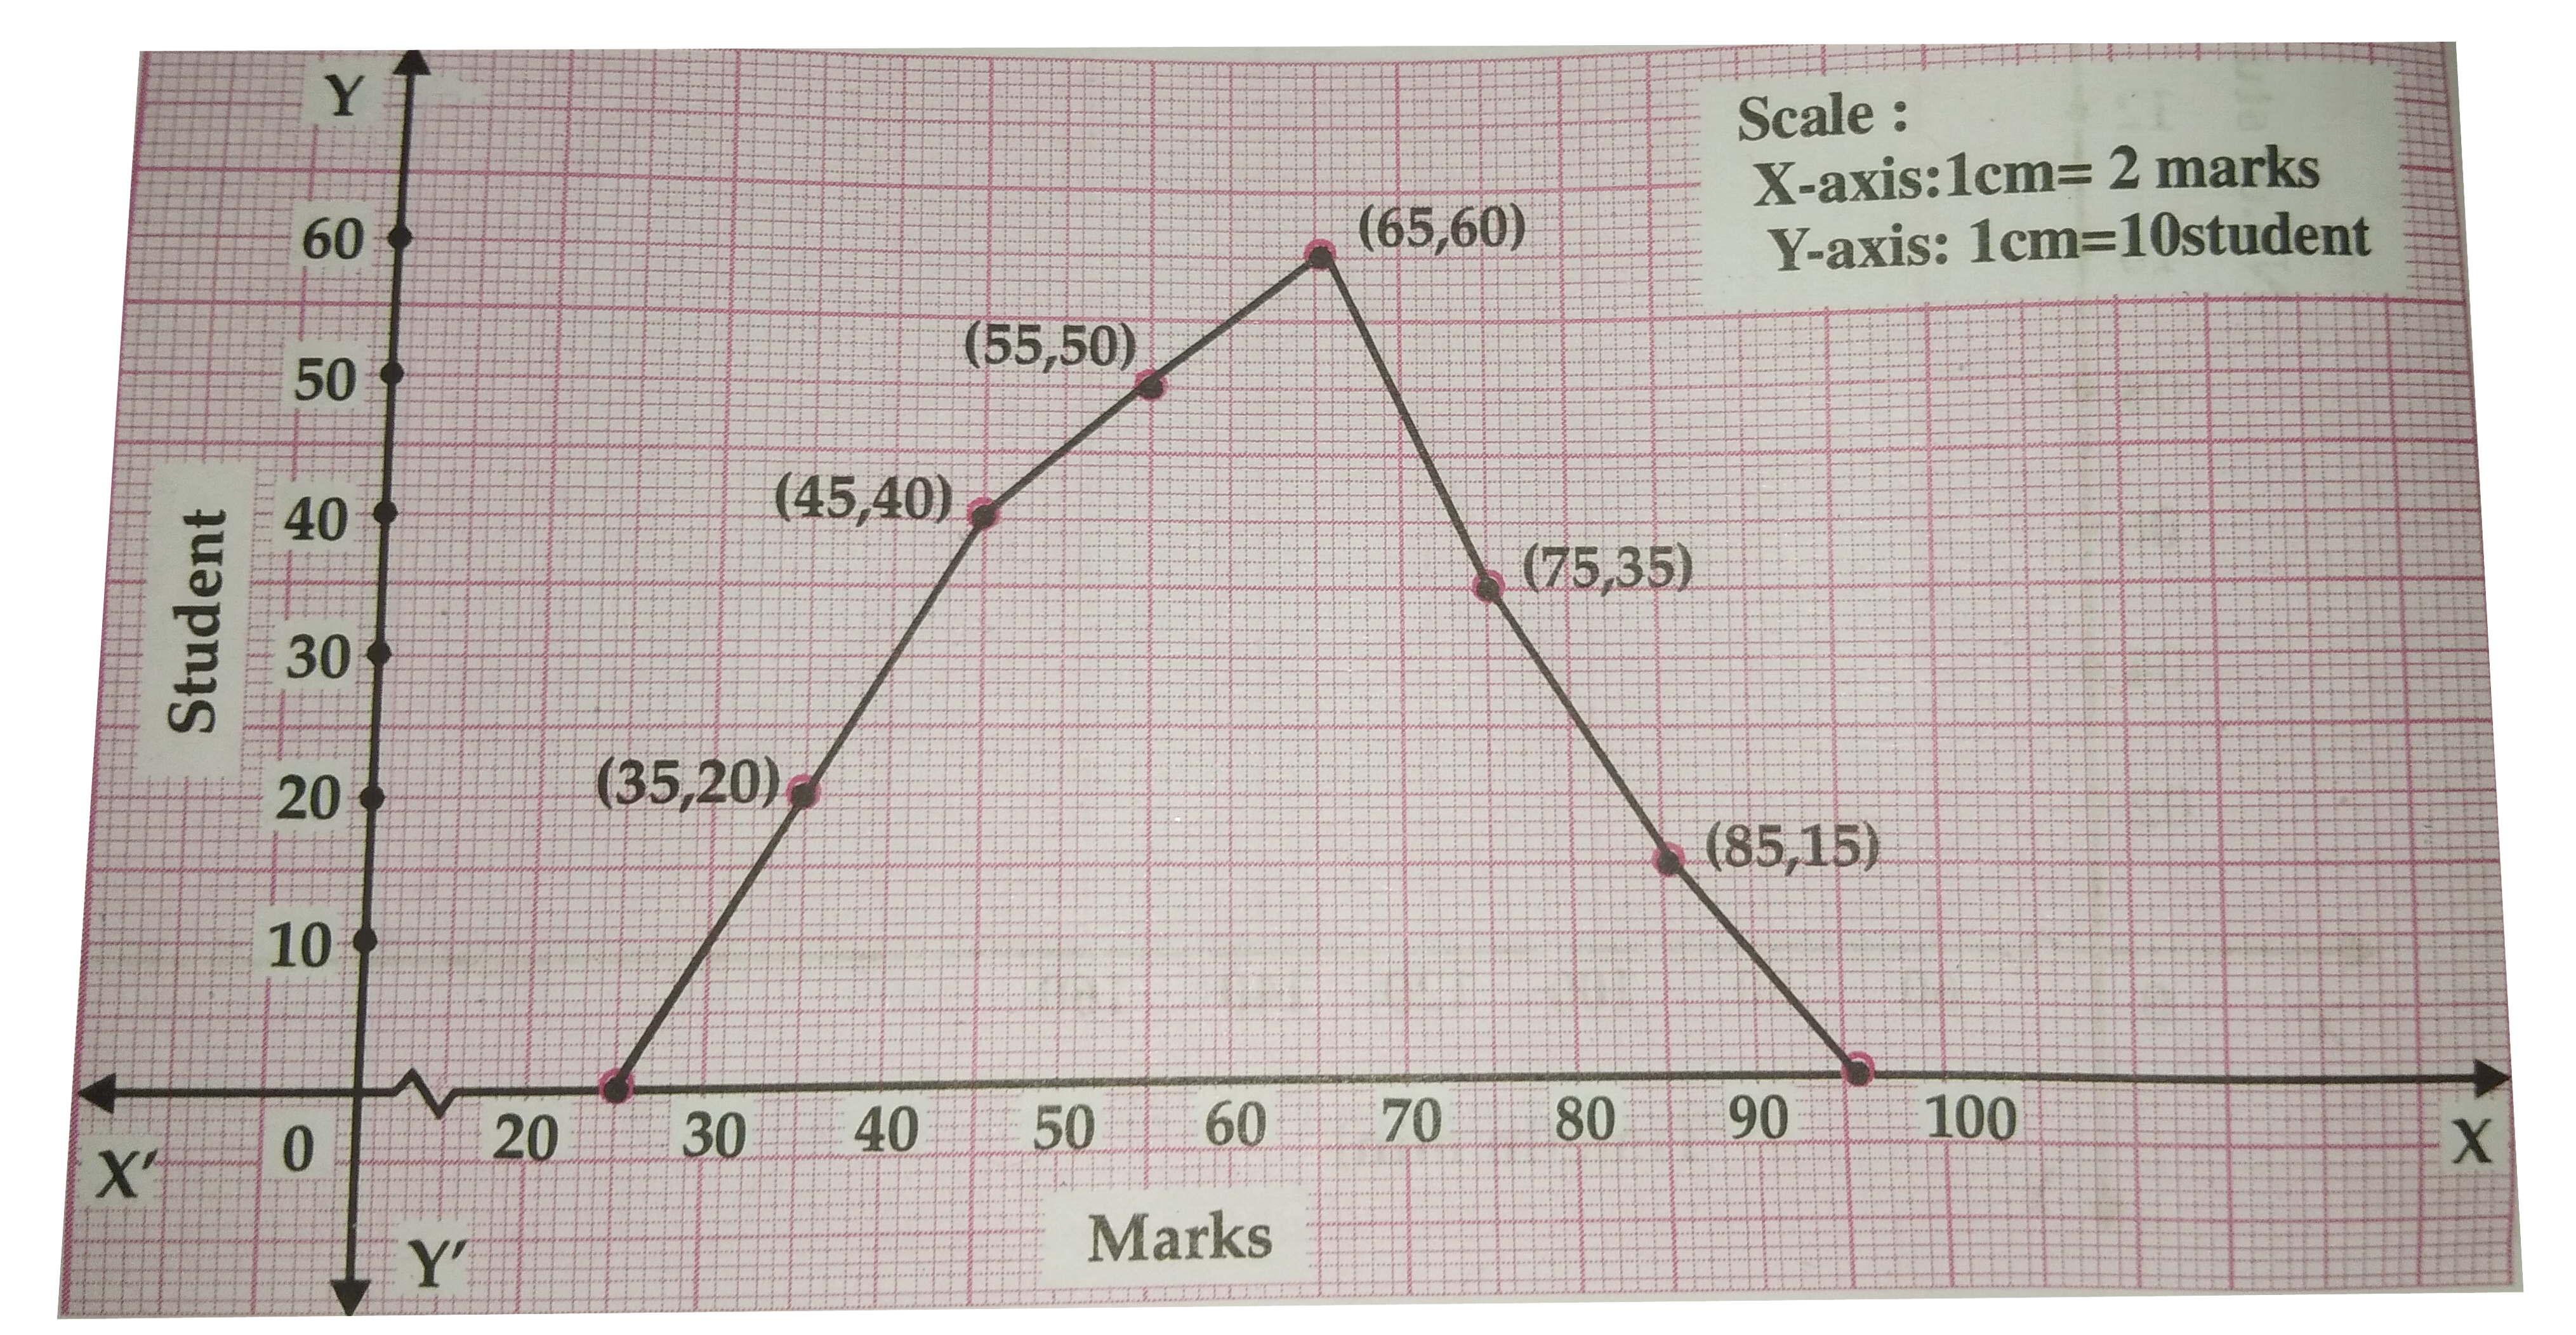
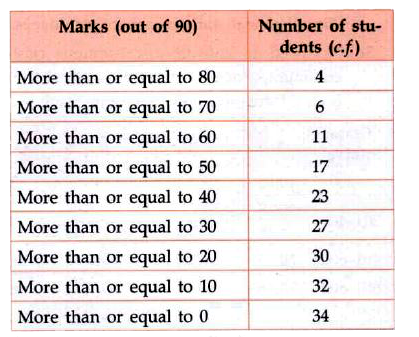
Show the following data by a frequency polygen.
Topper's Solved these Questions
- STATISTICS BOOK - UNIQUE PUBLICATIONCHAPTER - STATISTICS EXERCISE - PROBLEM SET
6 Videos
- STATISTICS BOOK - UNIQUE PUBLICATIONCHAPTER - STATISTICS EXERCISE - PRACTICE SET 6.4
4 Videos
- SIMILARITYBOOK - UNIQUE PUBLICATIONCHAPTER - SIMILARITYEXERCISE - Assignment-I
5 Videos
- TRIGONOMETRYBOOK - UNIQUE PUBLICATIONCHAPTER - TRIGONOMETRYEXERCISE - ASSIGNMENT
12 Videos
Similar Questions
Knowledge Check
Which one of the following is an example of polygenic inheritance ?
AFlower colour in Mirabilis jalapaBProduction of male honey beeCPod shape in garden peaDSkin colour in humans
Represent the following data by frequency curve :

View SolutionObserve the following frequency polygen and write the answers of the questions below it.

View SolutionFrom the following data, construct frequency histogram, frequency polygon and frequency curve.

View SolutionForm the frequency distribution table from the following data:
Construct the frequency distribution table for the above data.

View SolutionPresent the following data in the form of a frequency polygon :

View Solution
The above data is to be shown by a frequency polygon. The coordinates of the points to show number of students in the class 4−6 are _______ .
View SolutionThe following table shows the classification of percentages of marks of students and the number of students.Draw a frequency polygen from the table.

View Solution


