Complete Solutions to Section C of chapter MODEL TEST PAPER -2 of Class 11 book with complete answers and questions
| Class 11 | MATHS |
| Chapter | MODEL TEST PAPER -2 |
| S CHAND | Section C |
| Number Of Questions | 8 |
| Academic Year | 2023-24 |
Calculate standard deviation of the number 11, 12, 13, . . . 20
View SolutionFind the Cov (X, Y) of the data given below :
(1,5), (2,7), (3,9), (4,11), (5,10), (6,9), (7,8), (8,7), (9,6), (10,5)
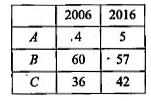
View SolutionA small industrial concern used raw material A, B and C in its manufacturing process . The prices of the materials are as shown below :

Using 2006 as the base year, calculate for 2016 a simple aggregate price index
View SolutionCalculate Spearman's coefficent of rank correlation from the following data and interpret the result.
`{:(X, 16, 19, 22, 28, 25, 31, 37, 40, 43, 49),(Y, 25, 25, 27, 31, 27, 33, 35, 41, 45, 41):}`
View SolutionThe mathematical aptitude score of 10 computer programmers with their job performance is given below :
`{:("Mathematics score ", 7, 5, 1, 4, 3, 0, 2, 6, 8, 9),("Job performance rating ",8, 16, 8, 9, 5, 4, 3, 8, 17, 12):}`
Calculate the Karl Pearson's correlation coefficient and interpret the result.
View SolutionFrom a frequency distribution consisting of 18 observations, the mean and standard deviation were found to be 7 and 4 respectively . But on comparison with original data, it was found that a figure 12 was miscopied as 21 in calculations. Calculate the correct mean and standard deviation.
View SolutionFind the inter-quartile range, semi inter-quartile range and coefficient of quartile deviation from the following frequency distribution
`{:("Marks ", 10-20, 20-30, 30-40, 40-50, 50-60, 60-70, 70-80, 80-90),("No. of students ", " "60, " " 45, " " 120, " " 25, " " 90, " " 80, " " 120, " " 60):}`
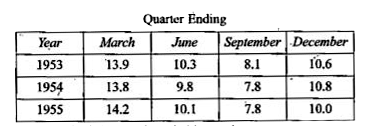
View SolutionThe following table gives the quarterly death rate per thousand of a city for the years 1953 to 1955

Plot these figures on a graph. Calculate the suitable moving averages and plot them on the same graph
View Solution
Section C questions and complete solutions for chapter MODEL TEST PAPER -2 of S CHAND MATHS (ENGLISH) of Class 11