Complete Solutions to EXERCISE 1 (d) of chapter SETS of Class 11 book with complete answers and questions
| Class 11 | MATHS |
| Chapter | SETS |
| S CHAND | EXERCISE 1 (d) |
| Number Of Questions | 34 |
| Academic Year | 2023-24 |
If `n(xi)=80,n(A)=48,n(B)=40 and n(AcapB)=25`, draw a Venn diagram to find: `n(AcupB)`
View SolutionIf `n(xi)=80,n(A)=48,n(B)=40 and n(AcapB)=25`, draw a Venn diagram to find: `n(AcupB)'`
View SolutionIf `n(xi)=80,n(A)=48,n(B)=40 and n(AcapB)=25`, draw a Venn diagram to find: `n(A-B`
View SolutionIf `n(xi)=80,n(A)=48,n(B)=40 and n(AcapB)=25`, draw a Venn diagram to find: `n(B-A)`
View SolutionIf `n(xi)=80,n(A)=48,n(B)=40 and n(AcapB)=25`, draw a Venn diagram to find: `n(AcapB')`
View SolutionIf `n(xi)=80,n(A)=48,n(B)=40 and n(AcapB)=25`, draw a Venn diagram to find: `n(A'capB)`
View SolutionIf `xi={x|x inN,xlt10}`,
`A={x|x" is a prime number",xlt10},B={x|x" is an even number",xlt10}` draw a Venn diagram to find: `n(AcupB)`
View SolutionIf `xi={x|x inN,xlt10}`,
`A={x|x" is a prime number",xlt10},B={x|x" is an even number",xlt10}` draw a Venn diagram to find: `n(AcapB)`
View SolutionIf `xi={x|x inN,xlt10}`,
`A={x|x" is a prime number",xlt10},B={x|x" is an even number",xlt10}` draw a Venn diagram to find: `n(AcupB)'`
View SolutionIf `xi={x|x inN,xlt10}`,
`A={x|x" is a prime number",xlt10},B={x|x" is an even number",xlt10}` draw a Venn diagram to find: `n(AcapB')`
View SolutionIf `xi={x|x inN,xlt10}`,
`A={x|x" is a prime number",xlt10},B={x|x" is an even number",xlt10}` draw a Venn diagram to find: `n(A'capB)`
View SolutionGiven `n(xi)=40,n(A')=12,n(B)=15 and BsubA`. Draw a Venn diagram to illustrate this information. Hence find n(A-B).
View SolutionThe Venn diagram shows:
`xi={"pupils in class 8"}`
`A={"pupils who play cricket"}`
`B={"pupils who play basketball"}`
How many papils: are in class 8?
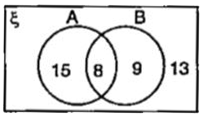
View SolutionThe Venn diagram shows:
`xi={"pupils in class 8"}`
`A={"pupils who play cricket"}`
`B={"pupils who play basketball"}`
How many papils: play cricket
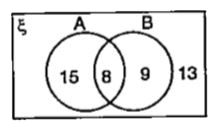
View SolutionThe Venn diagram shows:
`xi={"pupils in class 8"}`
`A={"pupils who play cricket"}`
`B={"pupils who play basketball"}`
How many papils:
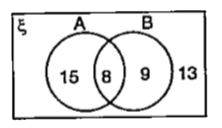
View SolutionThe Venn diagram shows:
`xi={"pupils in class 8"}`
`A={"pupils who play cricket"}`
`B={"pupils who play basketball"}`
How many papils: play both cricket and basketball
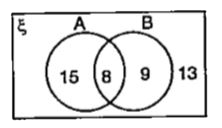
View SolutionThe Venn diagram shows:
`xi={"pupils in class 8"}`
`A={"pupils who play cricket"}`
`B={"pupils who play basketball"}`
How many papils: play neither cricket nor basketball?
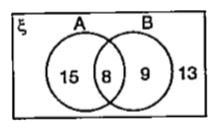
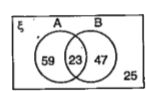
View SolutionIn the Venn diagram
`xi={"people at a function"}`
`A={"those who asked for tea"}`
`B={"those who watched the ballet"}`
Write down the number who: aksed for tea
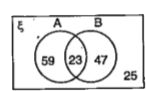
View SolutionIn the Venn diagram
`xi={"people at a function"}`
`A={"those who asked for tea"}`
`B={"those who watched the ballet"}`
Write down the number who: asked for tea and watched the ballet
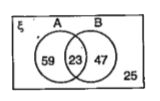
View SolutionIn the Venn diagram
`xi={"people at a function"}`
`A={"those who asked for tea"}`
`B={"those who watched the ballet"}`
Write down the number who: neither asked for tea nor watched the ballet
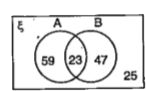
View SolutionIn the Venn diagram
`xi={"people at a function"}`
`A={"those who asked for tea"}`
`B={"those who watched the ballet"}`
Write down the number who: attended the function
View SolutionIn a group of 30 people, 18 play squash and 19 play tennis. How many play both games, provided everyone plays at least one game?
View SolutionIn a class of 50 students, 22 like History,25 like Geography and 10 like both subjects. Draw a Venn diagram and find the number of of students who do not like History
View SolutionIn a class of 50 students, 22 like History,25 like Geography and 10 like both subjects. Draw a Venn diagram and find the number of of students who do not like Geography
View SolutionIn a class of 50 students, 22 like History,25 like Geography and 10 like both subjects. Draw a Venn diagram and find the number of of students who like neither History no Geography
View Solution2000 candidates appear in a written test in Mathematics and Gerneral Awareness for a Government job. 1800 passed in at least one subject. If 1200 passed in Mathematice and 1500 in General Awareness find: how many passed in both the subjects?
View Solution2000 candidates appear in a written test in Mathematics and Gerneral Awareness for a Government job. 1800 passed in at least one subject. If 1200 passed in Mathematice and 1500 in General Awareness find: how many passed in Mathematics only?
View Solution2000 candidates appear in a written test in Mathematics and Gerneral Awareness for a Government job. 1800 passed in at least one subject. If 1200 passed in Mathematice and 1500 in General Awareness find: how many failed in General Awareness?
View SolutionIn a group of 80 people, 40 like Indian food, 36 like Chinese food and 27 do not like any kind of these foods. Draw Venn diagram to find: how many like both kind of food?
View SolutionIn a group of 80 people, 40 like Indian food, 36 like Chinese food and 27 do not like any kind of these foods. Draw Venn diagram to find: how many like only the Indian food?
View SolutionIn a group of 80 people, 40 like Indian food, 36 like Chinese food and 27 do not like any kind of these foods. Draw Venn diagram to find: how many like only the Chinese food?
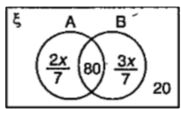
View SolutionIn a group of people, two-seventh speak Bengali only and three-seventh speak Hindi only. If 20 people speak none of these languages and 80 speak both, find using Venn diagram the total number of people in the group.
View SolutionIn a class of 150 students, the following results were obtained in a certain examination, 45 students failed in Maths, 50 students failed in Physics, 48 students failed in Chemistry, 30 students failed in both Maths and Physics, 32 failed in all the three subjects. Draw a Venn diagram corresponding to this data. and find the number or students who have failed in at least one subject.
View SolutionA firm has 40 workers working in the factory premises, 30 working in its office and 20 working in both the places. How many workers are there in the firm? How many are working in the (i) factory (ii) office alone?
View Solution
EXERCISE 1 (d) questions and complete solutions for chapter SETS of S CHAND MATHS (ENGLISH) of Class 11