Complete Solutions to EXERCISE of chapter STATISTICS of Class 11 book with complete answers and questions
| Class 11 | MATHS |
| Chapter | STATISTICS |
| MODERN PUBLICATION | EXERCISE |
| Number Of Questions | 98 |
| Academic Year | 2023-24 |
Find the mean deviation from the mean for the following data : 6,7,10,12,13,4,8,12.
View SolutionFind the mean deviation from the mean for the following data : 6.5,5, 5.25, 5.5,4.75,4.5,6.25,7.75,8.5.
View SolutionFind the mean deviation from the mean for the following data : 13, 15, 16, 15, 18, 15, 14, 18, 17, 10 .
View SolutionFind the mean deviation from the mean for the following data. 38, 70, 48, 40, 42, 55, 63, 46, 54, 44.
View SolutionFind the mean deviation from the mean for the following data : 36, 72, 46, 42, 60, 45, 53, 46, 51, 49.
View SolutionFind the mean deviation from the mean for the following data : 37, 48, 50, 23, 47, 58, 29, 27, 31, 40.
View SolutionFind the mean deviation from the mean for the following data : 13, 15, 16, 15, 18, 15, 14, 18, 17, 10 .
View SolutionFind the mean deviation from the mean for the following data :

View SolutionFind the mean deviation from the mean for the following data :

View SolutionFind the mean deviation from the mean for the following data :

View SolutionFind the mean deviation from the mean for the following data :

View SolutionFind the mean deviation from the mean for the following data :

View SolutionFind the mean deviation from the mean for the following data :

View SolutionFind the mean deviation from the mean for the following data :

View SolutionFind the mean deviation from the mean for the following data :

View SolutionIf `bar x` is the mean and Mean Deviation from mean is `MD (bar x)`, then find the number of observations lying between `bar x- MD (bar x)` and `bar x+ MD (bar x)` from the following data : 22, 24, 30, 27, 29, 31, 25, 28, 41, 42.
View SolutionIf `bar x` is the mean and Mean Deviation from mean is `MD (bar x)`, then find the number of observations lying between `bar x- MD (bar x)` and `bar x+ MD (bar x)` from the following data : 22, 24, 30, 27, 29, 31, 25, 28, 41, 42.
View SolutionFind the mean deviation from the median for the following data : 9, 12, 18, 3, 5, 3, 10, 12, 21, 12, 21.
View SolutionFind the mean deviation from the median for the following data : 10, 3, 12, 5, 9, 3, 18, 21, 21, 8, 12, 12.
View SolutionFind the mean deviation from the median for the following data : 13,17, 16, 14, 11, 13, 10, 16, 11, 18, 12, 17.
View SolutionFind the mean deviation from the mean for the following data : 36, 72, 46, 42, 60, 45, 53, 46, 51, 49.
View SolutionFind the mean deviation from the median for the following data : 38,70,48,34, 65, 42, 55, 44, 53, 47.
View SolutionFind the mean deviation from the median for the following data :

View SolutionFind the mean deviation from the median for the following data :

View SolutionFind the mean deviation from the median for the following data :

View SolutionThe lengths (in cm.) of 10 rods in a shop are as below : 42.0,52.3,55.2,72.9,52.8,79.0,32.5,15.2,27.9,30.2 . Find M.D. (Med.).
View SolutionThe lengths (in cm.) of 10 rods in a shop are as below : 42.0,52.3,55.2,72.9,52.8,79.0,32.5,15.2,27.9,30.2 . Find M.D. (Med.).
View SolutionCalculate the mean deviation about median age for the age distribution of 100 persons given below :

View SolutionFind the mean deviation about the median for the following data :

View SolutionFind the mean deviation about the median for the following data :

View SolutionFind the mean deviation about the median for the following data :

View SolutionGiven that `bar x` is the mean and `sigma^2` is the variance of n observations `x_1, x_2, ... x_n`. Prove that the mean and variance of the observations `ax_1, ax_2, ... ,ax_n`, are ` a bar x` and `a^2 sigma^2` respectively `(a ne 0)`.
View SolutionProve that identity : `sum_(i=1)^(n) (x_i-bar x)^2 = sum_(i=1)^(n) x_i^2-n bar x^2= sum_(i=1)^(n) x_i^2 -(sum_(i=1)^(n) x_i)^2/n` .
View SolutionFind the mean and variance for the following data :
2, 4,5, 6, 8, 17.
View SolutionFind the mean and variance for the following data: 6, 7, 10, 12, 13, 4, 8, 12.
View SolutionFind the mean and variance for the following data: first n natural numbers.
View SolutionFind the mean and variance for the following data :
First 10 multiples of 3.
View SolutionFind the variance and standard deviation for the following data :
65, 58, 68, 44, 48, 45, 60, 62, 60, 50.
View SolutionThe scores of batsman A were : 48, 80, 58, 44, 52, 65, 73, 56, 64, 54. Find the variance.
View SolutionThe scores of batsman A were : 28, 60, 38, 24, 32, 45, 53, 36, 44, 34. Find the variance.
View SolutionFind the Standard Deviation of the following data :

View SolutionFind the mean and standard deviation for the following data :

View SolutionFind the mean and standard deviation for the following data :

View SolutionFind the mean and standard deviation for the following data :

View SolutionThe scores of 10 students in a test, in which the maximum marks Were 50 as follows : 28, 36, 34, 28, 48, 22, 35, 27, 19, 41. Find the Variance.
View SolutionLater on the maximum marks were increased to 100, and accordingly each Student's score was doubled. Find the variance of the new scores .
View SolutionThe scores of 48 children in an intelligence test are shown in the following :
 Calculate the variance `sigma^2` and find out the percentage of children whose scores lie between `bar x- sigma` and `bar x+sigma` .
View SolutionA sample of 25 variates has mean 40 and standand deviation 5 and a second sample of 35 variates has mean 45 and the standard deviation 2. Find the mean and standard deviation of the two samples of variates, taken together.
View SolutionThe mean of 5 observation is `4.4` and their variance is `8.24`. If three of the observations are 1,2 and 6, find the other two observations
View SolutionThe mean and variance of 7 observations are 8 and 16 respectively. If five observations are 2, 4, 10, 12, 14, find the remaining two observations.
View SolutionThe mean and standard deviation of 6 observations are 8 and 4, respectively. If each observation is multiplied by 3, find the new mean and new standard deviation of the resulting observations.
View SolutionCalculate the standard deviation of the following frequency distribution :

View SolutionCalculate the standard deviation of the following frequency distribution :

View SolutionFollowing is the distribution of the number of out-door patients registered in a certain hospital in 100 days :
 Find the arithmetic mean and standard deviation.
View SolutionCalculate the standard deviation of the following distribution :

View SolutionCalculate the mean and standard deviation for the following distribution :

View SolutionCalculate the mean and standard deviation for the following distribution :

View SolutionCalculate the mean and standard deviation for the following distribution :

View SolutionCalculate the mean and standard deviation for the following distribution :

View SolutionCalculate the mean and standard deviation for the following distribution :

View SolutionCalculate the mean and standard deviation for the following distribution :

View SolutionIn a study of patients, following data are obtained. Find the arithmetic mean and the standard deviation of the, data :

View SolutionCalculate the mean and variance of the following data :

View SolutionCalculate the mean and variance of the following data :

View SolutionCalculate the mean and variance of the following data :

View SolutionCalculate the mean and variance of the following distribution :

View SolutionCalculate the mean and standard deviation of the distribution :

View SolutionCalculate the mean and standard deviation of the distribution :

View SolutionCalculate the mean and standard deviation of the distribution :

View SolutionCalculate the mean and standard deviation of the distribution :

View SolutionCalculate the mean and standard deviation of the distribution :

View SolutionCalculate the mean and standard deviation of the distribution :

View SolutionCalculate the mean and standard deviation of the distribution :

View SolutionCalculate the mean and standard deviation of the following distribution :

View SolutionCalculate the mean and standard deviation of the following distribution :

View SolutionFind the mean , variance and standard deviation :

View SolutionIn a survey of 950 families in a village, the following distribution of children was obtained :
 Find the mean and standard deviation of the distribution.
View SolutionThe diameters of circles (in mm) drawn in a design are given below :
 Calculate the standard deviation and mean diameter of the circles.
View SolutionFrom the data given below, state which group is more variable :

View SolutionIn a study to test the effectiveness of new variety of seeds, an experiment was performed with 50 experimental fields and the following results were obtained :
 Find the variance and standard deviation.
View SolutionThe weights of a group of children at 6 month are given below:
 Find the standard deviation.
View SolutionIn the study of 79 diabetic patients, the following data are obtained. Find the variance and the standard deviation without finding the average (i.e. using deviation method).

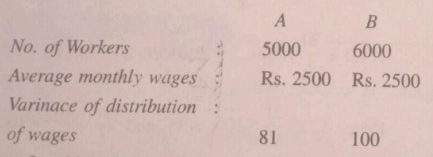
View SolutionTwo plants A and B of a factory show following results about the number of workers and the wages paid to them :
 In which plant, A or B, is there greater variability in individual wages ?
View SolutionThe following values are calculated in respect of heights and weights of the students of a section of class XI.
 Can we say that the weights show greater variation than the heights?
View SolutionThe sum and sum of squares corresponding to length x (in cm) and weight y (in plant products are given below: `underset(i=1)overset(50)Sigma x_(i)=212,underset(i=1)overset(50)Sigmax_(i)^(2)=902.8,underset(i=1)overset(50)Sigmay_(i)=261,underset(i=1)overset(50)Sigmay_(i)^(2)=1457.6`
Which is more varying, the lengths or weight?
View SolutionFrom the data given below, state which group is more variable, A or B ?

View SolutionFrom the prices of shares X and Y below, find out which is more stable in value :

View SolutionThe following is the record of goals scored by team A in a football session.
 For the team B, mean number of goals scored per match was 2 with a standard deviation 1.25 goals. Find which team may be considered more consistent ?
View SolutionThe mean of first 11 terms of Fibonacci sequence : 1,1,2, 3, 5, 8, 13, 21, 34, 55, 89 is 21.1. Calculate the standard deviation.
View SolutionIf each of the observations `x_1, x_2, ....x_n` is increased by an amount ‘a’, where ‘a’ is a negative or positive number, show that the variance remains unchanged.
View SolutionFind the mean and standard deviation for the following data :

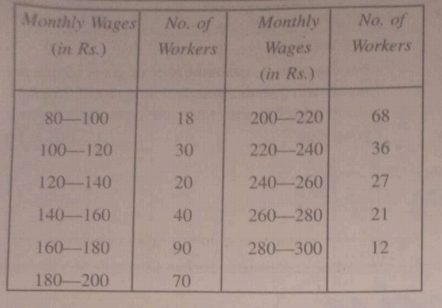
View SolutionFind the average earnings (using step-deviation method) and the standard deviation of the group of 432 workers from the data given ahead:

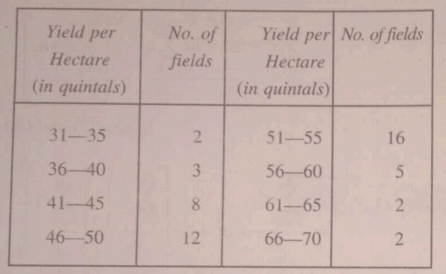
View SolutionThe yields of wheat for 50 experimental fields are given below. Find the average yield and hence find its variance.

View SolutionThe mean and standard deviation of marks obtained by 50 students of a class in three subjects- Mathematics, Physics and Chemistry are given below :
 Which of the three subjects shows the highest variability in marks and which shows the lowest ?
View SolutionFrom a frequency distribution consisting of 18 observations, the mean and the standard deviation were found to be 7 and 4 respectively. But on comparison with the original data, it was found that a figure 12 was miscopied as 21 in calculations. Calculate the correct mean and standard deviation.
View SolutionThe mean and standard deviation of 20 observations are found to be 10 and 2 respectively. On rechecking, it was found that an observation 8 was incorrect. Calculate the correct mean and standard deviation if wrong item is omitted.
View SolutionThe mean and standard deviation of 20 observations are found to be 10 and 2 respectively. On rechecking, it was found that an observation 8 was incorrect. Calculate the correct mean and standard deviation if wrong item is omitted.
View SolutionThe mean and standard deviation of a group of 100 observations were found to be 20 and 3 respectively. Later on it was found that three observations were incorrect, which were recorded as 21, 21 and 18. Find the mean and standard deviation if the incorrect observations were omitted.
View Solution
EXERCISE questions and complete solutions for chapter STATISTICS of MODERN PUBLICATION of Class 11