Complete Solutions to EXAMPLE of chapter STATISTICS of Class 11 book with complete answers and questions
| Class 11 | MATHS |
| Chapter | STATISTICS |
| RS AGGARWAL | EXAMPLE |
| Number Of Questions | 19 |
| Academic Year | 2023-24 |
Find the mean deviation about the mean for the mean for the following data :
15, 17, 10, 13, 7, 18, 9, 6, 14, 11
View SolutionFind the mean deviation about the median for the data given below :
11, 3, 8, 7, 5, 14, 10, 2, 9
View SolutionFind the mean deviation about the median for the data given below.
`45, 36, 50, 60, 53, 46, 51, 48, 72, 42.`
View SolutionFind the mean deviation about the mean for the following data :

View SolutionFind the mean deviation about the median for the following data :

View SolutionFind the mean deviation about the mean for the following data :

View SolutionCalculate the mean deviation about the median for the following data :

View SolutionCalculate the mean deviation about the median for the following data :

View SolutionFind the mean, variance and the standard deviation for the following data :
5,9,8,12,6,10,6,8
View SolutionFind the mean, standard deviation and variance of first `n` natural numbers.
View SolutionFind the mean, standard deviation and variance of first 10 multiples of 3.
View SolutionFind the variance and standard deviation for the following data :

View SolutionFind the mean, variance and standard deviation for the following data using short cut method:

View SolutionFind the standard deviation for the following data :

View SolutionCalculate mean, variance and standard deviation for the following frequency distribution:

View SolutionGiven below are the dimaters of circles (in mm) drawn in a design.

Calculate the mean diameter of the circles, variance and standard deviation.
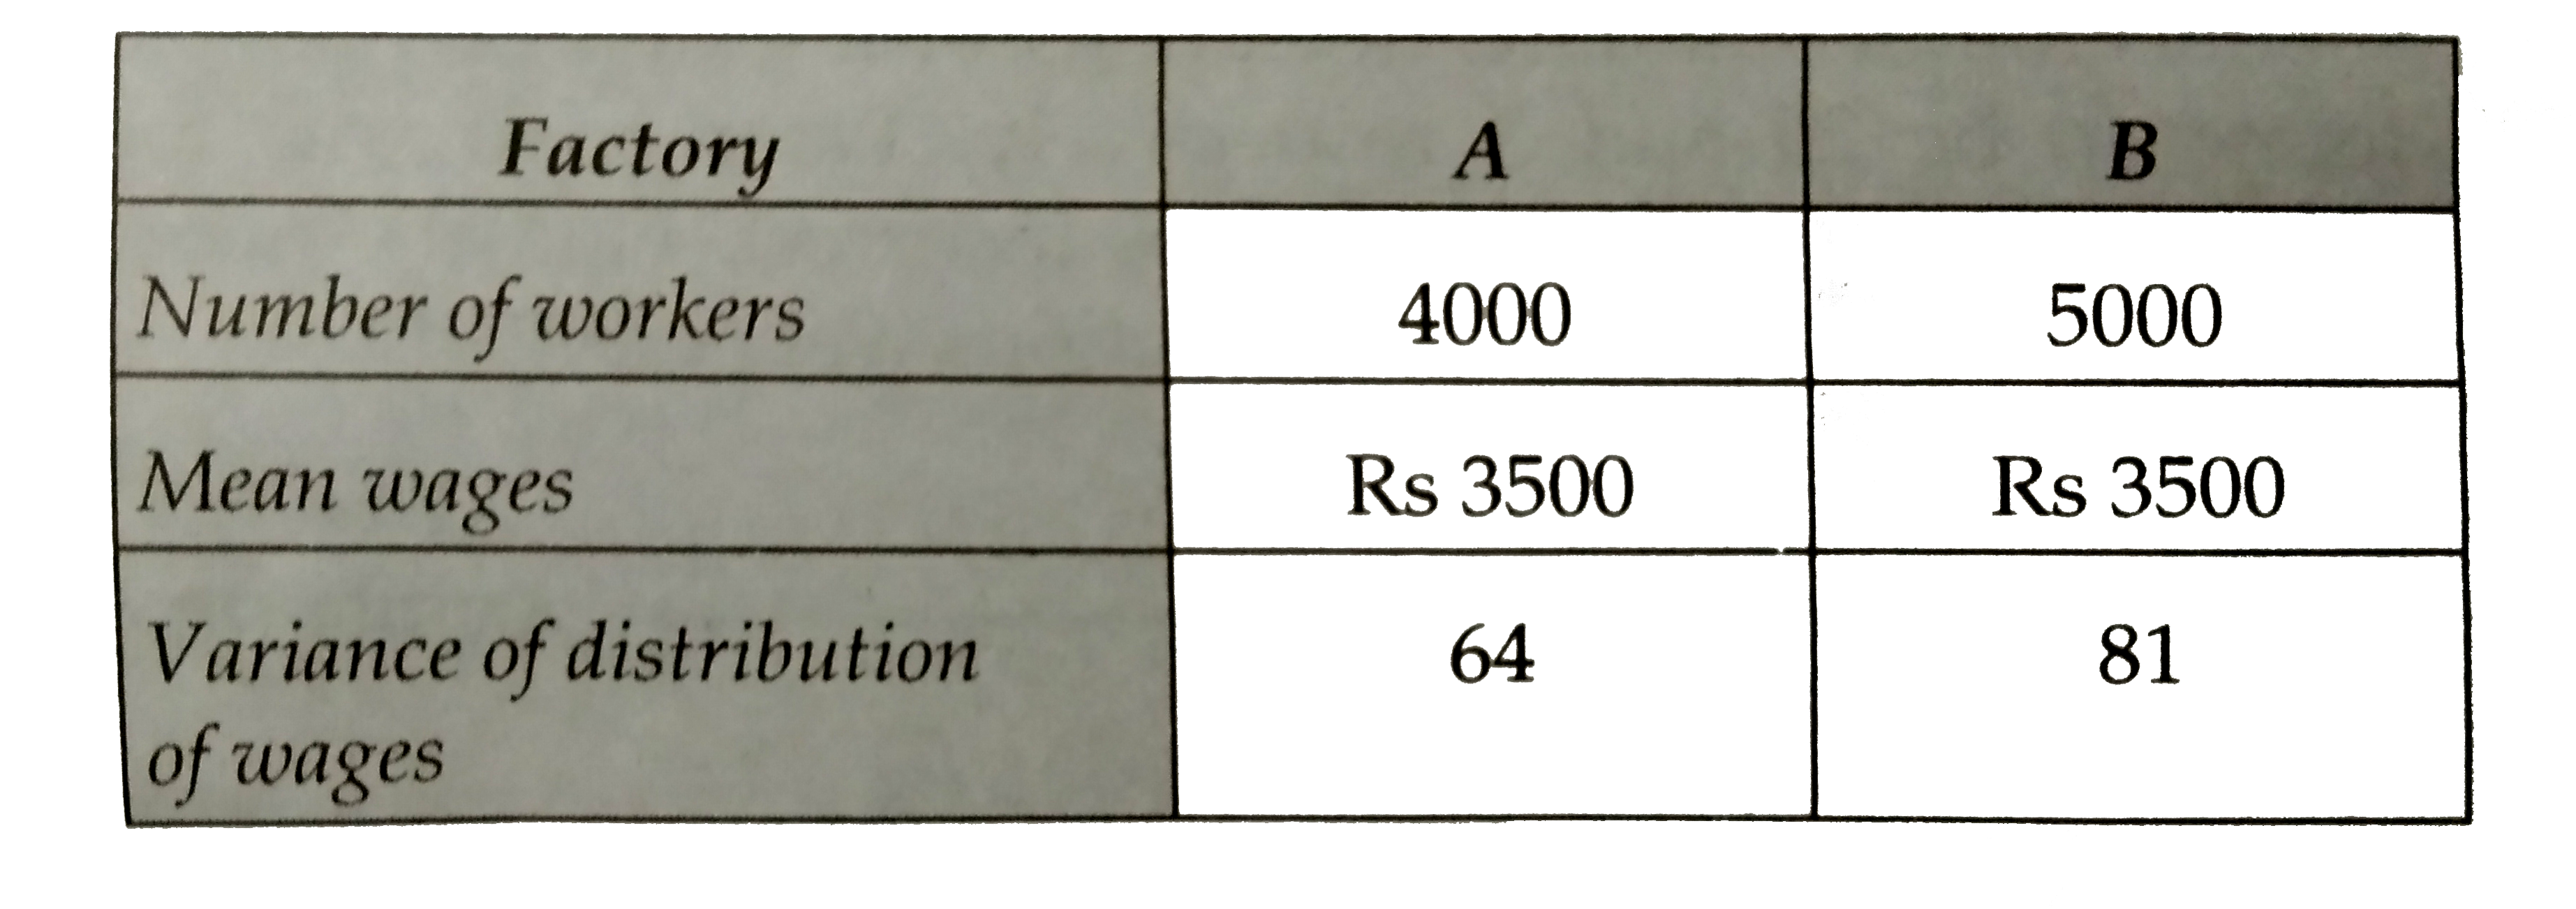
View SolutionThe following results show the number of workers and the wages paid to them in two factories A and B.

Which factory has more variation in wages ?
View SolutionCoefficient of variation of two distributions are `60%` and `75%,` and their standard deviations are `18` and `15` respectively. Find their arithmetic means.
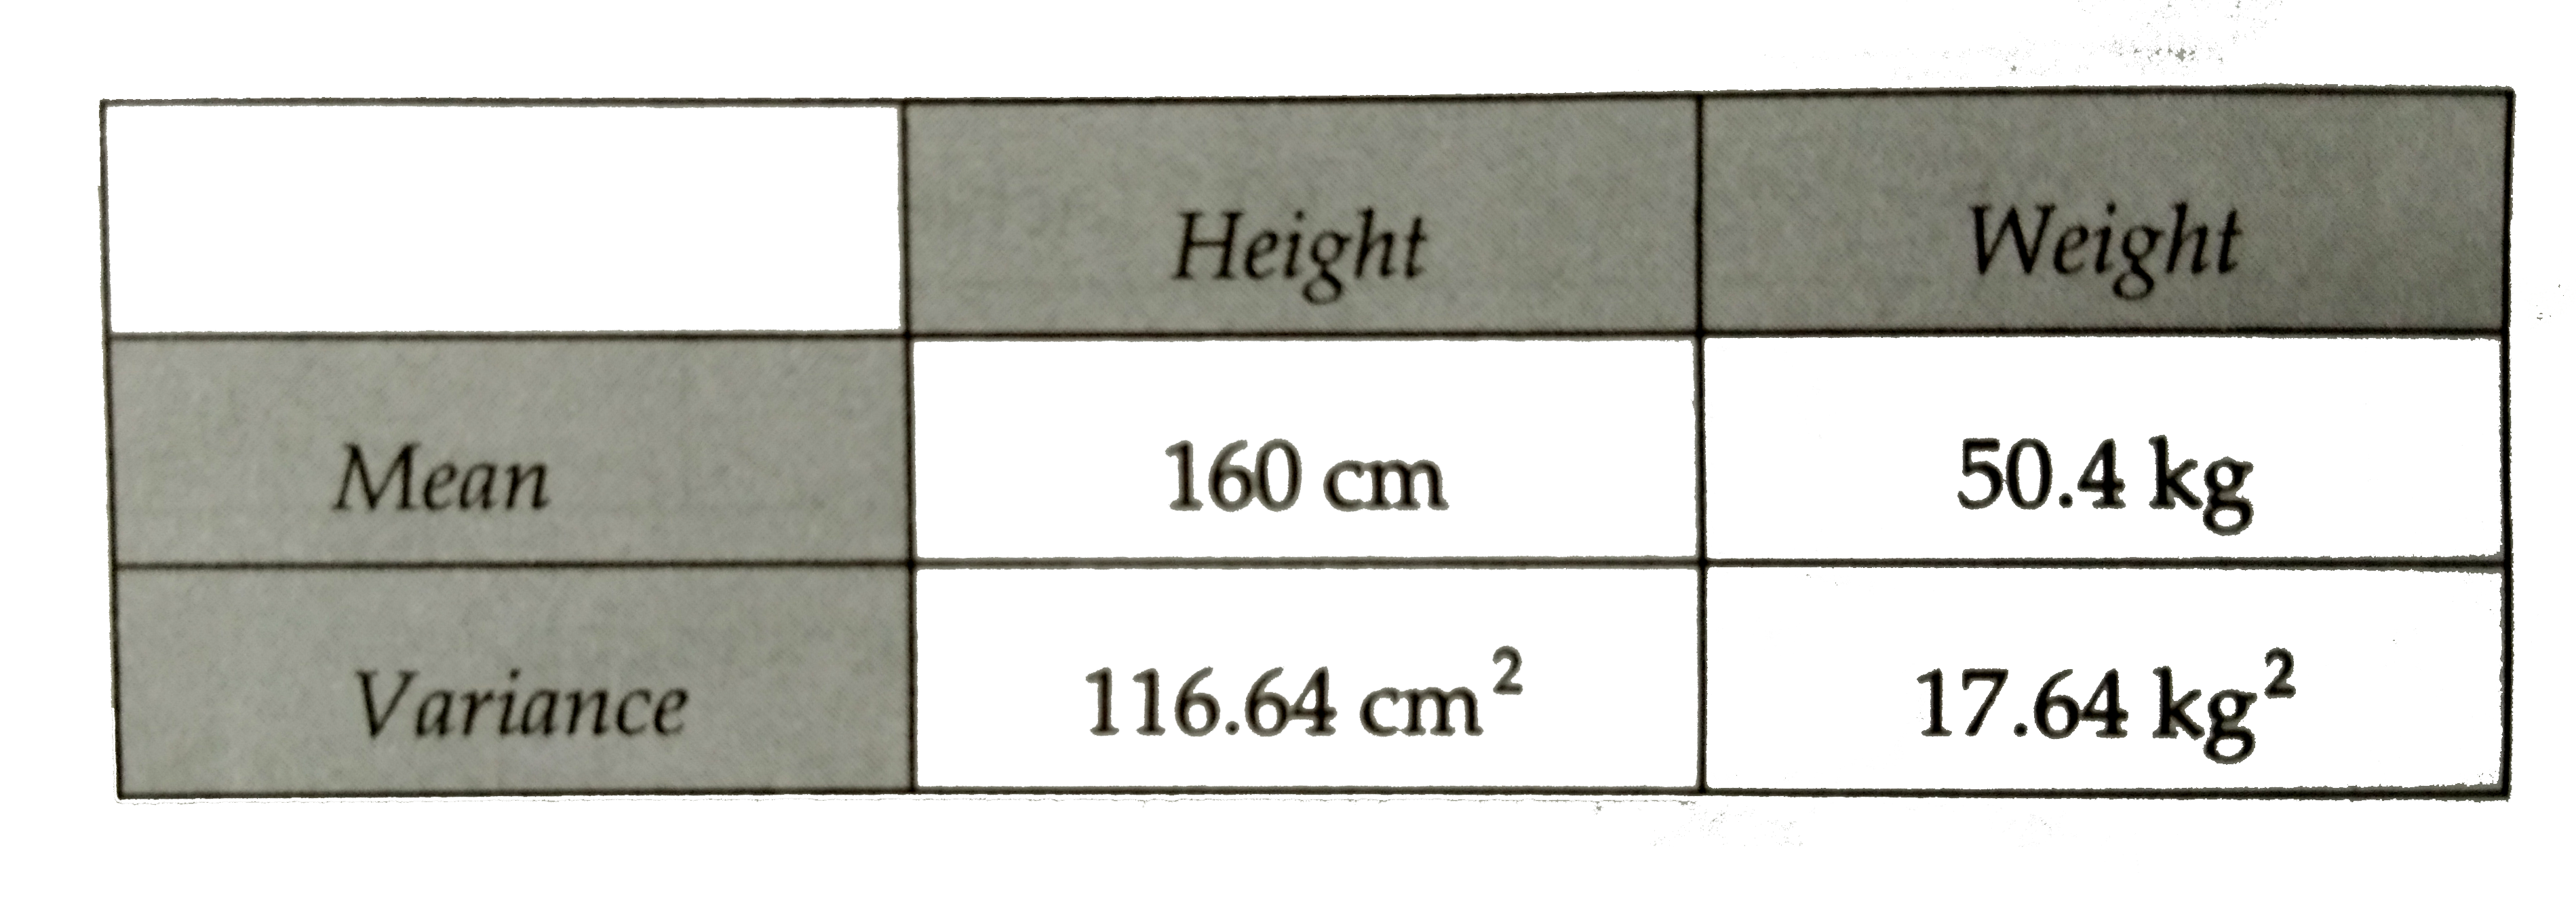
View SolutionThe mean and variance of the heights and weights of the students of a class are given below.

Show that the wieghts are more variable than heights.
View Solution
EXAMPLE questions and complete solutions for chapter STATISTICS of RS AGGARWAL MATHS (HINGLISH) of Class 11