Complete Solutions to NCERT Question (With Hints to Answers) of chapter DIAGRAMMATIC PRESENTATION OF DATA BAR DIAGRAMS AND PIE DIAGRAMS of Class 11 book with complete answers and questions
| Class 11 | ECONOMICS |
| Chapter | DIAGRAMMATIC PRESENTATION OF DATA BAR DIAGRAMS AND PIE DIAGRAMS |
| TARUN JAIN & VK OHRI | NCERT Question (With Hints to Answers) |
| Number Of Questions | 3 |
| Academic Year | 2023-24 |
Bar diagram is a
(i) one dimensional diagram , (ii) two dimensional diagram
(iii) diagram with no dimension , (iv) none of the above
View SolutionWhat kind of diagrams are more effective in representign the following?
(i) Monthly rainfall in a year
composition of the population of delhi by religion
(iii) components of cost in a factory
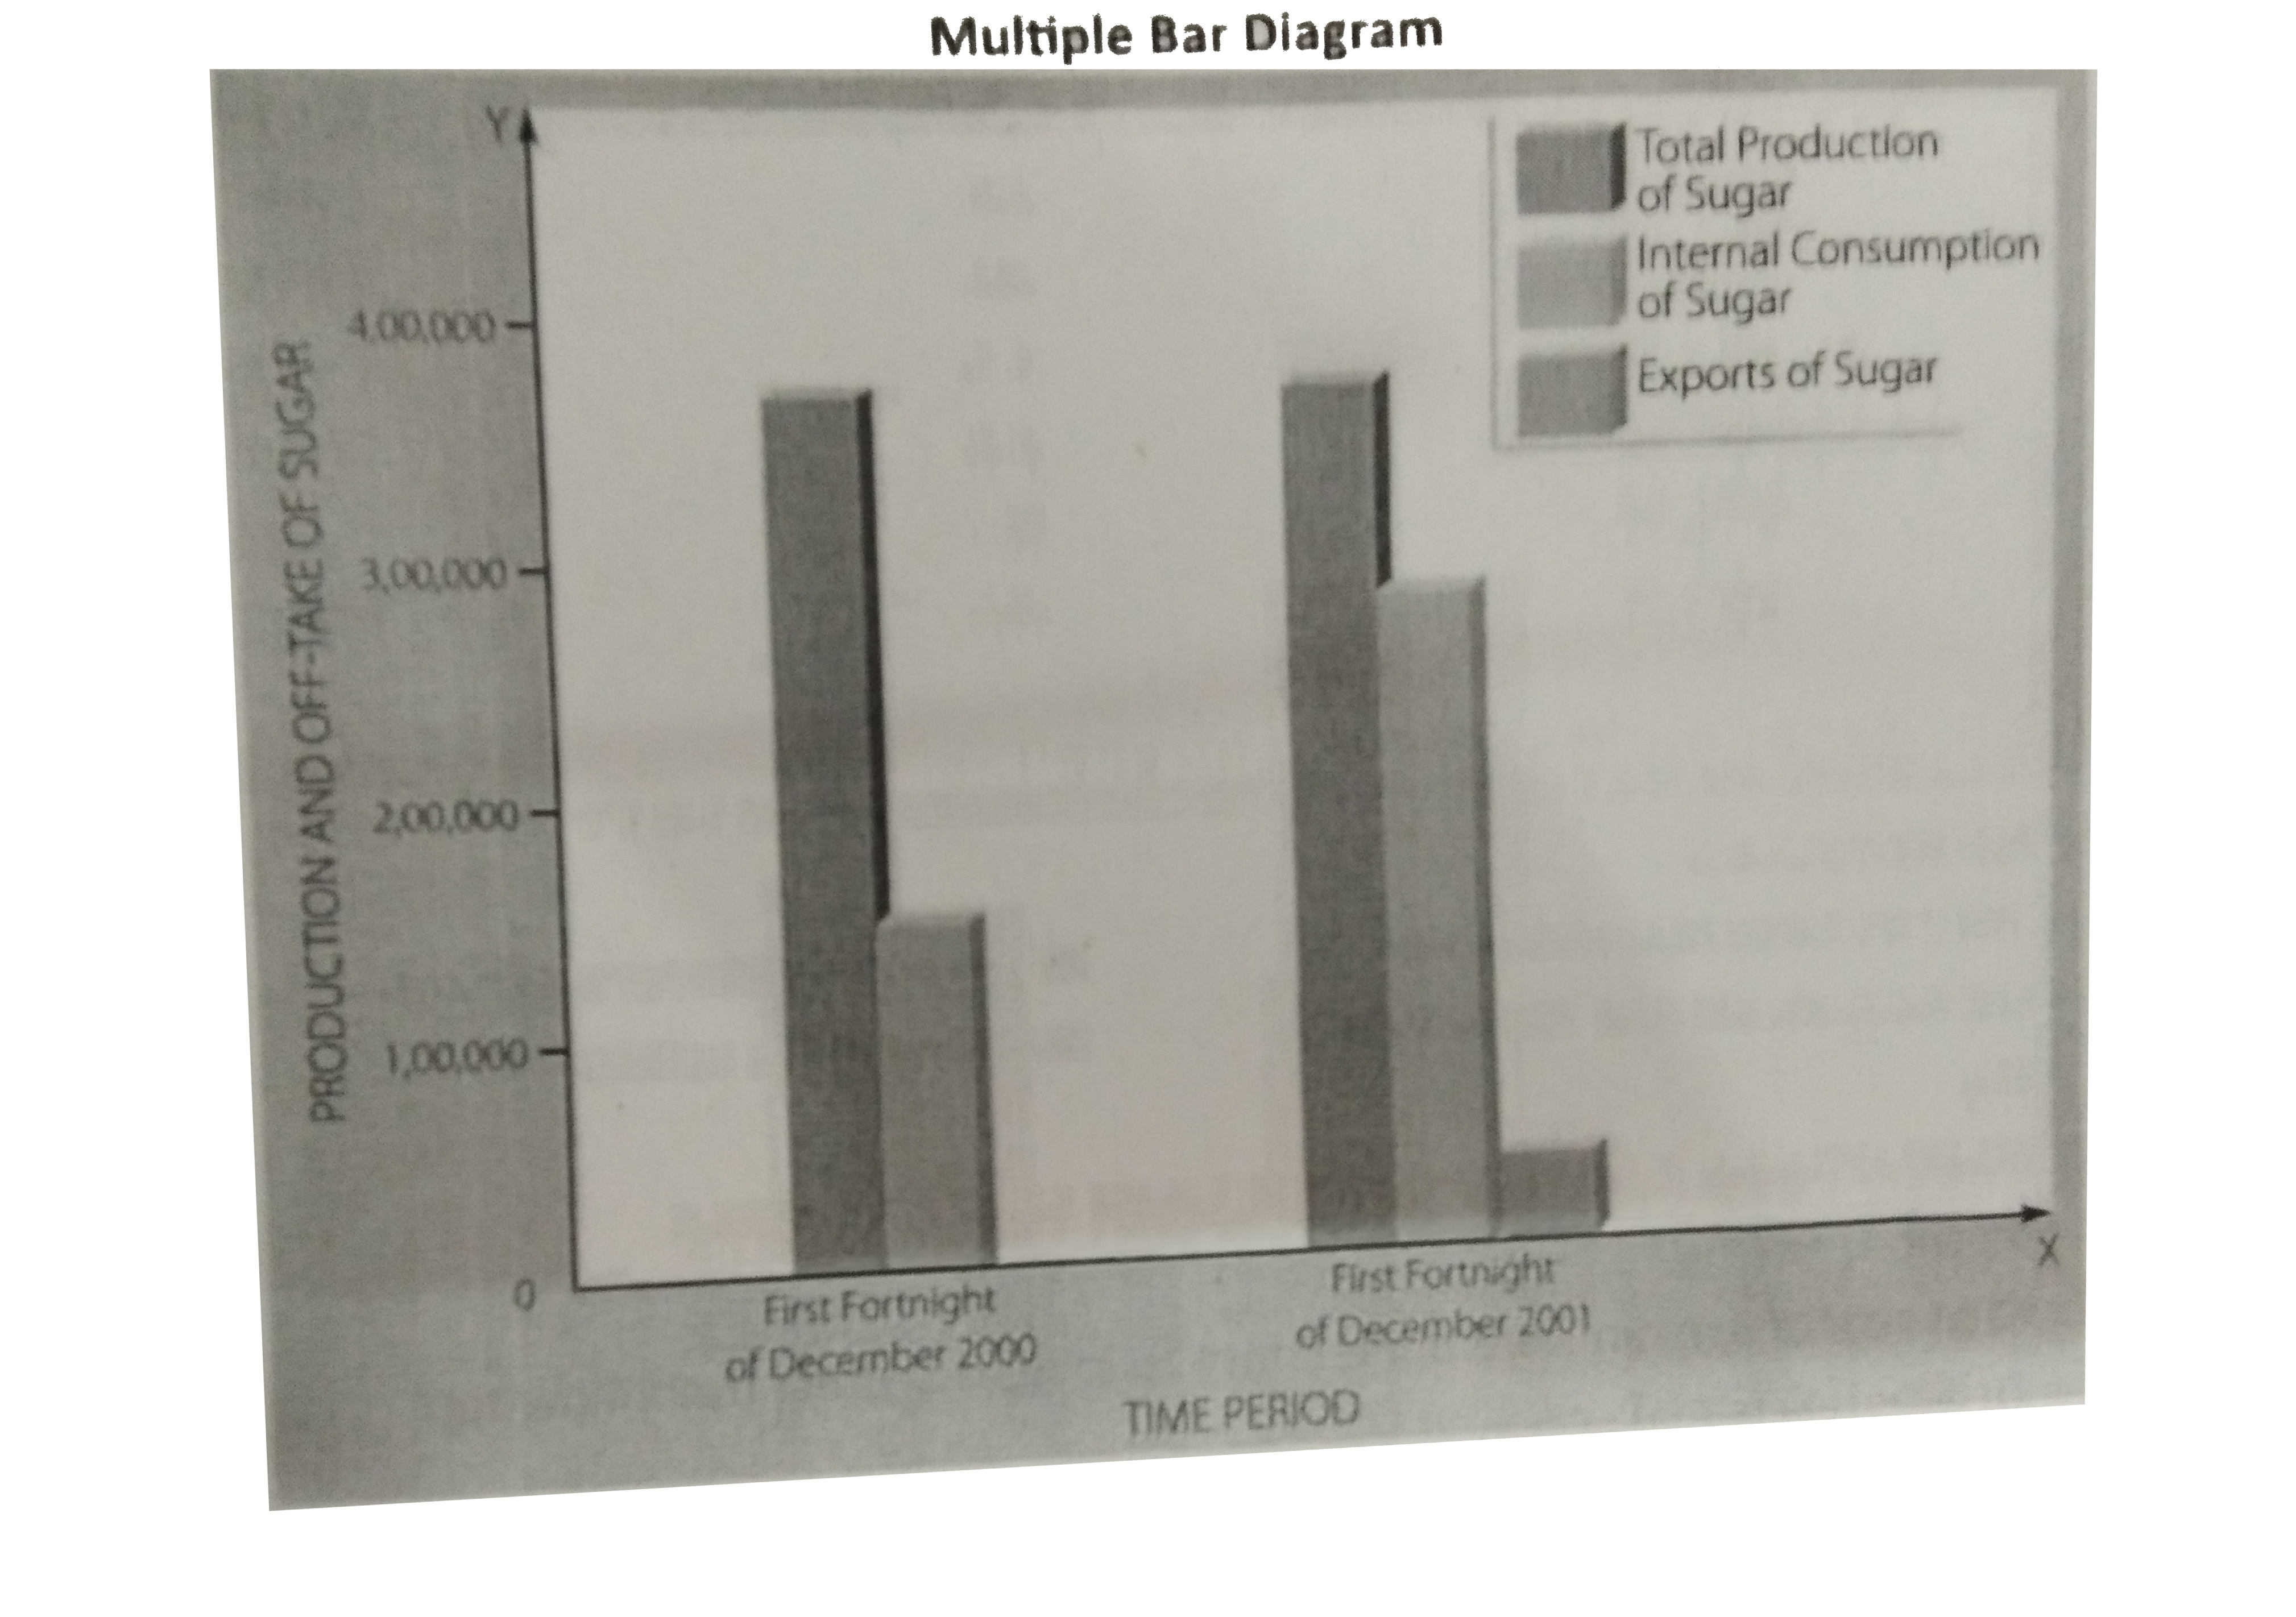
View SolutionThe indian sugar mills asocitation reproted that sugar productiion during the first fortnight of december 2001 was about 387000 tonnes as against 378000 tonnes during the same fortnight last year (2000).The off take of sugar from factories during the first fortnight of december 2001 was 28300 tonnes for internal consumption and 41000 tonnes for exprots as against 154000 tonnes for internal consumption and nil for exports during the same fortnight last season.
(i) present the data in tabular form
(ii) suppose you were to present these data in diagrammatic form which of the diagrams would you use and why?
(iii) Present these data diagrammatically


View Solution
NCERT Question (With Hints to Answers) questions and complete solutions for chapter DIAGRAMMATIC PRESENTATION OF DATA BAR DIAGRAMS AND PIE DIAGRAMS of VK GLOBAL PUBLICATION ECONOMICS (HINGLISH) of Class 11