What kind of diagrams are more effective in representign the following?
(i) Monthly rainfall in a year
composition of the population of delhi by religion
(iii) components of cost in a factory
i) Time Series Graph
ii) Pie Diagram
iii) Sub-divided bar diagram
Topper's Solved these Questions
- DIAGRAMMATIC PRESENTATION OF DATA BAR DIAGRAMS AND PIE DIAGRAMSBOOK - TARUN JAIN & VK OHRICHAPTER - DIAGRAMMATIC PRESENTATION OF DATA BAR DIAGRAMS AND PIE DIAGRAMSEXERCISE - Long Answer Type Question
10 Videos
- CORRELATIONBOOK - TARUN JAIN & VK OHRICHAPTER - CORRELATIONEXERCISE - NCERT Questions (with Hints to Answers)
10 Videos
- FREQUENCY DIAGRAMS - HISTOGRAM, POLYGON AND OGIVEBOOK - TARUN JAIN & VK OHRICHAPTER - FREQUENCY DIAGRAMS - HISTOGRAM, POLYGON AND OGIVEEXERCISE - EXERCISE NCERT
7 Videos
Similar Questions
Frame linear equations in two variables (x and y) respresenting the following informations :
(i) The sun of the ages of Aruna and Anup is 34 years.
(ii) the lenth of a rectangle is 12 m more than its breadth.
(iii) the cost of a notebook is twice the cost of a pen .
View SolutionAn organisation follows the principles of management. What are the positive effects of each of the following principles of management on the organisation ?
(i) Order , (ii) Unity of direction , (iii) Division of work
View Solution
Knowledge Check
Which of the following are covered under the Fundamental Rights in the Constitution of India ?
I. Prohibition of traffic in human beings and forced labour
II. Prohibition of employment of children in factories
III. Freedom of conscience and free profession, practice and propagation of religion
Select the correct answer using the code given below:AI and II onlyBI and III onlyCII and III onlyDI, II and III
Given below is a representation of a kind of pollution. Study the same and answer the questions that follow :

(i) Name the kind of pollution.
(ii) List any three common sources of this pollution
(iii) Mention three harmful effects of this pollution on human health.
(iv) Explain the term 'Pollutant'.
(v) Name two soil pollutants.
View SolutionWhat kind of evolution has brought similarity in the following examples :
(i)Placental cat and a marsupial cat
(ii)Fishes and whales
(iii)Darwin's finches
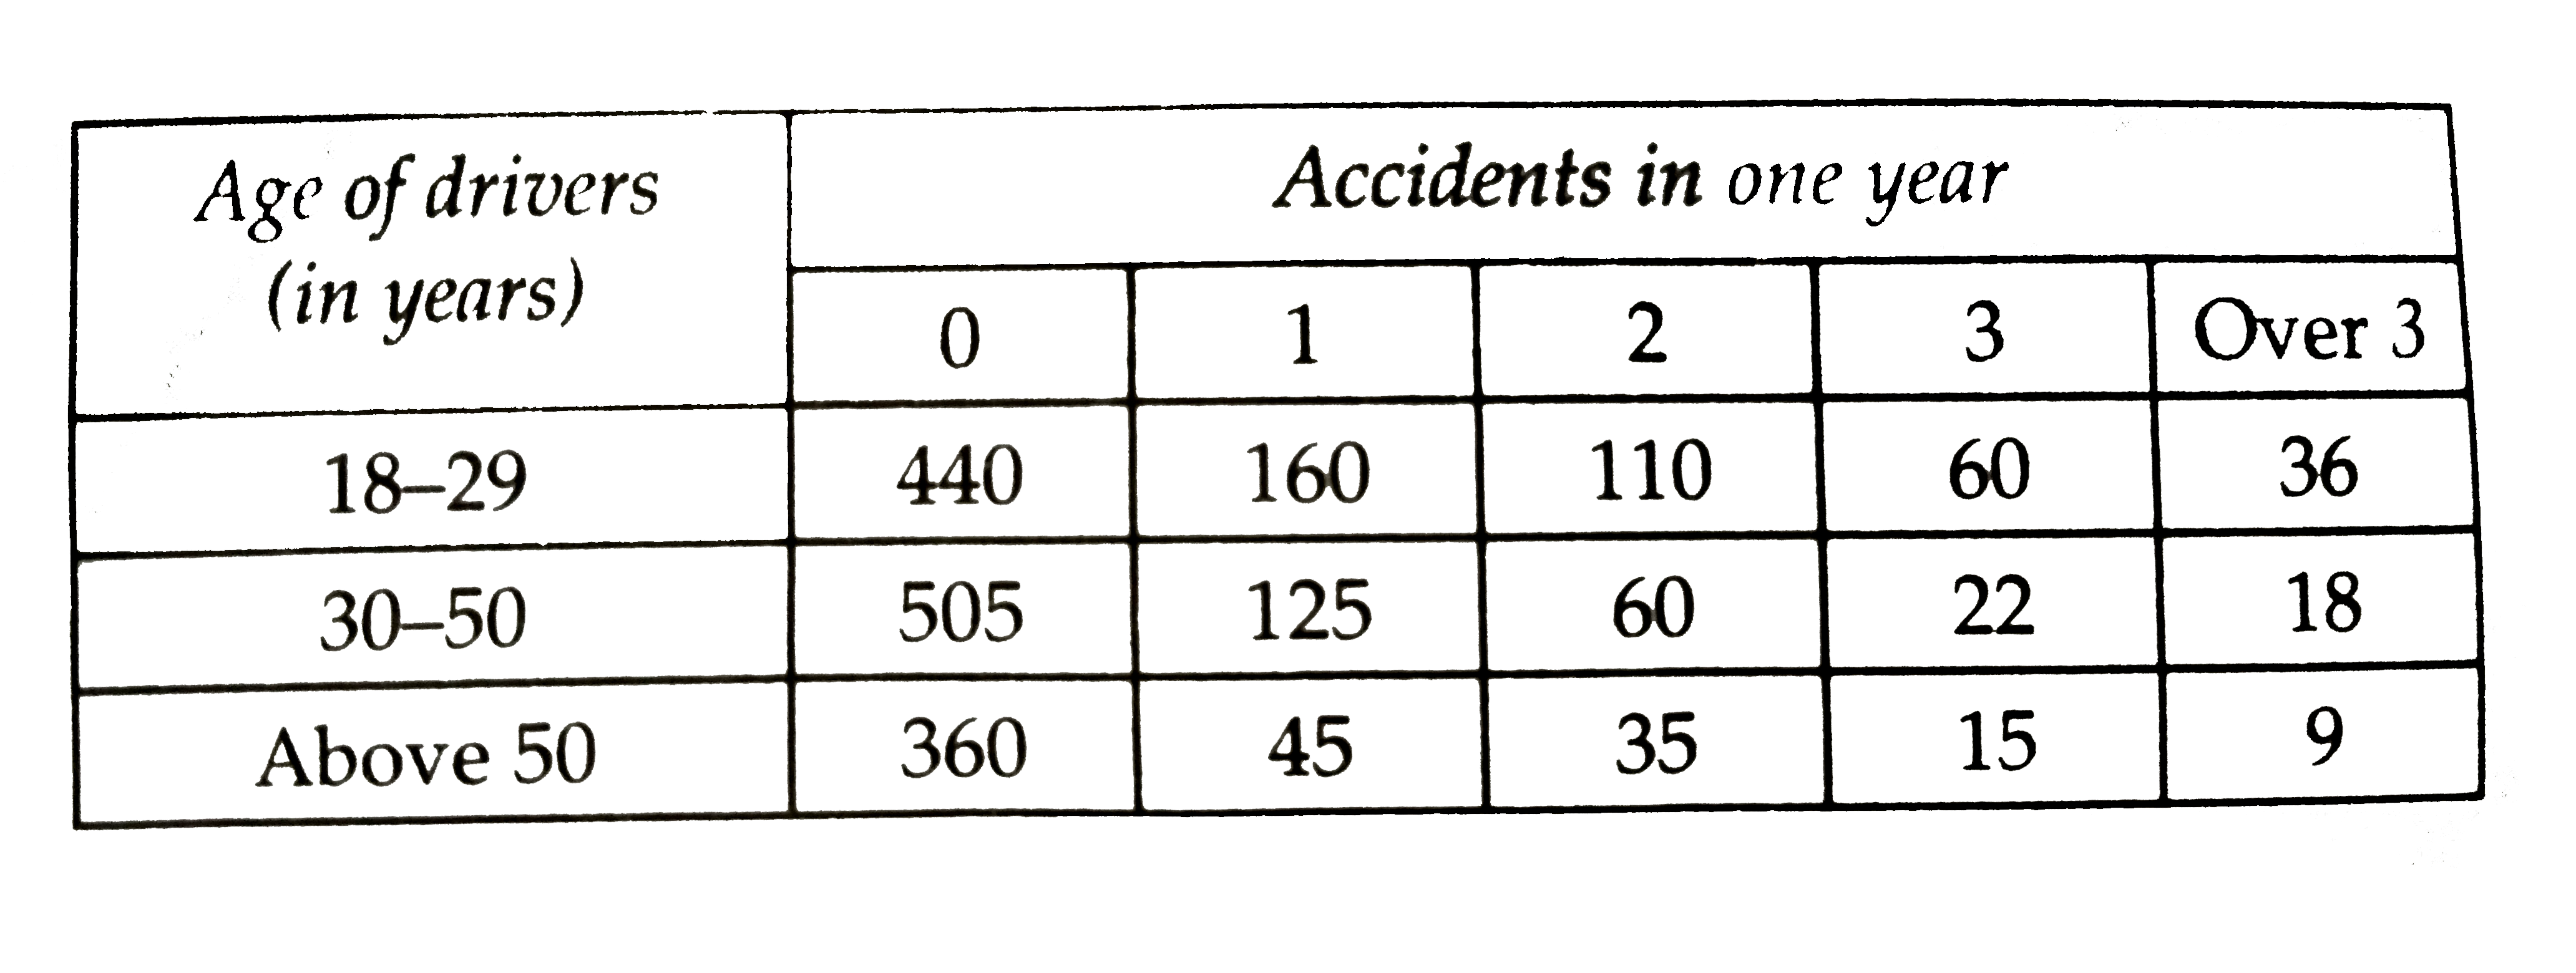
View SolutionAn insurance company selected 2000 drivers at random in particular city to find a relationship between age and accidents . The data obtained are given in the following table .

Find the probability of each of the following events for a driver chosen at random from the city :
(i) being 18−29 years of age and having exactly 3 accidents in one year .
(ii) being 30−50 years of age and having one or more accidents in one year
(iii) having no accident in one year .
View Solution(a) Leaves of a healthy potted plant were coated with vaseline. Will this plants remain healthy for long ? Give reason for your answer.
(b) What will happen to the rate of photosynthesis in a plant under the following circumstances ?
(i) cloudy day in morning but bright sunshine in the afternoon
(ii) no rainfall in the area for a considerable time
(iii) gathering of dust on the leaves.
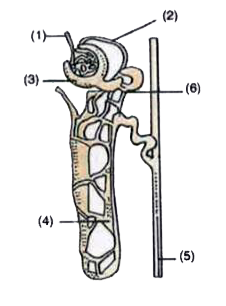
View Solution(a) Give the answers of the questions given below the following diagram :
(i) Identify 3, 4, 5 and 6 in the above figure.
(ii) What is function of 3?
(iii) If diameter of part "2" is made double to the part "1", then what will be the effect?
(b) If the prostate gland is enlarged in old age, then what will be the effect on urination?

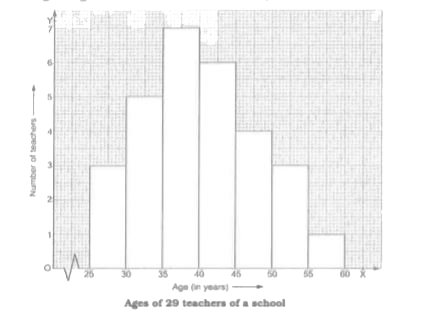
View SolutionLook at the histogram given below answer the question that follow:

(i) What information in being given by the histogram?
(ii) How many teachers are of age less than 45 years?
(iii) How many teachers are of age 40 years or more but less than 55 years?
View SolutionOn the basis of given diagram, answer the following questions :
(i) Indicate, whether price will fall or remain same with rise in output.
(ii) What does the shaded are OPRQ indicate ?
(iii) What will be the nature of MR curve ?
View Solution
