Complete Solutions to Graphical Question of chapter ELECTRON, PHOTON, PHOTOELECTRIC EFFECT AND X-RAYS of Class 12 book with complete answers and questions
| Class 12 | PHYSICS |
| Chapter | ELECTRON, PHOTON, PHOTOELECTRIC EFFECT AND X-RAYS |
| ERRORLESS | Graphical Question |
| Number Of Questions | 7 |
| Academic Year | 2023-24 |
The graph between intensity of light falling on a metallic plate `(I)` with the current `(i)` generated is
View SolutionFor a photoelectric cell the graph showing the variation of cut of voltage `(V)` with frequency `(v)` of incident light is best represented by
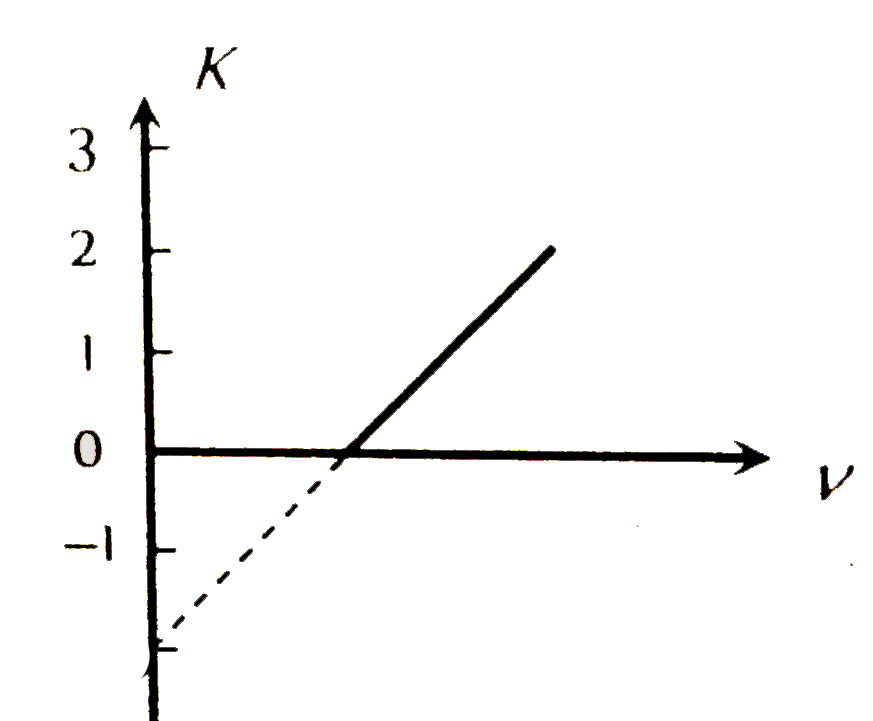
View SolutionFigure represents a graph of kinetic energy (K) of photoelectrons (in eV ) and frequency `(v)` for a metal used as cathode in photoelectric experiment. The work function of metal is
 View Solution
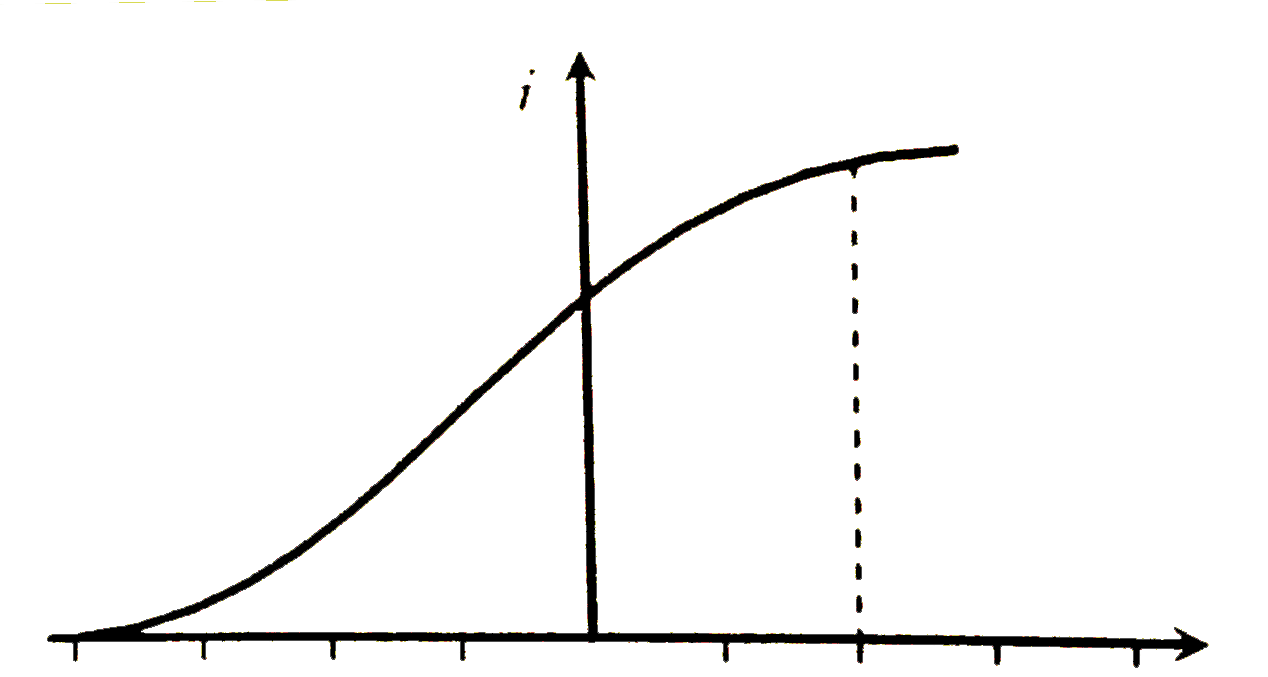
Figure represents the graph of photo current `l` versus applied voltage (V). The minimum energy of emitted photoelectrons is
 View Solution
The figure showing the correct relationship between the stopping potential V and the frequency `v` of the light for potassium and tungsten is
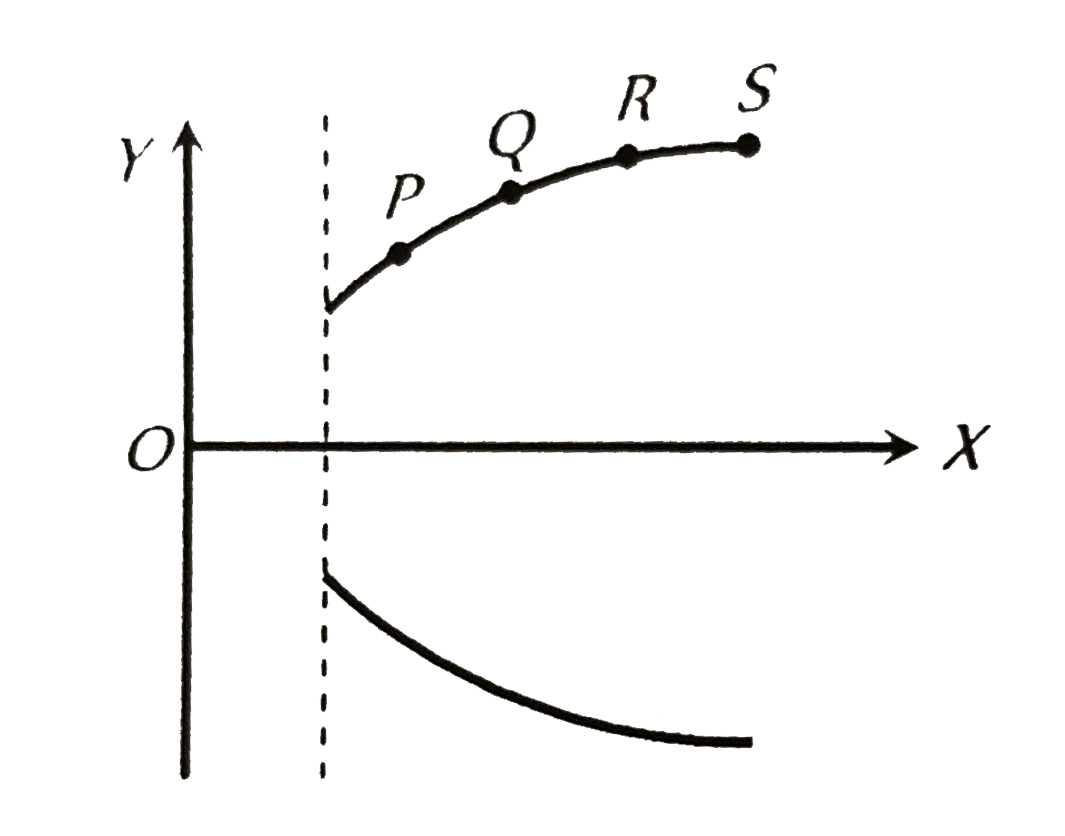
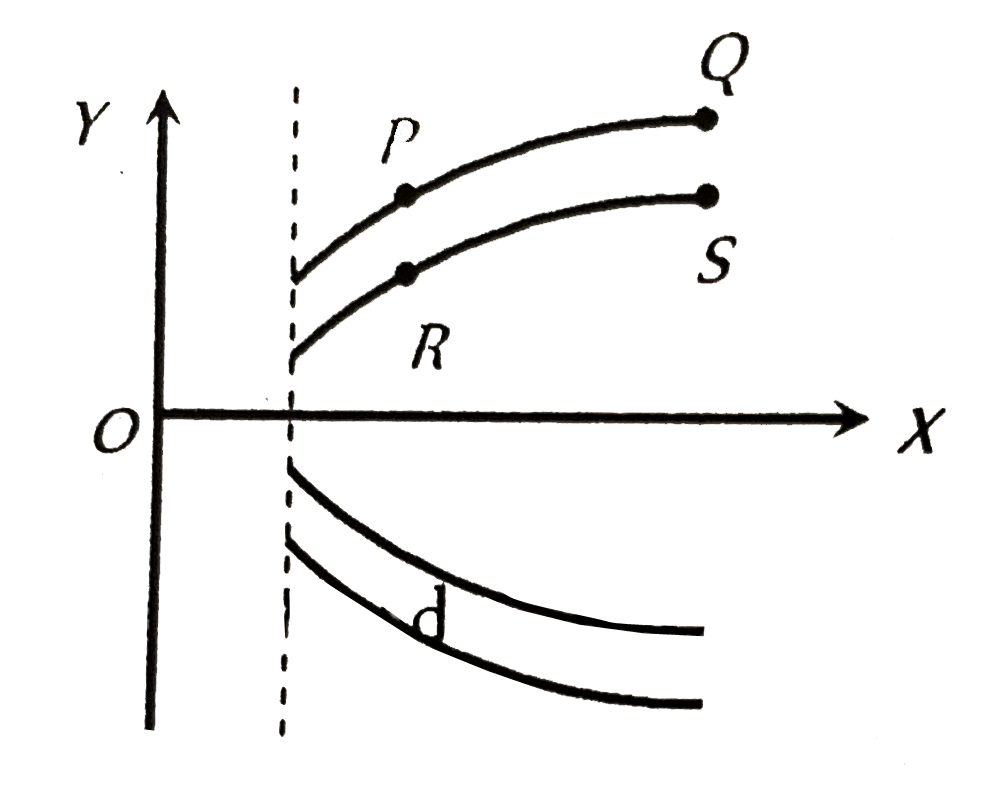
View SolutionIn a parabola spectrograph, the velocities of four positive ions P,Q,R and S are `v_(1),v_(2),v_(3)` and `v_(4)` respectively
 View Solution
In Thomson spectrograph experiment, four positive ions P,Q,R and S are situated on Y-X curve a shown in the figure
 View Solution
Graphical Question questions and complete solutions for chapter ELECTRON, PHOTON, PHOTOELECTRIC EFFECT AND X-RAYS of UNIVERSAL BOOK DEPOT 1960 PHYSICS (HINGLISH) of Class 12
